

Restoration of seagrass habitat leads to rapid recovery of coastal ecosystem services
- PMID: 33028530
- PMCID: PMC7541073
- DOI: 10.1126/sciadv.abc6434
Restoration of seagrass habitat leads to rapid recovery of coastal ecosystem services
Abstract
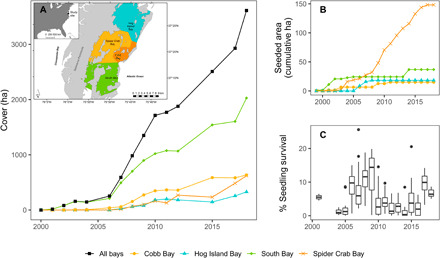
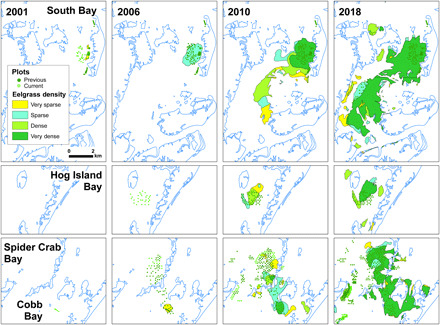
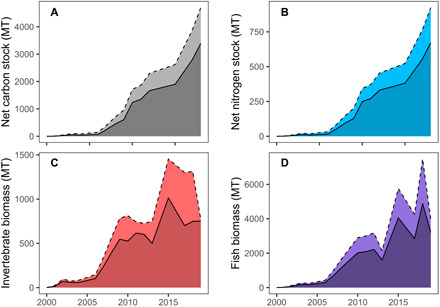
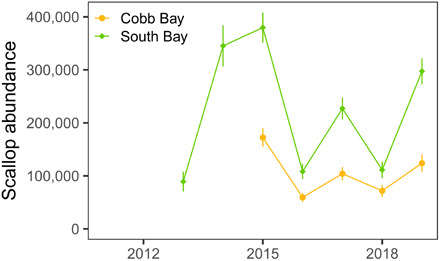
There have been increasing attempts to reverse habitat degradation through active restoration, but few large-scale successes are reported to guide these efforts. Here, we report outcomes from a unique and very successful seagrass restoration project: Since 1999, over 70 million seeds of a marine angiosperm, eelgrass (Zostera marina), have been broadcast into mid-western Atlantic coastal lagoons, leading to recovery of 3612 ha of seagrass. Well-developed meadows now foster productive and diverse animal communities, sequester substantial stocks of carbon and nitrogen, and have prompted a parallel restoration for bay scallops (Argopecten irradians) Restored ecosystem services are approaching historic levels, but we also note that managers value services differently today than they did nine decades ago, emphasizing regulating in addition to provisioning services. Thus, this study serves as a blueprint for restoring and maintaining healthy ecosystems to safeguard multiple benefits, including co-benefits that may emerge as management priorities over time.
Copyright © 2020 The Authors, some rights reserved; exclusive licensee American Association for the Advancement of Science. No claim to original U.S. Government Works. Distributed under a Creative Commons Attribution NonCommercial License 4.0 (CC BY-NC).
Figures
References
-
- Jackson J. B., Kirby M. X., Berger W. H., Bjorndal K. A., Botsford L. W., Bourque B. J., Bradbury R. H., Cooke R., Erlandson J., Estes J. A., Hughes T. P., Kidwell S., Lange C. B., Lenihan H. S., Pandolphi J. M., Peterson C. H., Steneck R. S., Tegner M. J., Warner R. R., Historical overfishing and the recent collapse of coastal ecosystems. Science 293, 629–637 (2001). - PubMed
-
- Halpern B. S., Walbridge S., Selkoe K. A., Kappel C. V., Micheli F., D’agrosa C., Bruno J. F., Casey K. S., Ebert C., Fox H. E., Fujita R., Heinemann D., Lenihan H. S., Madin E. M. P., Perry M. T., Selig E. R., Spalding M., Steneck R., Watson R., A global map of human impact on marine ecosystems. Science 319, 948–952 (2008). - PubMed
-
- Duarte C. M., Agusti S., Barbier E., Britten G. L., Castilla J. C., Gattuso J.-P., Fulweiler R. W., Hughes T. P., Knowlton N., Lovelock C. E., Lotze H. K., Predragovic M., Poloczanska E., Roberts C., Worm B., Rebuilding marine life. Nature 580, 39–51 (2020). - PubMed
-
- DeAngelis B. M., Sutton-Grier A. E., Colden A., Arkema K. K., Baillie C. J., Bennett R. O., Benoit J., Blitch S., Chatwin A., Dausman A., Gittman R. K., Greening H. S., Henkel J. R., Houge R., Howard R., Hughes A. R., Lowe J., Scyphers S. B., Sherwood E. T., Westby S., Grabowski J. H., Social factors key to landscape-scale coastal restoration: Lessons learned from three U.S. case studies. Sustainability 12, 869 (2020). - PMC - PubMed
-
- Greening H., Janicki A., Sherwood E. T., Pribble R., Johansson J. O. R., Ecosystem responses to long-term nutrient management in an urban estuary: Tampa Bay, Florida, USA. Estuar. Coast. Shelf Sci. 151, A1–A16 (2014).
Publication types
LinkOut - more resources
Full Text Sources
Other Literature Sources
