. 2020 Oct 7;6(41):eaaz9281.
doi: 10.1126/sciadv.aaz9281. Print 2020 Oct.

Superficial white matter imaging: Contrast mechanisms and whole-brain in vivo mapping

Affiliations

Superficial white matter imaging: Contrast mechanisms and whole-brain in vivo mapping

Evgeniya Kirilina et al. Sci Adv. .

Abstract

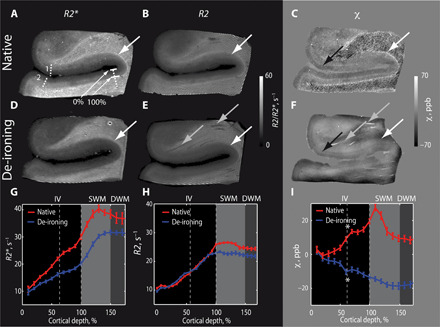
Superficial white matter (SWM) contains the most cortico-cortical white matter connections in the human brain encompassing the short U-shaped association fibers. Despite its importance for brain connectivity, very little is known about SWM in humans, mainly due to the lack of noninvasive imaging methods. Here, we lay the groundwork for systematic in vivo SWM mapping using ultrahigh resolution 7 T magnetic resonance imaging. Using biophysical modeling informed by quantitative ion beam microscopy on postmortem brain tissue, we demonstrate that MR contrast in SWM is driven by iron and can be linked to the microscopic iron distribution. Higher SWM iron concentrations were observed in U-fiber-rich frontal, temporal, and parietal areas, potentially reflecting high fiber density or late myelination in these areas. Our SWM mapping approach provides the foundation for systematic studies of interindividual differences, plasticity, and pathologies of this crucial structure for cortico-cortical connectivity in humans.


Figures

Fig. 1
Fig. 1. SWM is visible on QSM, R2*, and R2 maps in vivo.
(A) R2* (top) and QSM maps (bottom) from a representative participant show thin SWM strip (white arrows) just below the cortex with elevated R2* and magnetic susceptibility. The maps are overlaid with a cortical GM mask (yellow transparent), based on synthetic T1-weighted images generated from quantitative R1 and PD maps. (B) R2* (top) and R2 (bottom) maps obtained on another participant reveal elevated R2* and R2 in SWM.
Fig. 2
Fig. 2. MR-contrast of SWM is eliminated by tissue iron removal.
Quantitative maps of (A and D) R2*, (B and E) R2, and (C and F) χ of a postmortem brain sample of the temporal lobe were recorded before (A to C) and after (D to F) de-ironing. Cortical and subcortical profile curves are shown of averaged (G) R2*, (H) R2, and (I) χ. Averaging was performed over the sulcal region within the borders indicated in (A) by the dashed lines. Bars represent SEM across profiles. Before de-ironing R2*, R2, and χ are increased in a thin stripe underneath the cortex (large white arrows) and in cortical layer IV [black arrows in (C) and (F) and asterisks in cortical profiles in (I)]. After de-ironing the high intensity stripe in R2*, R2, and χ vanished, while the contrast between WM and GM remained preserved. The χ contrast in layer IV is reversed after de-ironing due to the negative susceptibility of myelin [indicated with asterisks in (I)]. Some of the small vessels changed their appearance (gray arrow)—most probably due to wash out of remaining blood from the tissue. Slow smooth intensity variations in the χ maps after de-ironing are in line with potential tissue alternation by the de-ironing procedure.
Fig. 3
Fig. 3. Elevated iron levels determine MR contrast in SWM.
(A) Quantitative iron map and (B) estimated myelin volume fraction map were obtained with LA-ICP-MSI and compared to (C) quantitative R2* map. Maps depicted in (A) to (C) were obtained from the same postmortem brain sample slice of the temporal lobe. Elevated iron levels in a thin (0.5 mm) stripe in the SWM dominate the R2* contrast. Note that the myelin volume fraction is not elevated in the SWM compared to DWM. (D) Averaged cortical and subcortical profiles of iron, myelin, and R2*, obtained in the sulcus between the positions marked with the dotted line in (A). R2* fits, calculated based on the linear combination of myelin and iron contributions, are also shown in (D) (in yellow). Bars represent SEM across the profiles. The white square highlighted by the arrow in SWM in (A) indicates the position of the PIXE measurements shown in Fig. 4B.
Fig. 4
Fig. 4. Cellular distribution of iron dominates iron-induced R2* relaxation in SWM.
(A) Oligodendrocytes in SWM were visualized by PIXE elemental maps of phosphorus (green), iron (red), and nickel (blue, Ni-enhanced Olig2 stain for oligodendrocyte cell somata). Locations of several oligodendrocytes are marked with white arrows. (B) Quantitative map of iron concentration in SWM was obtained with PIXE (see Fig. 3A for the position of the 200 μm by 200 μm field of view with respect to the brain slice). (C) Simulated map of microscopic intravoxel Larmor frequency perturbations was calculated using the cellular iron distribution shown in (B). (D) Simulated map of Larmor frequency distribution resulting from the iron-rich oligodendrocyte bodies is shown. This distribution was obtained by thresholding the map shown in (B) at the level of 70 μg/g wtw. (E) Line shape of water MR signal resulting from the Larmor frequency distributions [(C) and (D)] was best described by Gaussian and Lorentzian line shapes, respectively. The direction of B0 is indicated by a black arrow in (C) and (D).
Fig. 5
Fig. 5. SWM contrast varies across the brain.
(A) R2* in SWM (defined as a surface 0.5 mm below the cortical GM-WM interface) corrected for orientation dependent contributions of iron and myelinated fibers reflects iron accumulation in SWM. Low values were found in the primary visual cortex (dark arrow). High values were visible in the frontal (white arrow), temporal, and parietal association areas. (B) Susceptibility maps of SWM. (C) Intracortical R1 maps at the middle cortical surface. High R1 values are seen in the highly myelinated primary visual, motor, and somatosensory cortical areas. The primary visual area with high intracortical myelination (black arrow) exhibits low R2* values in the adjacent SWM, while association areas with low intracortical myelination (e.g., white arrow) show high SWM R2* values.

Similar articles

Cited by

References

    1. A. Schuez, V. Braitenberg, Cortical Areas: Unity and Diversity (Taylor & Fransis, 2002), pp. 377–386.
    1. Zikopoulos B., Barbas H., Changes in prefrontal axons may disrupt the network in autism. J. Neurosci. 30, 14595–14609 (2010). - PMC - PubMed
    1. Liu M., Bernhardt B. C., Hong S.-J., Caldairou B., Bernasconi A., Bernasconi N., The superficial white matter in temporal lobe epilepsy: A key link between structural and functional network disruptions. Brain 139, 2431–2440 (2016). - PMC - PubMed
    1. Carmeli C., Fornari E., Jalili M., Meuli R., Knyazeva M. G., Structural covariance of superficial white matter in mild Alzheimer’s disease compared to normal aging. Brain Behav. 4, 721–737 (2014). - PMC - PubMed
    1. Suárez-Solá M. L., González-Delgado F. J., Pueyo-Morlans M., Medina-Bolívar O. C., Hernández-Acosta N. C., González-Gómez M., Meyer G., Neurons in the white matter of the adult human neocortex. Front. Neuroanat. 3, 7 (2009). - PMC - PubMed

Publication types

LinkOut - more resources