. 2020 Oct 7:371:m3588.
doi: 10.1136/bmj.m3588.

Effect of school closures on mortality from coronavirus disease 2019: old and new predictions

Affiliations

Effect of school closures on mortality from coronavirus disease 2019: old and new predictions

Ken Rice et al. BMJ. .

Abstract

Objective: To replicate and analyse the information available to UK policymakers when the lockdown decision was taken in March 2020 in the United Kingdom.

Design: Independent calculations using the CovidSim code, which implements Imperial College London's individual based model, with data available in March 2020 applied to the coronavirus disease 2019 (covid-19) epidemic.

Setting: Simulations considering the spread of covid-19 in Great Britain and Northern Ireland.

Population: About 70 million simulated people matched as closely as possible to actual UK demographics, geography, and social behaviours.

Main outcome measures: Replication of summary data on the covid-19 epidemic reported to the UK government Scientific Advisory Group for Emergencies (SAGE), and a detailed study of unpublished results, especially the effect of school closures.

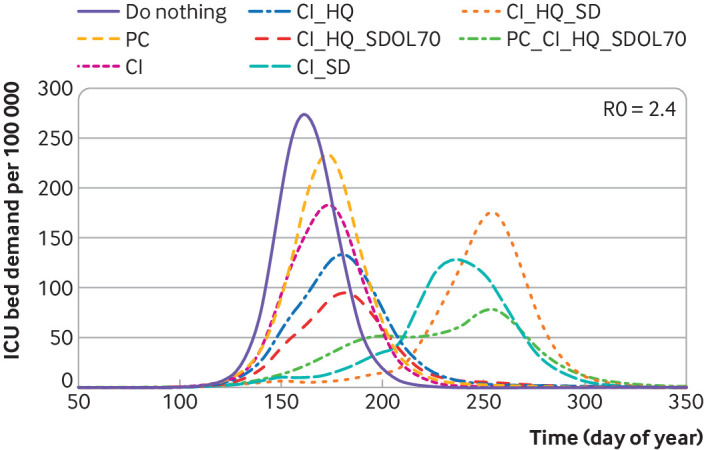
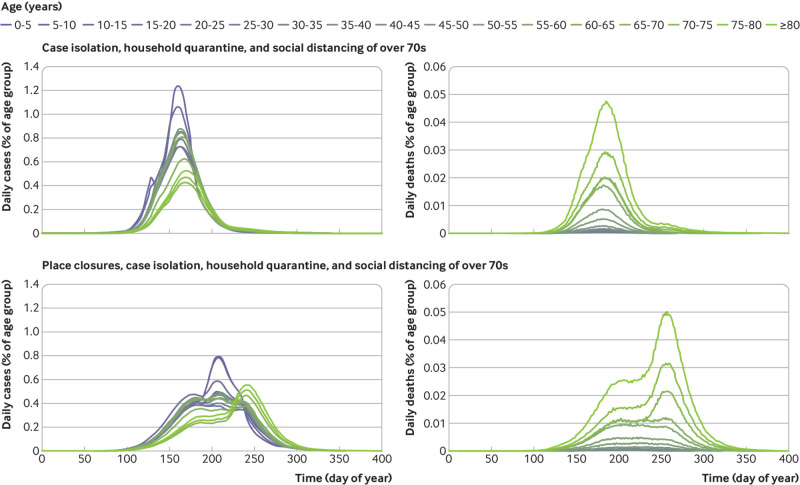
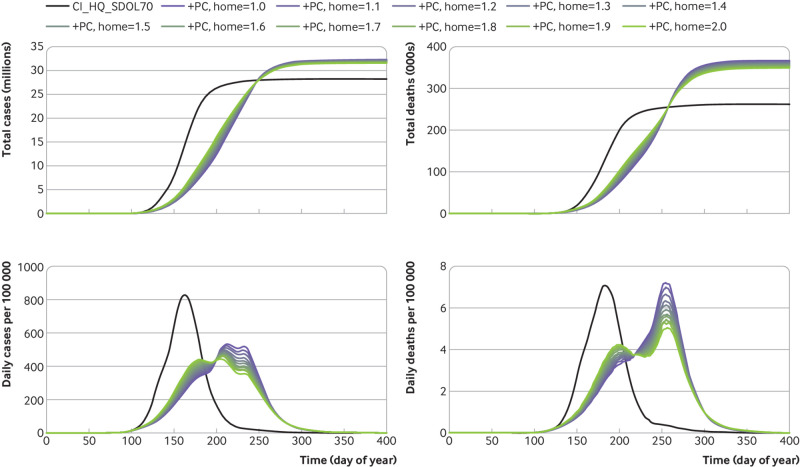
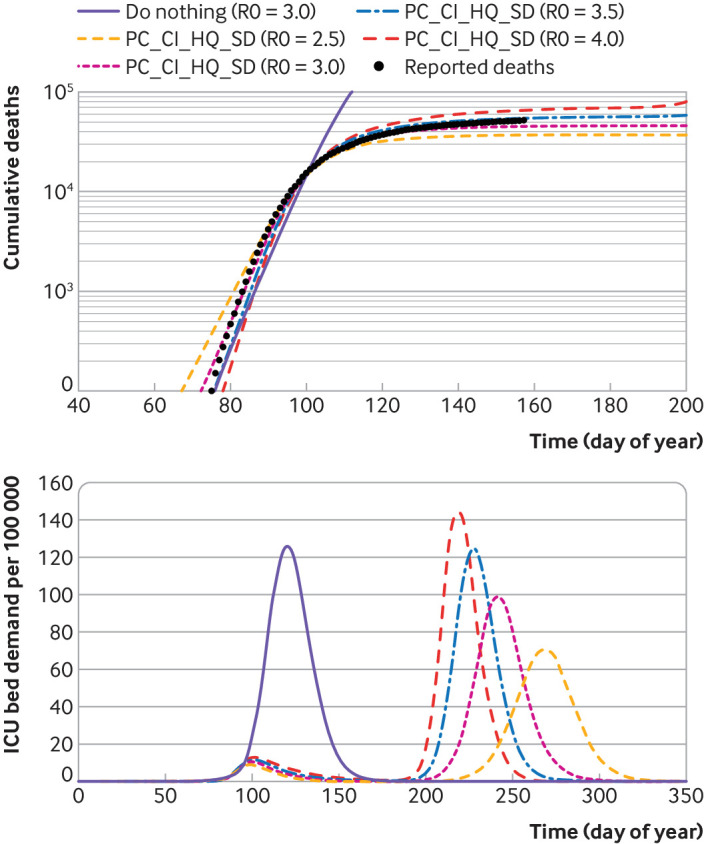
Results: The CovidSim model would have produced a good forecast of the subsequent data if initialised with a reproduction number of about 3.5 for covid-19. The model predicted that school closures and isolation of younger people would increase the total number of deaths, albeit postponed to a second and subsequent waves. The findings of this study suggest that prompt interventions were shown to be highly effective at reducing peak demand for intensive care unit (ICU) beds but also prolong the epidemic, in some cases resulting in more deaths long term. This happens because covid-19 related mortality is highly skewed towards older age groups. In the absence of an effective vaccination programme, none of the proposed mitigation strategies in the UK would reduce the predicted total number of deaths below 200 000.

Conclusions: It was predicted in March 2020 that in response to covid-19 a broad lockdown, as opposed to a focus on shielding the most vulnerable members of society, would reduce immediate demand for ICU beds at the cost of more deaths long term. The optimal strategy for saving lives in a covid-19 epidemic is different from that anticipated for an influenza epidemic with a different mortality age profile.


Conflict of interest statement

Competing interests: All authors have completed the ICMJE uniform disclosure form at www.icmje.org/coi_disclosure.pdf and declare: support from UK Research and Innovation for the submitted work; no financial relationships with any organisations that might have an interest in the submitted work in the previous three years; no other relationships or activities that could appear to have influenced the submitted work.

Figures

Fig 1
Fig 1
Flattening the curve. The first five curves are the same scenarios as presented in figure 2 of report 9. Three additional scenarios are also shown (summarised in table 1 and table 3). The scenario of place closures, case isolation, household quarantine, and social distancing of over 70s would minimise peak demand for intensive care but prolong the epidemic, resulting in more people needing intensive care and more deaths. These findings illustrate why adding place closures to a scenario with case isolation, household quarantine, and social distancing of over 70s can lead to more deaths than the equivalent scenario without place closures. Doing so suppresses the infection when the interventions are present but leads to a second wave when interventions are lifted. In the model this happened in July 2020, after a 91 day lockdown: in practice the first lockdown was extended into August, so the second wave was postponed to September. The total number of deaths in the scenario of case isolation, household quarantine, and social distancing of over 70s is 260 000, whereas when place closures are included the total number is 350 000. Similarly, comparing general social distancing with equivalent scenarios without social distancing, the second wave peak in the case isolation, household quarantine, and general social distancing scenario is higher than the first wave peak in the case isolation and household quarantine scenario. ICU=intensive care unit; PC=place closures; CI=case isolation; HQ=household quarantine; SDOL70=social distancing of over 70s; SD=general social distancing
Fig 2
Fig 2
Simulated values for daily numbers of people with coronavirus disease 2019 and deaths related to two scenarios. Interventions are triggered by reaching 100 cumulative intensive care unit cases. After the trigger, all the interventions are in place for 91 days: the general social distancing runs to day 194 and the enhanced social distancing for over 70s runs for an extra 30 days. Results are broken down into age categories, with social distancing of over 70s interventions affecting the three oldest groups. In the case isolation, household quarantine, and social distancing of over 70s scenario, a single peak of cases is seen, with greatest infection in the younger age groups but most deaths in the older age groups. In the place closures, case isolation, household quarantine, and social distancing of over 70s scenario, three peaks occur in the plot of daily cases, with the first peak appearing at a similar time to the other scenario, but with reduced severity. The second peak seems to be a response to the ending of place closure and mostly affects the younger age groups; therefore has little impact on the total number of deaths. The third peak triggered by relaxing social distancing of over 70s affects the older age groups, leading to a substantial increase in the total number of deaths
Fig 3
Fig 3
Effect of place closures. Comparison of the case isolation, household quarantine, and social distancing of over 70s scenario with the same scenario but place closure included. After the trigger at 100 cumulative intensive care unit cases, all the interventions are in place for 91 days: general social distancing runs to day 194 and social distancing for over 70s runs for an extra 30 days. With place closure the effect of increasing the amount of in-household interactions by a factor (home) of up to 2 is shown, which results in cases being shifted from first to later waves, but the additional place closure intervention always results in an increase in total number of cases and deaths. PC=place closures; CI=case isolation; HQ=household quarantine; SDOL70=social distancing of over 70s
Fig 4
Fig 4
Refit of the IBMIC March parameterisation based on death data through to June. Top panel shows cumulative deaths in the first wave, using data from National Records of Scotland and Connors and Fordham. Bottom panel shows demand for intensive care unit (ICU) beds per 100 000 people, including an unmitigated second wave. A range of reproduction numbers were considered and values higher than that considered in Report 9 were found to best reproduce the data. A good fit also requires an assumption that the epidemic started in January 2020, earlier than was previously assumed in Report 9. CovidSim is seen to provide a good fit to the data with a reproduction number between 3.0 and 3.5 and predicts that the demand for ICU beds would probably be limited to around 10 per 100 000 people

Comment in

  • Predicting the pandemic.
    Kurth T, Brinks R. Kurth T, et al. BMJ. 2020 Oct 12;371:m3932. doi: 10.1136/bmj.m3932. BMJ. 2020. PMID: 33046438 No abstract available.

References

    1. Ferguson NM, Cummings DA, Cauchemez S, et al. Strategies for containing an emerging influenza pandemic in Southeast Asia. Nature 2005;437:209-14. 10.1038/nature04017 - DOI - PubMed
    1. Ferguson NM. Report 9: Impact of non-pharmaceutical interventions (NPIs) to reduce COVID-19 mortality and healthcare demand. Imperial College London; 2020. https://www.imperial.ac.uk/mrc-global-infectious-disease-analysis/covid-.... - PMC - PubMed
    1. Grewelle R, De Leo G. Estimating the global infection fatality rate of covid-19. medRxiv 2020. 10.1101/2020.05.11.20098780. - DOI
    1. Pellis L, Scarabel F, Stage HB, et al. Challenges in control of Covid-19: short doubling time and long delay to effect of interventions. medRxiv 2020. 10.1101/2020.04.12.20059972v2. - DOI - PMC - PubMed
    1. Ferguson NM, Cummings DA, Fraser C, Cajka JC, Cooley PC, Burke DS. Strategies for mitigating an influenza pandemic. Nature 2006;442:448-52. 10.1038/nature04795 - DOI - PMC - PubMed

Publication types

MeSH terms

LinkOut - more resources