. 2020 Oct 7;12(564):eaay4799.
doi: 10.1126/scitranslmed.aay4799.

ICOSL+ plasmacytoid dendritic cells as inducer of graft-versus-host disease, responsive to a dual ICOS/CD28 antagonist

Affiliations

ICOSL+ plasmacytoid dendritic cells as inducer of graft-versus-host disease, responsive to a dual ICOS/CD28 antagonist

Djamilatou Adom et al. Sci Transl Med. .

Abstract

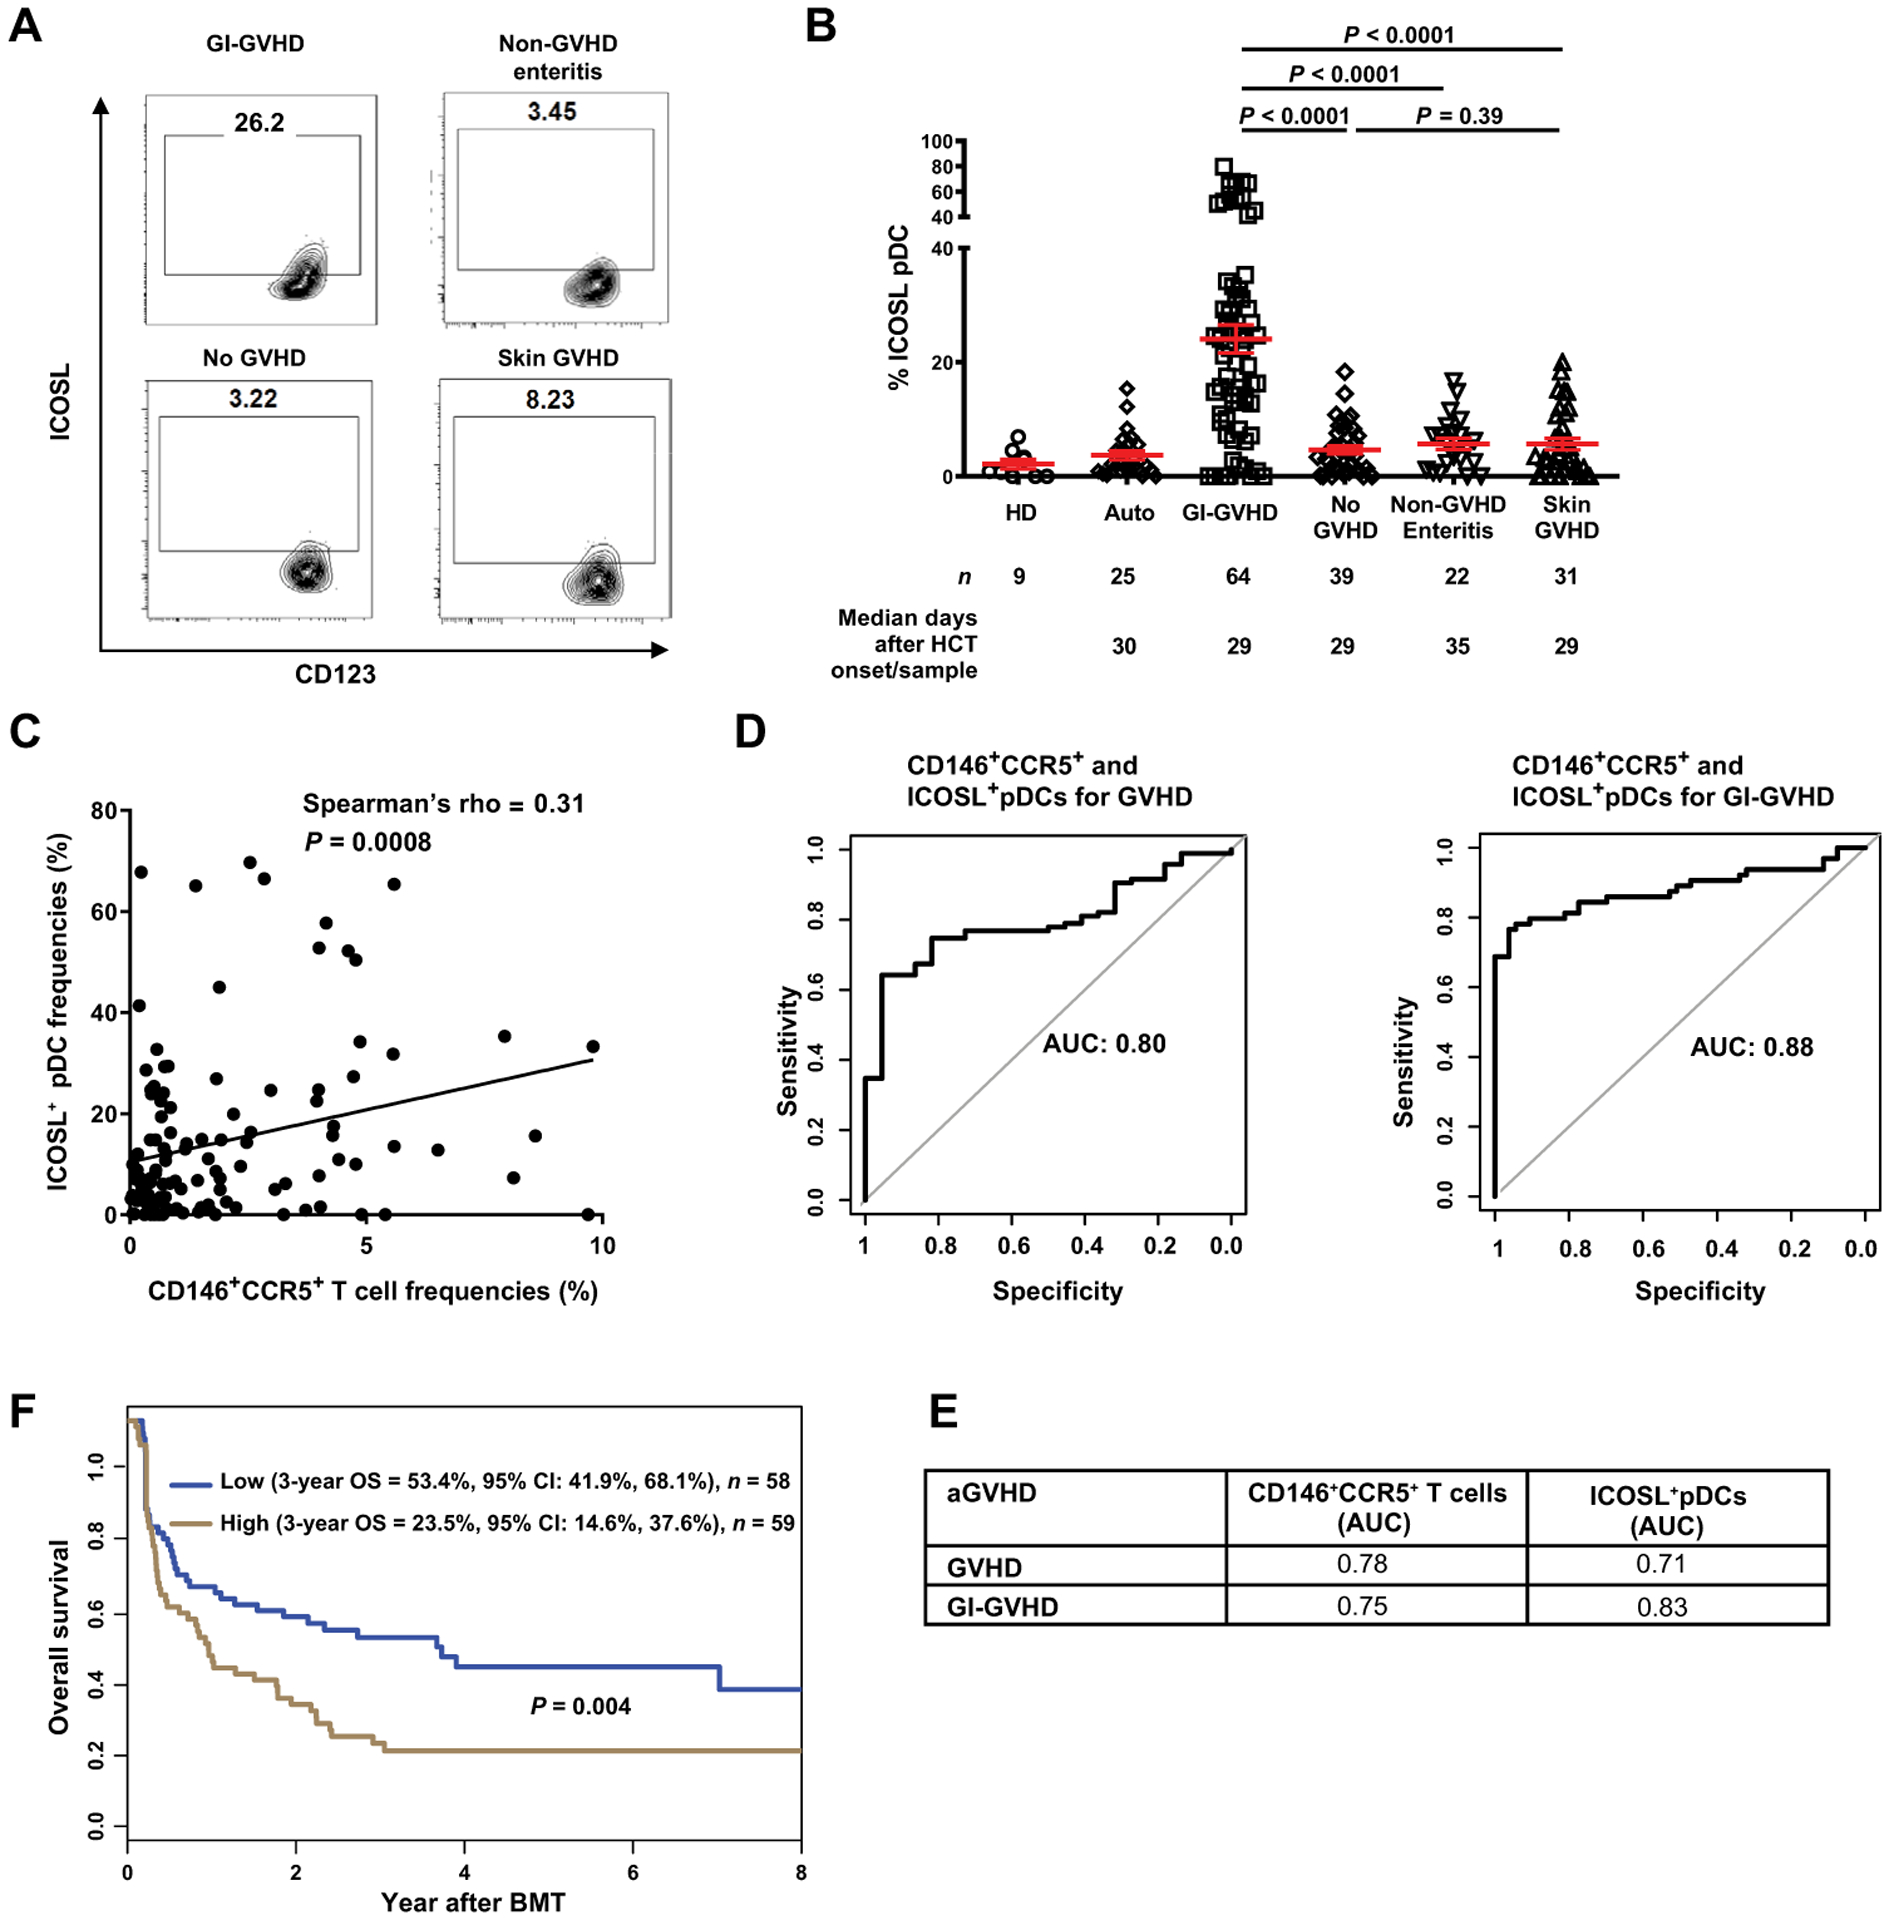
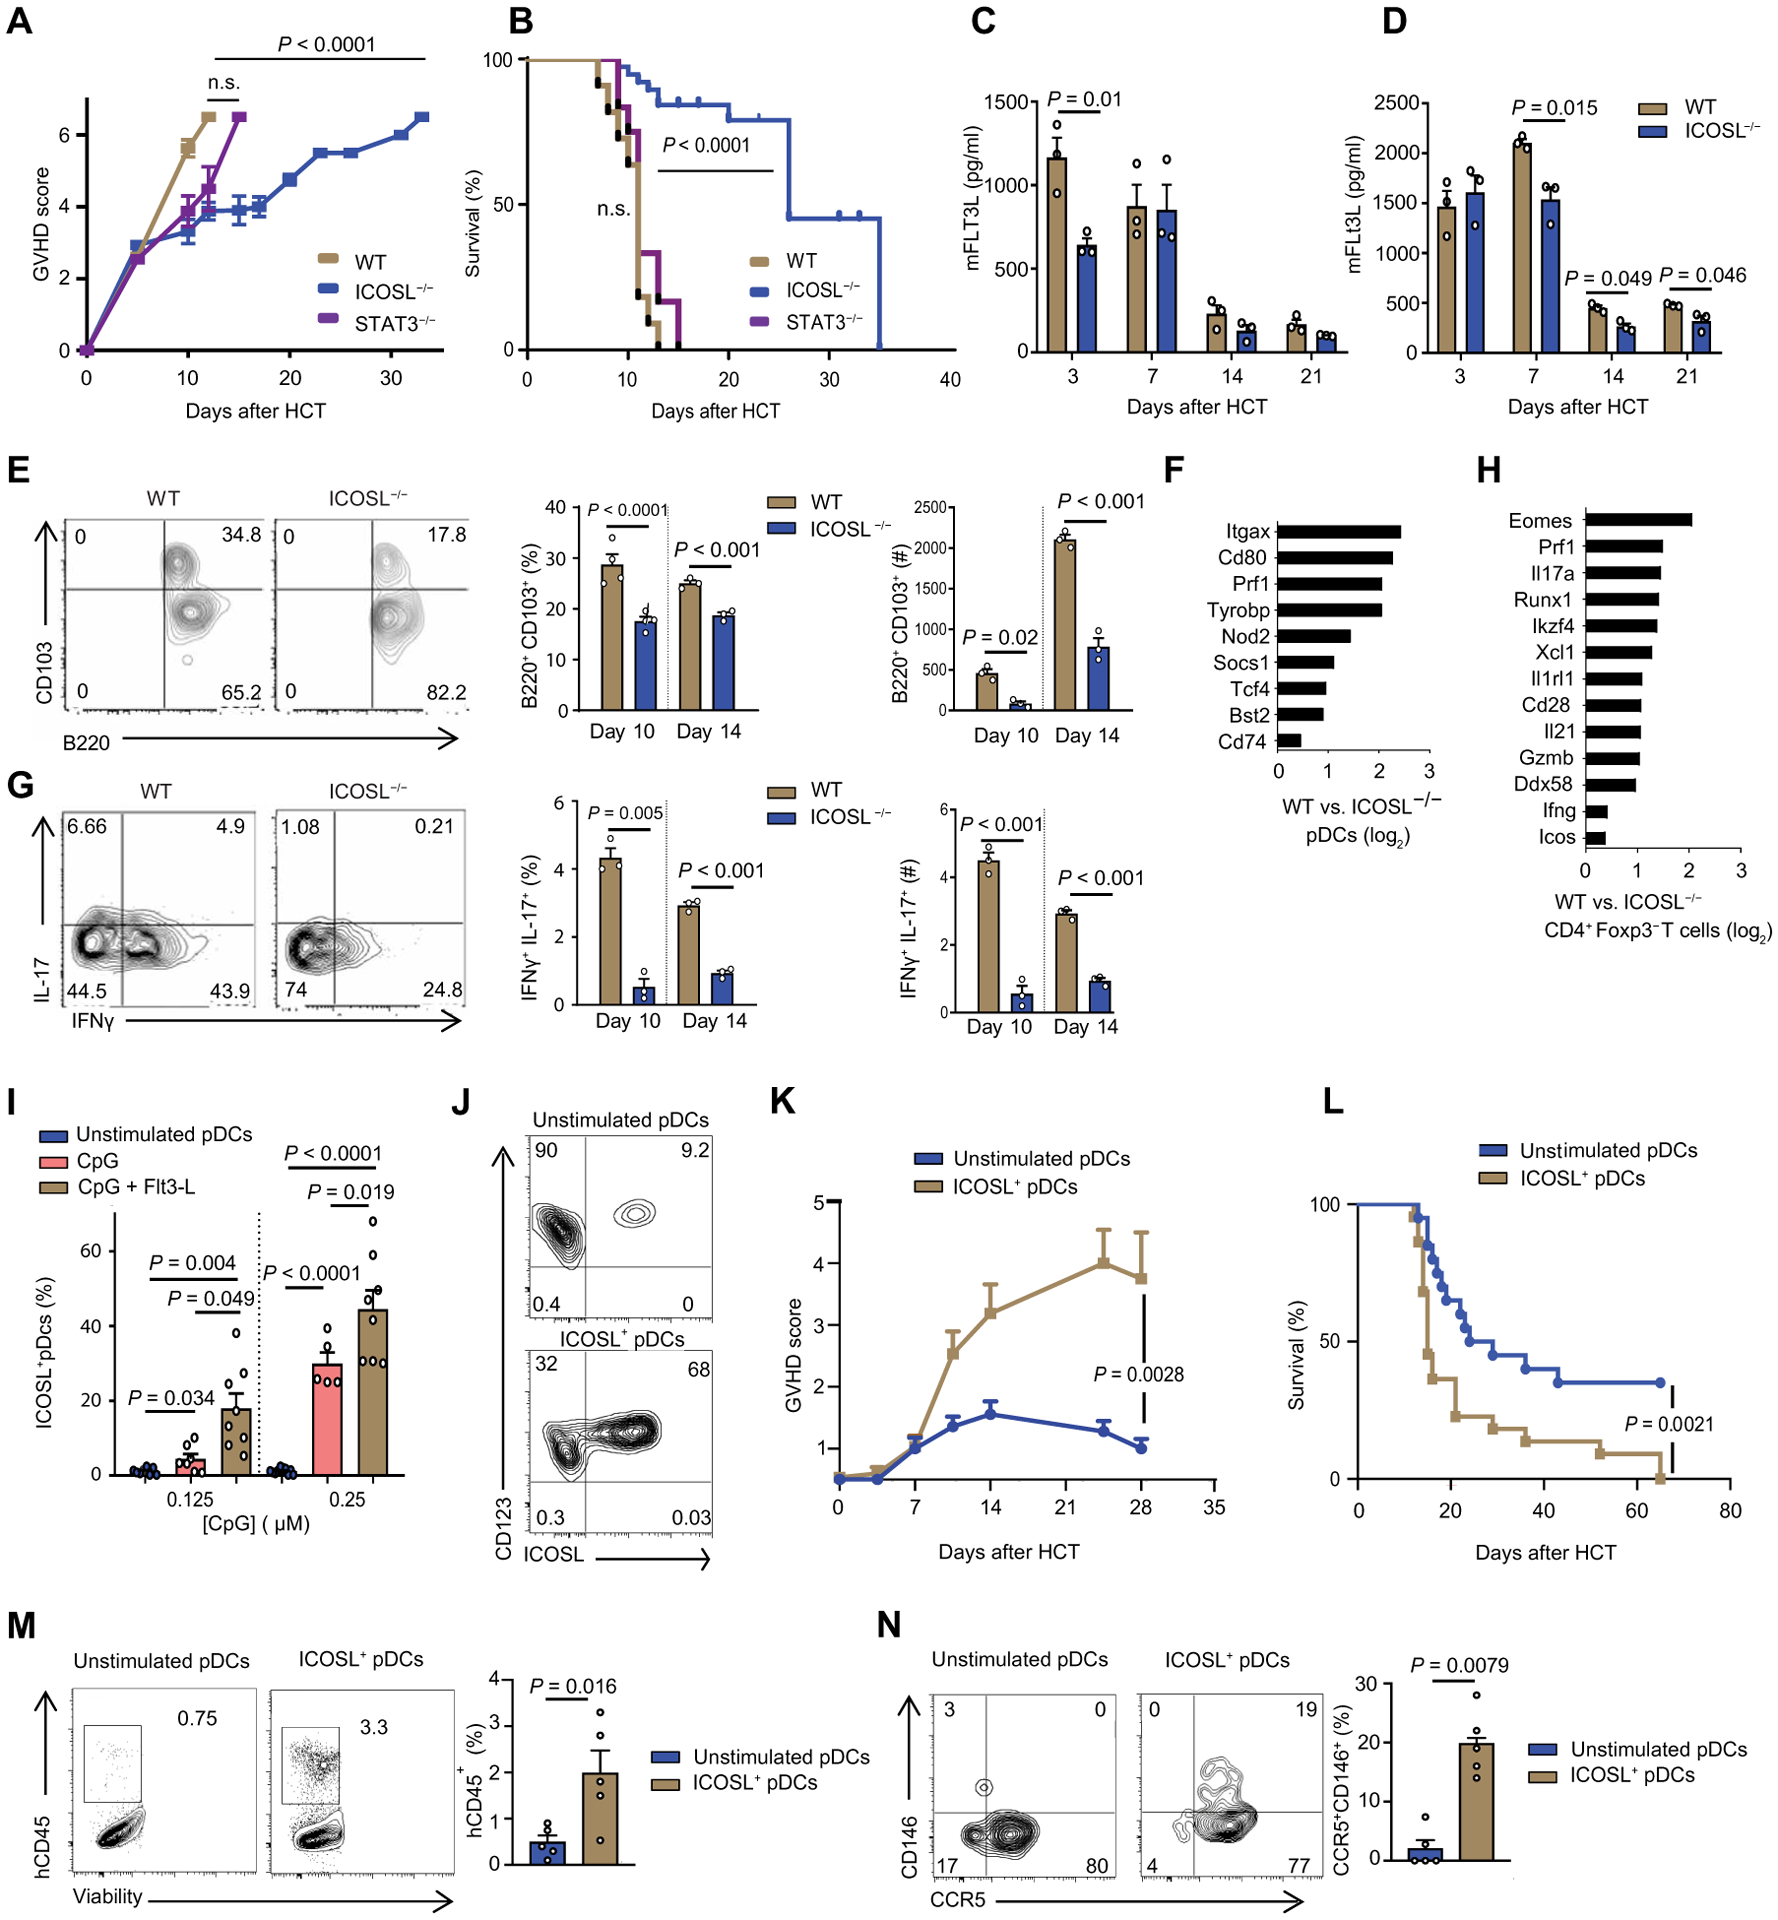
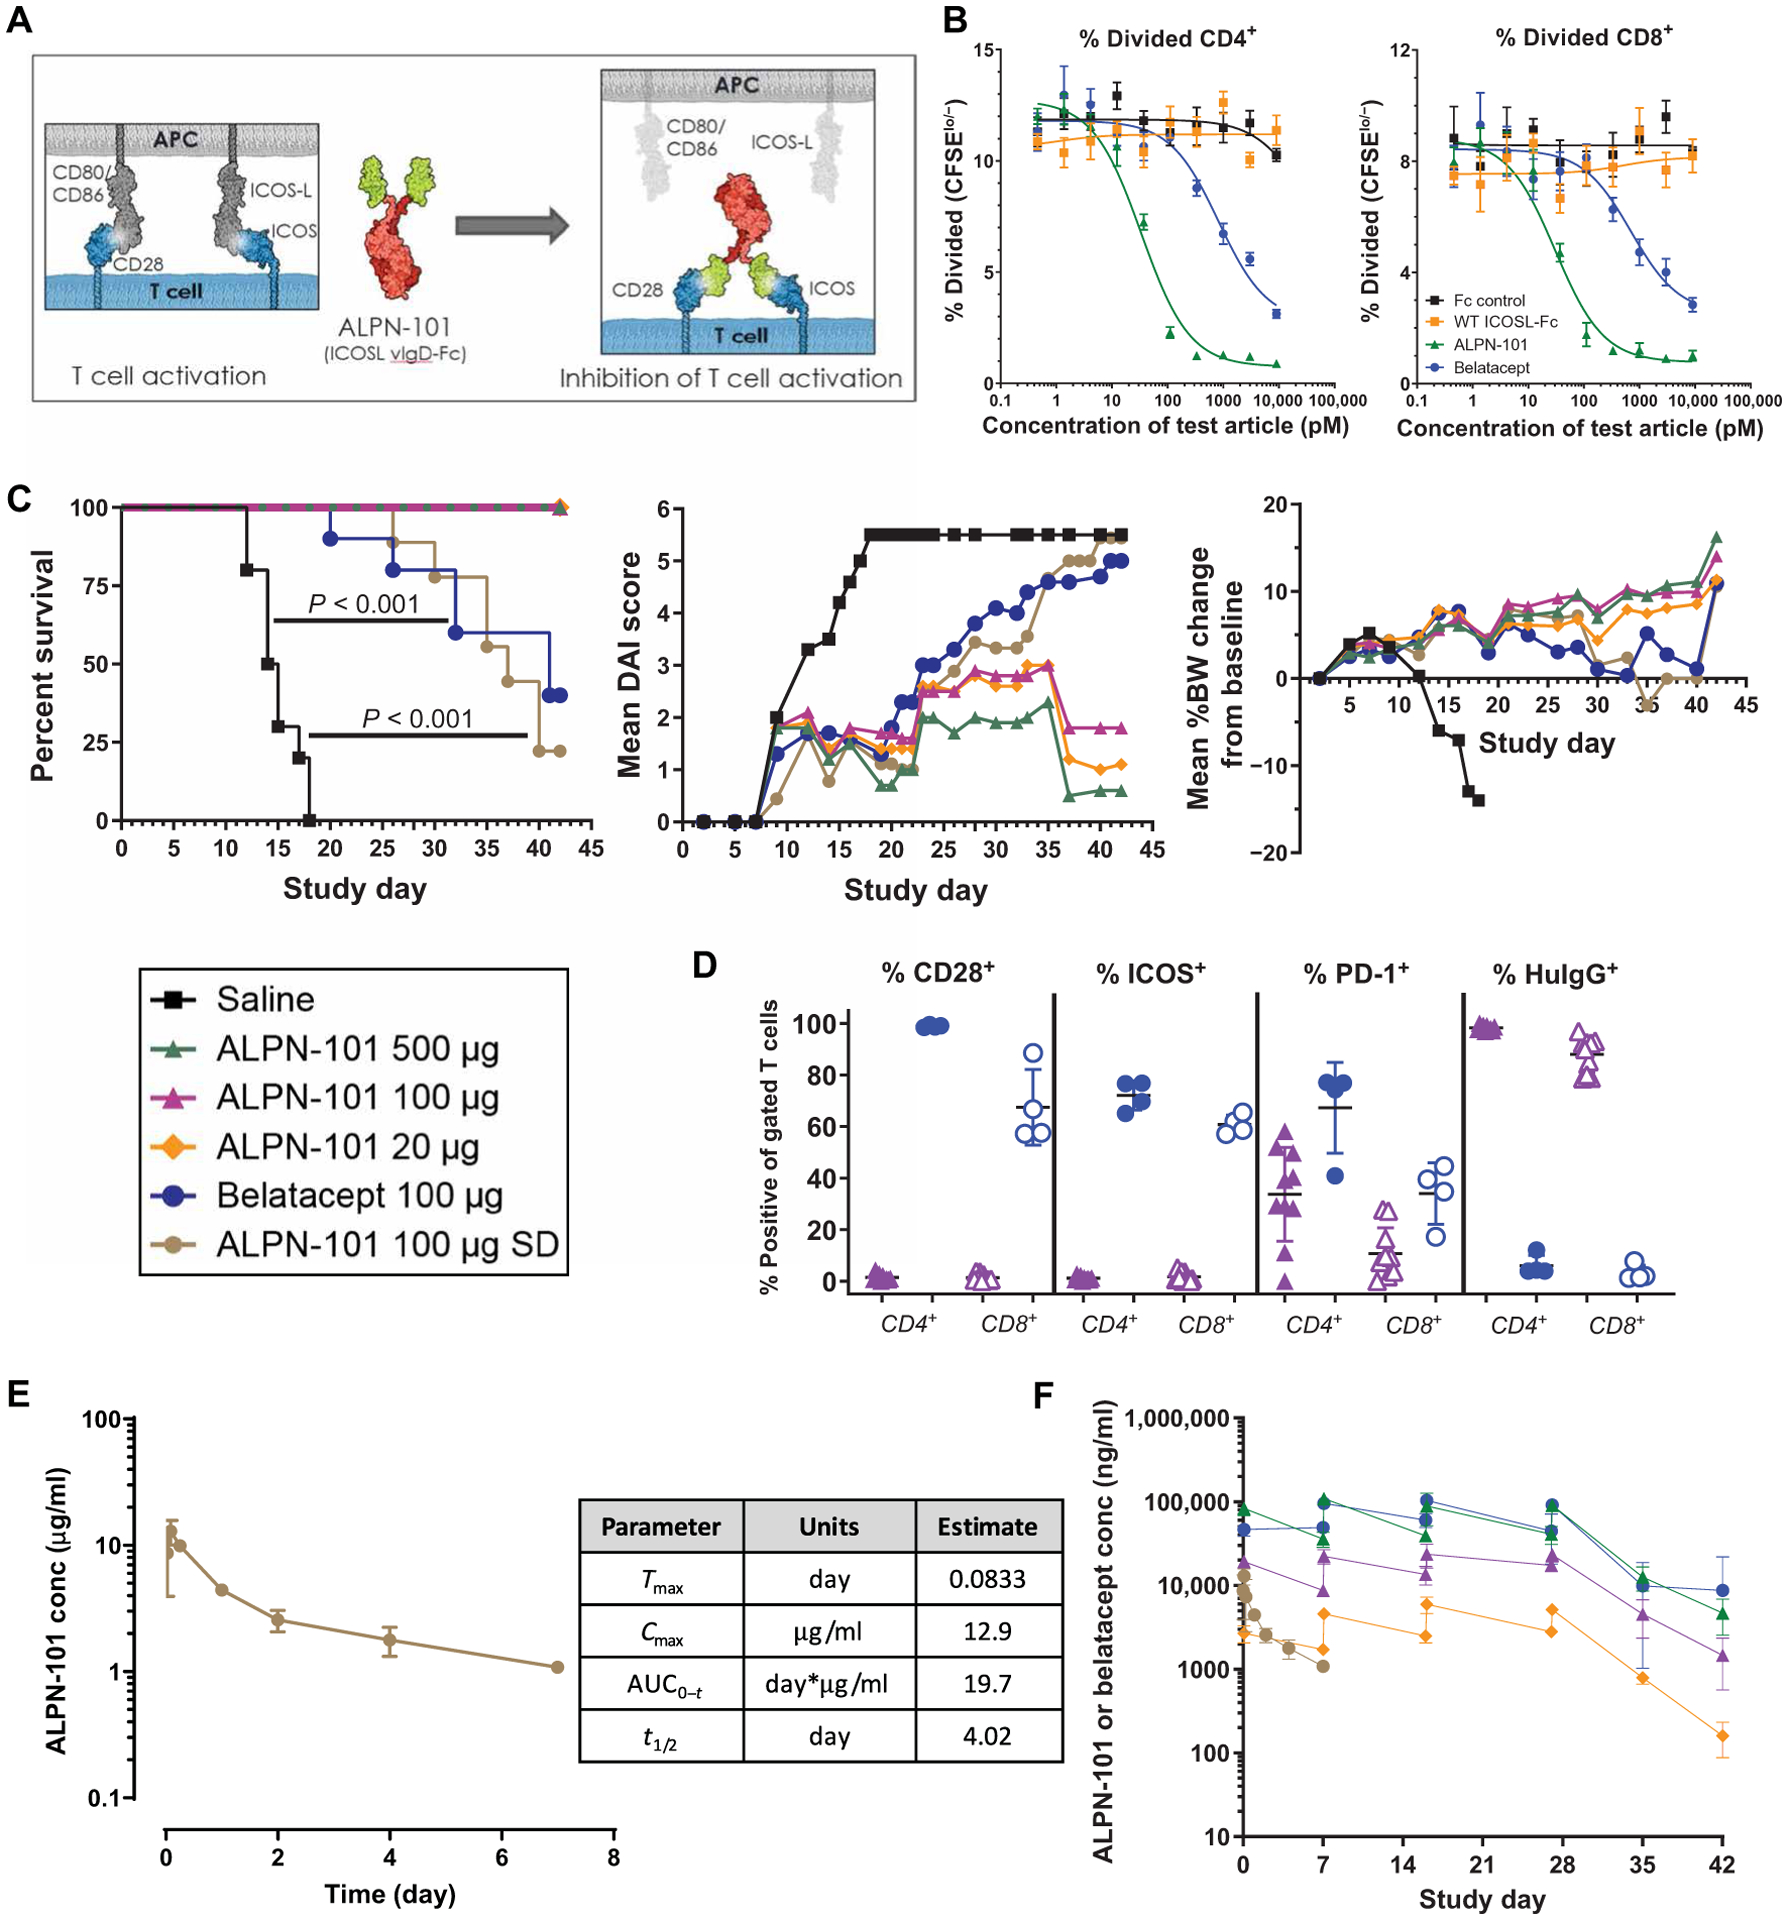
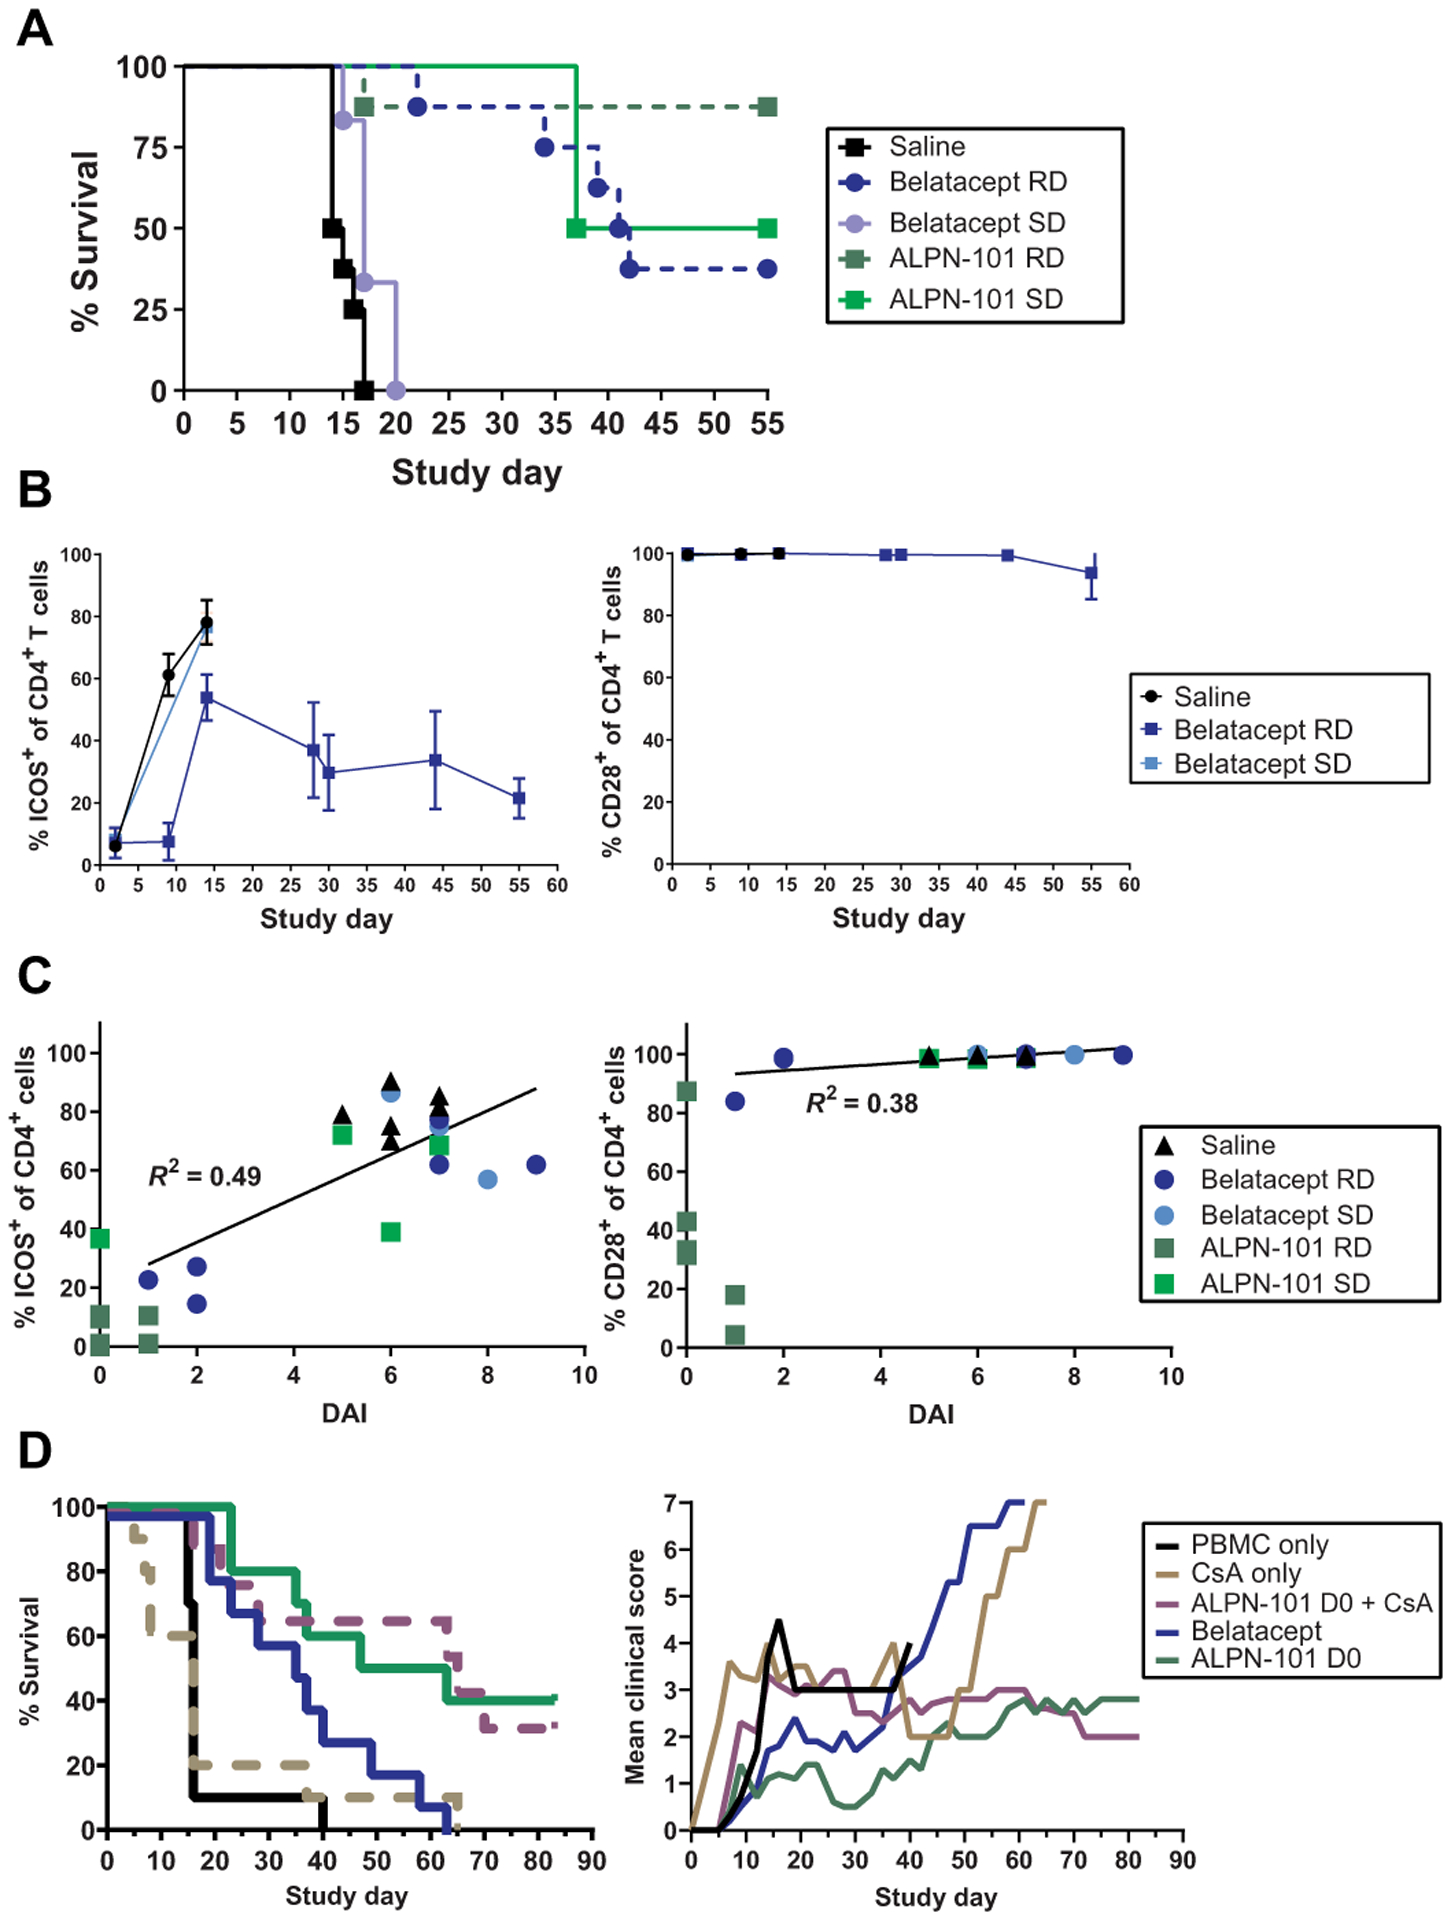
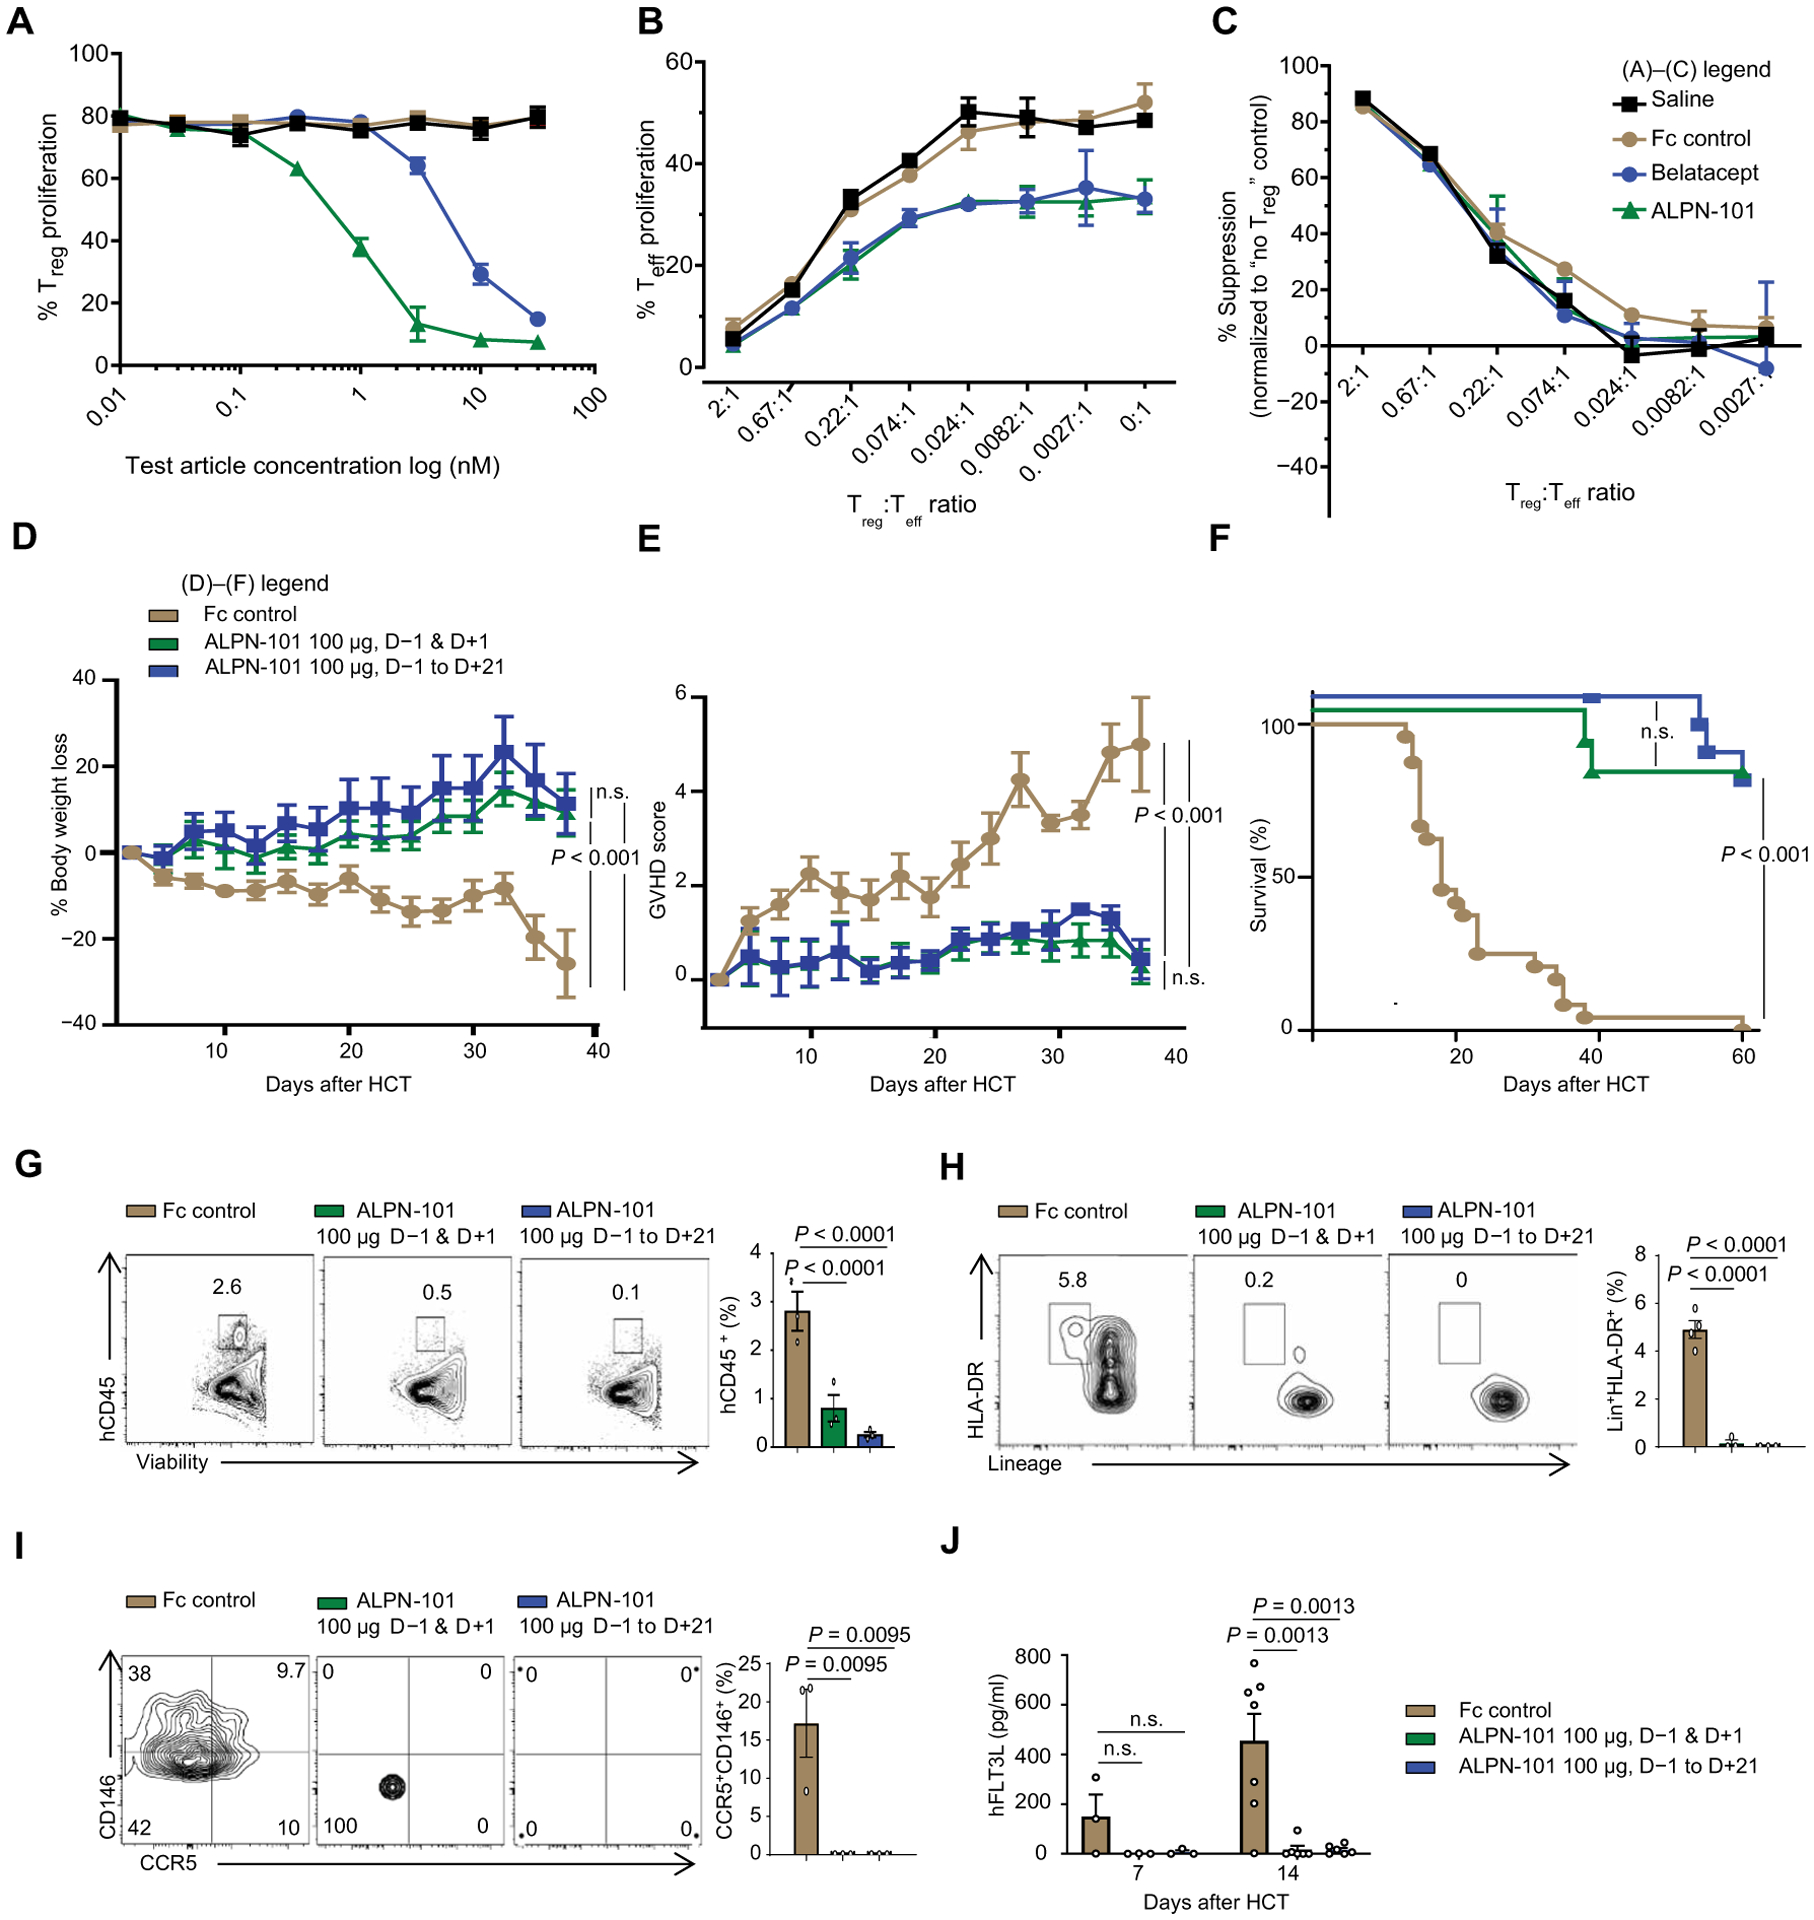
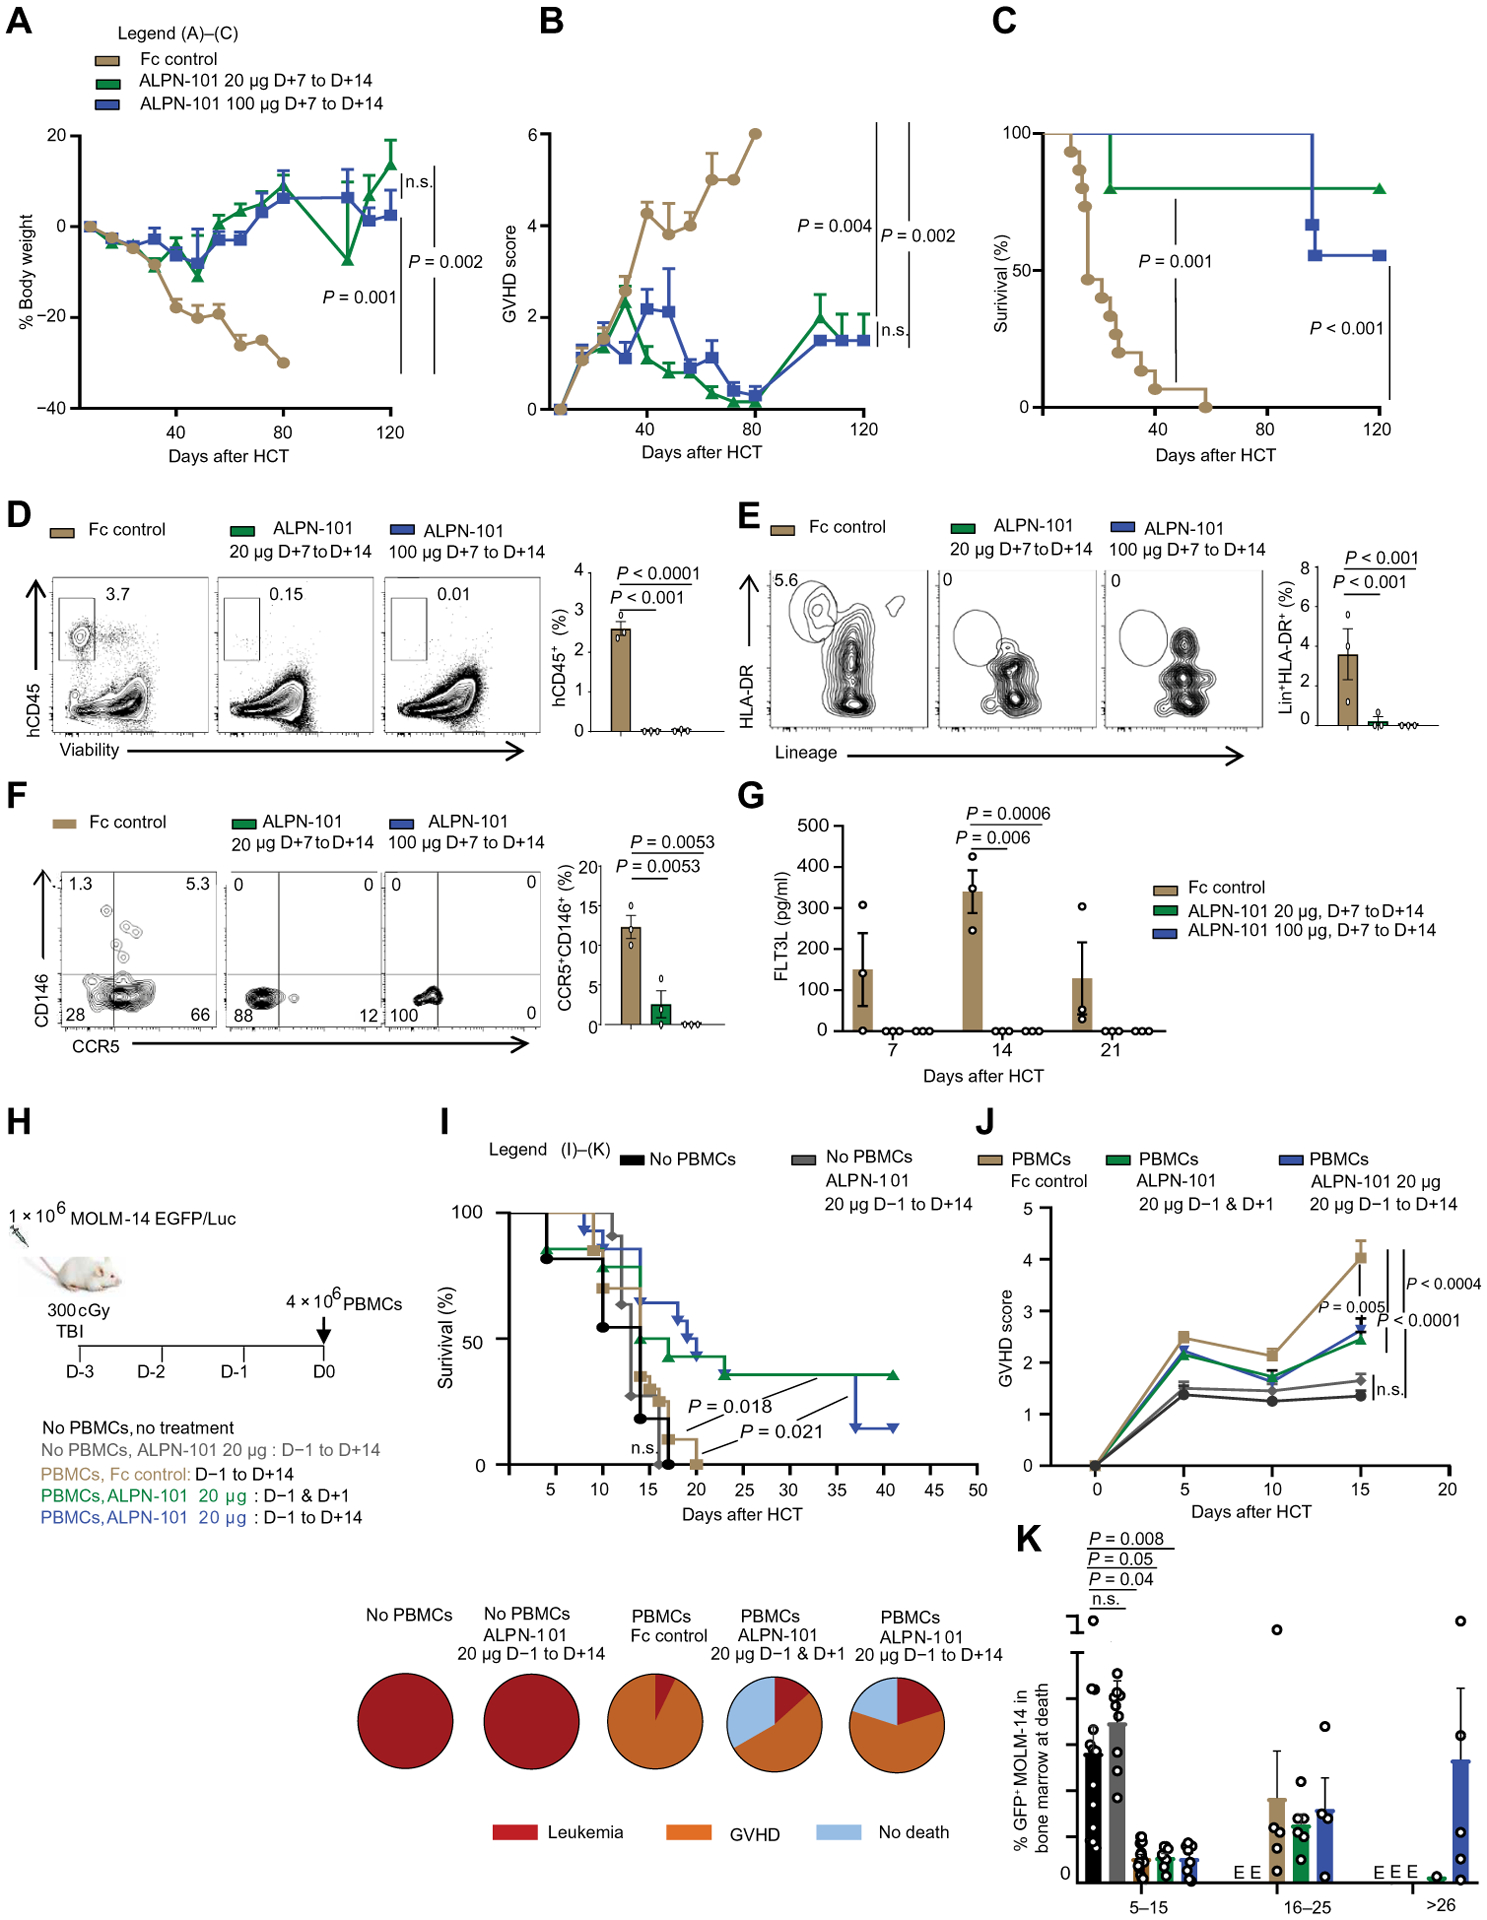
Acute graft-versus-host disease (aGVHD) remains a major complication of allogeneic hematopoietic cell transplantation (HCT). CD146 and CCR5 are proteins that mark activated T helper 17 (Th17) cells. The Th17 cell phenotype is promoted by the interaction of the receptor ICOS on T cells with ICOS ligand (ICOSL) on dendritic cells (DCs). We performed multiparametric flow cytometry in a cohort of 156 HCT recipients and conducted experiments with aGVHD murine models to understand the role of ICOSL+ DCs. We observed an increased frequency of ICOSL+ plasmacytoid DCs, correlating with CD146+CCR5+ T cell frequencies, in the 64 HCT recipients with gastrointestinal aGVHD. In murine models, donor bone marrow cells from ICOSL-deficient mice compared to those from wild-type mice reduced aGVHD-related mortality. Reduced aGVHD resulted from lower intestinal infiltration of pDCs and pathogenic Th17 cells. We transplanted activated human ICOSL+ pDCs along with human peripheral blood mononuclear cells into immunocompromised mice and observed infiltration of intestinal CD146+CCR5+ T cells. We found that prophylactic administration of a dual human ICOS/CD28 antagonist (ALPN-101) prevented aGVHD in this model better than did the clinically approved belatacept (CTLA-4-Fc), which binds CD80 (B7-1) and CD86 (B7-2) and interferes with the CD28 T cell costimulatory pathway. When started at onset of aGVHD signs, ALPN-101 treatment alleviated symptoms of ongoing aGVHD and improved survival while preserving antitumoral cytotoxicity. Our data identified ICOSL+-pDCs as an aGVHD biomarker and suggest that coinhibition of the ICOSL/ICOS and B7/CD28 axes with one biologic drug may represent a therapeutic opportunity to prevent or treat aGVHD.


Conflict of interest statement

Competing interests: S.P. has a patent (US 20130115232A1 and WO 2013066369A3) on “Methods of detection of graft-versus-host disease” licensed to Viracor-IBT laboratories. B.R.B. reports consulting income from Kamon Pharmaceuticals Inc., Five Prime Therapeutics Inc., Regeneron Pharmaceuticals, Magenta Therapeutics, and BlueRock Therapeuetics and research support from Fate Therapeutics, RXi Pharmaceuticals, Alpine Immune Sciences Inc., Abbvie Inc., Leukemia and Lymphoma Society, Childrens’ Cancer Research Fund, and KidsFirst Fund and is a cofounder of Tmunity. S.R.D., K.E.L., L.E., R.W., S.D.L., S.M., J.Y., E.R., M.S., K.H., C.J.G., M.F.W., R.M.S., K.M.S., and S.L.P. are current or former employees and/or shareholders of Alpine Immune Sciences.

Figures

Fig. 1.
Fig. 1.. ICOSL+ pDCs in patients after allogeneic HCT.
(A) Representative plots showing percentage of cells positive for ICOSL and CD123 in samples from patients without GVHD or with GI-GVHD, non-GVHD enteritis, or skin GVHD. (B) ICOSL+CD123+CD11cHLA-DR+Lin pDC frequencies in healthy donors (HDs) and in autologous transplant (Auto) or allogeneic patients. Number of patients (n) and median days after HCT onset of signs/sample collection are shown below the graphs. The data are shown as mean ± SEM, unpaired t test. (C) The correlation between ICOSL+CD123+CD11cHLA-DR+Lin pDCs and CD146+CCR5+CD4+ T cells frequencies in patients with GVHD (n = 95) and non-GVHD enteritis (n = 22) (total n = 117) using Spearman’s correlation. (D) Receiver operating characteristic curves of ICOSL+ pDCs and CD146+CCR5+ T cells in GVHD and GI-GVHD. (E) AUCs calculated from the curves in fig. S5 (B to E). (F) Three-year overall survival (OS) in allogeneic HCT patients with symptoms [GI-GVHD (n = 64), non-GVHD enteritis (n = 22), and skin GVHD (n = 31)] divided by low and high ICOSL+ pDC frequencies. High-risk group is shown in brown (ICOSL+ pDC frequency ≥ 8.23%, n = 59); the low-risk group is shown in blue (n = 58). Statistical significance was calculated for the overall curve by log-rank test. CI, confidence interval.
Fig. 2.
Fig. 2.. aGVHD severity and mortality in ICOSL−/− BM and ICOSL+ pDCs recipients in both a major mismatch murine model and a human PBMC-NSG GVHD model.
(A and B) Clinical GVHD score (A) and survival curve (B): B6 wild-type (WT) (n = 15), B6 ICOSL−/− (n = 15), or B6 CD11cCreSTAT3fl/fl (n = 15). BALB/c mice were irradiated with 900 cGy and then injected intravenously with 1 × 10⁶ of WT B6 T cells and 5 × 10⁶ of BM from WT, ICOSL−/−, or CD11cCreSTAT3fl/fl B6 mice for allogeneic transplant. n.s., not significant. (C) Kinetics of serum concentrations of murine FLT3L in BALB/c recipient mice at the indicated days after allogeneic HCT WT or ICOSL−/− BM into BALB/c (n = 3 each group). (D) Kinetics of serum concentrations of murine FLT3L in the haploidentical model (WT or ICOSL−/− B6 ➔ BALB/c) at the indicated days after allogeneic HCT (n = 3 each group). (E) CD11bCD11c+CD103+B220+ pDCs from the gut of recipient mice injected with WT or ICOSL−/− BM analyzed at days 10 and 14 after HCT (n = 3). Representative flow cytometry and percent positive and absolute number of cells are shown. (F) Transcriptome analysis comparing sorted intestinal pDCs from recipient mice injected with WT or ICOSL−/− BM at day 10 after HCT. Data are shown as ratio of fold change between sorted WT and ICOSL−/− pDCs log2-transformed. (G) Representative plots of Th17 positive for IL-17 or IFNγ or both in the gut of mice that received WT or ICOSL−/− BM, analyzed at day 10 after HCT (n = 3). Representative flow cytometry and percent double positive and absolute number of cells are shown. (H) Transcriptome analysis comparing sorted intestinal CD4+ Foxp3 T cells from WT and ICOSL−/− BM recipient B6 mice at day 10 after HCT. Data are shown as ratio of fold change between sorted WT and ICOSL−/− CD4+ T cells log2-transformed. (I) Percentage of human pDCs positive for ICOSL after stimulation with 0.125 and 0.25 μM CpG or with Flt3-L (200 ng/ml) overnight. pDCs were enriched from human PBMCs. (J) Representative flow cytometry for the experiment in (I), showing percentage of human pDCs positive for ICOSL. Cells were either unstimulated or exposed to both CpG (0.25 μM) and Ftl3-L (200 ng/ml) overnight. (K to N) GVHD score (K), survival (L), intestinal hCD45 infiltration (M), and intestinal CD146+CCR5+ T cells (N) in NSG mice receiving 50,000 of stimulated or unstimulated pDCs with 5 × 10⁶ PMBCs depleted of pDCs (n = 10). In (A), (C) to (E), (G), (I), (K), (M), and (N), data are shown as mean ± SEM. In (C) to (E), (G), and (K) to (N), statistical significance was determined by unpaired t test; in (A) and (I), by ANOVA with Bonferroni’s correction; in (B) and (L), by Mantel-Cox log-rank test.
Fig. 3.
Fig. 3.. ALPN-101 suppresses activated T cell expansion in the human PBMC-NSG GVHD model.
(A) Diagram of the structure of ALPN-101 and its mechanism of action. ALPN-101 was generated on the vIgD yeast display platform (21) and comprises two ICOSL “vIgD” domains (green) fused to a dimeric Fc tail (red) engineered to lack appreciable FcγR (CD16a, CD32, or CD64) or complement (C1q) binding while retaining FcRn binding. (B) Proliferation of CD4+ and CD8+ T cells was determined by quantifying the percentage of carboxyfluorescein diacetate succinimidyl ester (CFSE)–labeled cells remaining over time. As cells divide, CFSE signal decreases, and the percent CFSElo/− cells is used to assess the fraction of divided cells. Data are representative of at least six experiments with different donor pairs. (C) Survival, disease activity index (DAI) scores, and body weight (BW) of NSG mice x-ray irradiated (100 cGy) and administered 10 mg of human γ globulin subcutaneously on day −1 and then transplanted intravenously with 10 × 106 human PBMCs on day 0 and treated intraperitoneally with saline 3× per week (TIW) for 4 weeks (TIW × 4; days 0 to 28); 20, 100, or 500 μg of ALPN-101 TIW × 4; 100 μg of belatacept TIW × 4; or 100 μg of ALPN-101 single dose (SD) on day 0. On day 42, human CD45+ cells in blood were characterized by flow cytometry. For DAI analysis, the last observations or scores were carried forward for mice that were euthanized before the end of the study. For BW analysis, mice were weighed daily. See table S5 for statistical differences among groups. (D) Analysis of terminal blood collected from euthanized mice by flow cytometry for the 100 μg TIW × 4 ALPN-101 and belatacept treatment groups from the study described in (C). The % CD28+, ICOS+, PD-1+, or anti-human IgG-binding cells of gated CD4+ (filled) and CD8+ (open) from mice administered ALPN-101 (purple) or belatacept (blue). ALPN-101 blocks detection of CD28 and ICOS, and the anti-human IgG reagent binds to the Fc of cell-bound ALPN-101. Very few myeloid or B cells remained, so binding of belatacept to CD80/CD86 on APC was not detected. (E) Concentration (conc) of ALPN-101 in the serum of mice receiving a single dose of 100 μg of ALPN-101 in the GVHD model described in (C). Serum samples from three mice per group per time point after a single intraperitoneal injection of ALPN-101 were evaluated for drug concentrations by plate-based ELISA. (F) Concentrations of ALPN-101 and belatacept in the serum of mice receiving the indicated repeated doses (RD, TIW × 4) of the test articles in the GVHD model described in (C). Concentrations of ALPN-101 or belatacept were measured by ELISA in serum samples collected 2 hours post-dose on D0 (first dose), pre-dose, and 2 hours post-dose on D7, D16, and D27 (4th, 8th, and 12th doses) and D35 and D42 (8 and 15 days after the last dose). In (B), data are shown as mean ± SEM. In (C) (left), statistical significance was determined by Mantel-Cox log-rank test; in (C) (middle), by two-way repeated measures ANOVA for treatment effect; in (C) (right), by one-way ANOVA with Bonferroni correction. In (D), statistical significance was determined by unpaired t test.
Fig. 4.
Fig. 4.. ICOS expression on activated T cells in the human PBMCs-NSG GVHD model correlates with disease severity, and the suppressive effects of ALPN-101 are not altered by CsA.
(A) Survival of mice receiving repeated doses (RD) or a single dose (SD) of the indicated test articles. NSG mice x-ray irradiated (100 cGy) and administered 10 mg of human γ globulin subcutaneously on day −1 and then transplanted intravenously with 10 × 106 human PBMCs on day 0 were treated intraperitoneally with saline; 100 μg of ALPN-101 TIW × 4 (days 0 to 28) or once on day 0; or 100 μg of belatacept TIW × 4 (days 0 to 28) or once on day 0. (B) Blood from each mouse treated with saline or a single dose (SD) or repeat doses (RDs) of belatacept or ALPN-101 [as described in (A)] was evaluated by flow cytometry for percent cells positive for ICOS or CD28 in the population of human CD4+ cells. Because ALPN-101 blocks the binding of anti-ICOS and anti-CD28 antibodies used for flow cytometry, data from the ALPN-101 groups are omitted. (C) Percent ICOS+ or CD28+ human CD4+ cells are plotted versus the terminal DAI score for each mouse as described in (A). Linear regression curves were calculated and correlation coefficients (R2) are indicated for each dataset. Because ALPN-101 blocks the binding of the antibodies used for flow cytometry, data from the ALPN-101 groups are shown on the graphs but were omitted from the correlation analyses. See table S7 for additional correlation analyses. (D) Effect of CsA on ALPN-101 therapy. Percent survival and clinical scores for NSG mice x-ray irradiated (100 cGy) and administered 10 mg of human γ globulin SC on day −1, then transplanted intravenously with 10 × 106 human PBMCs on day 0 (D0) and treated intraperitoneally with saline daily from day −1 to 13, then TIW through day 28; CsA 20 mg/kg daily from day −1 to 13, then TIW through day 28; 500 μg of ALPN-101 once on day 0; combination of 500 μg of ALPN-101 once on day 0 plus CsA 20 mg/kg daily from day −1 to 13, then TIW through day 28; or 75 μg of belatacept TIW × 4. In (A) (left), statistical significance in survival proportions between groups was determined by Mantel-Cox log-rank test. In (B), data are shown as mean ± SEM. In (D) (left), statistical significance in survival proportions between groups was determined by Mantel-Cox and Gehan-Breslow-Wilcoxon log-rank tests. In (D) (right), statistical significance was determined by two-way repeated measures ANOVA for treatment effect.
Fig. 5.
Fig. 5.. Impact of ALPN-101 on Teff and Treg proliferation and on huDCs and huCD4+CD146+CCR5+ T cell populations in target organs.
(A to C) Effect of ALPN-101 on T cell proliferation. Human Teffs and Tregs were stained with antibodies recognizing FoxP3, CD4, PD-1, CD25, CD28, CD127, ICOS, PD-L1, and Helios to confirm their surface phenotype before culture. In (A), enriched Tregs were labeled with CellTrace Violet (CTV) and cultured with soluble anti-CD3 antibody, recombinant IL-2 (rIL-2), and K562 APCs (transfected with CD80 and treated with mitomycin C) in medium with saline (black) or with various concentrations of the test molecules: Fc control (brown), belatacept (blue), or ALPN-101 (green). (A) After 3 days, Treg proliferation was assessed by CTV dilution by flow cytometry. Statistical differences between Fc control and the other test molecules were determined by an unpaired t test. The ALPN-101 treatment effect is significantly different from the Fc control group (P = 0.0037 at 1 nM, P = 0.0034 at 3 nM, and P = 0.0003 at 30 nM by unpaired t test) and also significantly different from the belatacept group (P = 0.004 at 1 nM and P = 0.007 at 3 nM). (B) Tregs labeled with CTV were mixed at the indicated ratios with Teff labeled with CFSE and cultured with mitomycin C–treated, CD80low K562 APCs, and soluble anti-CD3 antibody in medium containing added saline or 30 nM of each test molecule. After 4 days, Teff proliferation was assessed by CFSE dilution by flow cytometry. The ALPN-101 treatment effect is significantly different from the Fc control group at all Treg:Teff ratios except 2:1 (P = 0.0001 at 0.67:1; P = 0.0345 at 0.22:1; P = 0.0158 at 0.074:1; P = 0.0313 at 0.024:1; P = 0.0196 at 0.0082:1, P = 0.0187 at 0.0027:1, and P = 0.0342 at 0:1, by unpaired t test). (C) Specific Treg suppression activity for each culture condition was determined (see Materials and Methods). Concentrations are the same as in (B). Data are presented normalized to Teff activity in the absence of Tregs. (D to F) Effect of ALPN-101 on health [BW (D) and GVHD severity score (E)] and survival (F) of the human PBMC-NSG GVHD model. NSG mice were irradiated at 300 cGy at day −1 and then transplanted with 3.5 × 10⁶ human PBMCs at day +1. Mice were treated every other day with Fc control (brown) or 100 μg of ALPN-101 from days −1 to +21 (12 doses total; blue) or 100 μg of ALPN-101 on days −1 and +1 (2 doses total; green). n = 10 mice in all groups. (G to I) Human hematopoietic cell engraftment (G), LinHLA-DR+ total DCs (H), and CD4+CD146+CCR5+ T cells (I) in the GI tract of NSG recipient mice. Five mice from (D) to (F) were analyzed at day 14 after HCT comparing Fc control and ALPN-101–treated groups. (J) Concentration of human FLT3L in plasma from NSG mice from (D) to (F) at days 7 and 14 after HCT (n = 3 mice per time point). Data are shown as mean ± SEM, except for survival curves and representative flow cytometry. In (A) to (C), statistical significance was determined by unpaired t test, and in (D), (E), and (G) to (J), it was determined by ANOVA with Bonferroni’s correction. Log-rank test (Mantel-Cox) was used for survival analysis in (F).
Fig. 6.
Fig. 6.. Treatment with ALPN-101 at onset of xenogeneic aGVHD and huPBMC-NSG model with human leukemia cells.
(A to C) Effect of ALPN-101 on health [BW (A) and GVHD severity score (B)] and survival (C) of the human PBMC-NSG GVHD model. NSG mice were irradiated at 350 cGy at day −1 and then transplanted with 5 × 10⁶ human PBMCs at day +1. Mice were treated with either Fc control every other day from days +7 to +14 (n = 9), or 20 μg of ALPN-101 every other day from days +7 to +14 (n = 9), or 100 μg of ALPN-101 (n = 15) every other day from days +7 to +14. (D to F) Human hematopoietic cell engraftment (D), LinHLA-DR+ DC frequencies (E), and CD4+CD146+CCR5+ T cell frequencies (F) in the GI tract of NSG recipient mice. Three NSG mice from each group in (A) to (C) were analyzed at day 14 after HCT, comparing the Fc control and ALPN-101–treated groups. (G) Concentration of human FLT3L in plasma from three NSG mice from (A) to (C) at the indicated times after HCT. (H) Study design for evaluation of ALPN-101 GVHD prophylaxis in mice with leukemia. NSG mice were irradiated at 300 cGy and injected with 1 × 10⁶ human leukemic cells of the line MOLM-14-EGFP on day −3 and then transplanted with 4 × 10⁶ human PBMCs on day 0 (day of PBMC transplant). Two groups of mice did not receive PBMCs, while one did not receive any treatment, the other group was treated with ALPN-101 from days −1 to +14 (n = 15); the other mice all received PBMCs and were treated with either ALPN-101 only from days −1 to +14 (n = 20), Fc control every other day from days −1 to +14 (n = 20), 20 μg of ALPN-101 on day −1 and +1 (n = 20), or 20 μg of ALPN-101 every other day from days −1 to +14 (n = 20). (I) Survival of leukemia-recipient mice. Pie charts represent the percentage of surviving mice or cause of death for each group. (J) Clinical GVHD score in the three groups of leukemia-recipient mice receiving PBMCs. (K) Percentage of GFP+MOLM-14 leukemic cells in the BM of mice at death. In (A), (B), (D) to (G), and (I) to (K), data are shown as mean ± or + SEM. In (A), (B), (D) to (G), and (I) to (K), statistical significance was determined by ANOVA with Bonferroni’s correction. Kaplan-Meier method using the log-rank test for comparison was used for survival analysis in (C).

References

    1. Zeiser R, Blazar BR, Acute graft-versus-host disease—Biologic process, prevention, and therapy. N. Engl. J. Med 377, 2167–2179 (2017). - PMC - PubMed
    1. Martin PJ, McDonald GB, Sanders JE, Anasetti C, Appelbaum FR, Deeg HJ, Nash RA, Petersdorf EW, Hansen JA, Storb R, Increasingly frequent diagnosis of acute gastrointestinal graft-versus-host disease after allogeneic hematopoietic cell transplantation. Biol. Blood Marrow Transplant 10, 320–327 (2004). - PubMed
    1. Vander Lugt MT, Braun TM, Hanash S, Ritz J, Ho VT, Antin JH, Zhang Q, Wong CH, Wang H, Chin A, Gomez A, Harris AC, Levine JE, Choi SW, Couriel D, Reddy P, Ferrara JL, Paczesny S, ST2 as a marker for risk of therapy-resistant graft-versus-host disease and death. N. Engl. J. Med 369, 529–539 (2013). - PMC - PubMed
    1. McDonald GB, Tabellini L, Storer BE, Lawler RL, Martin PJ, Hansen JA, Plasma biomarkers of acute GVHD and nonrelapse mortality: Predictive value of measurements before GVHD onset and treatment. Blood 126, 113–120 (2015). - PMC - PubMed
    1. Hartwell MJ, Ozbek U, Holler E, Renteria AS, Major-Monfried H, Reddy P, Aziz M, Hogan WJ, Ayuk F, Efebera YA, Hexner EO, Bunworasate U, Qayed M, Ordemann R, Wolfl M, Mielke S, Pawarode A, Chen YB, Devine S, Harris AC, Jagasia M, Kitko CL, Litzow MR, Kroger N, Locatelli F, Morales G, Nakamura R, Reshef R, Rosler W, Weber D, Wudhikarn K, Yanik GA, Levine JE, Ferrara JL, An early-biomarker algorithm predicts lethal graft-versus-host disease and survival. JCI Insight 2, e89798 (2017). - PMC - PubMed

Publication types