. 2020 Oct 7;11(1):5057.
doi: 10.1038/s41467-020-18677-1.

A deep learning approach to programmable RNA switches

Affiliations

A deep learning approach to programmable RNA switches

Nicolaas M Angenent-Mari et al. Nat Commun. .

Abstract

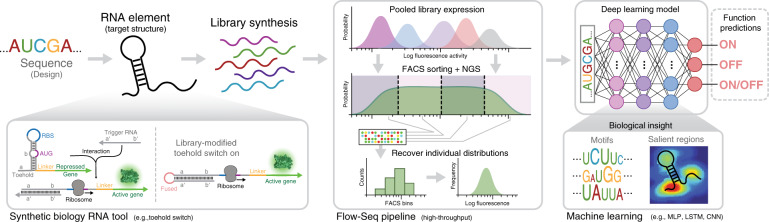
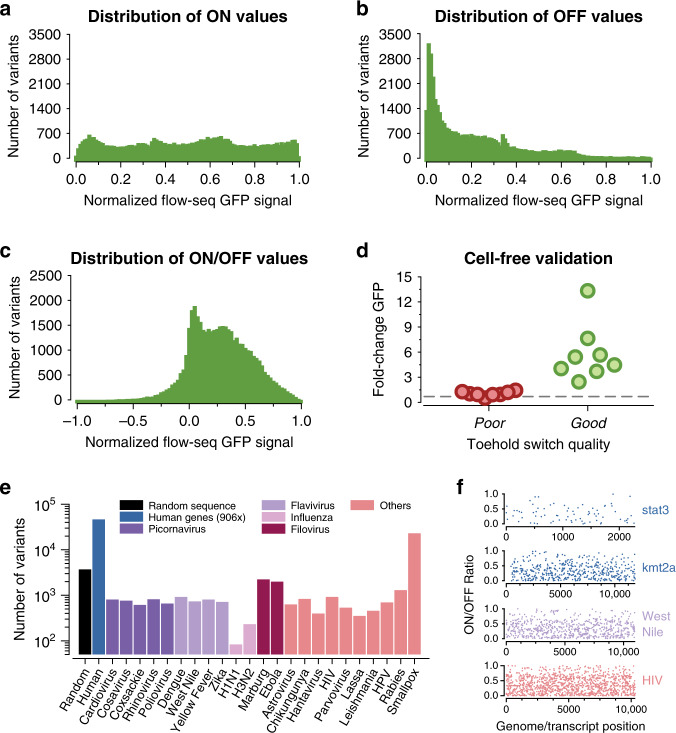
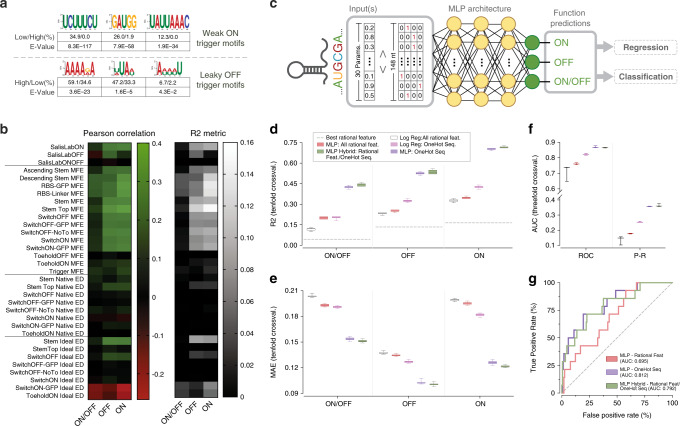
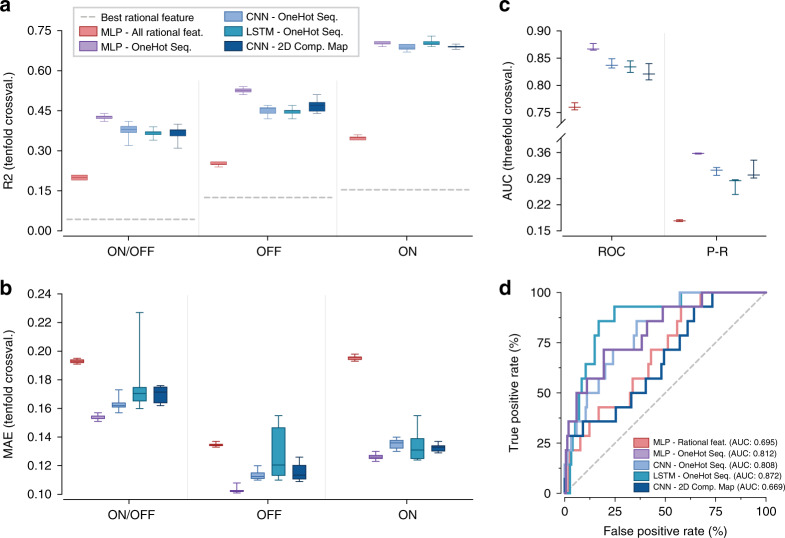
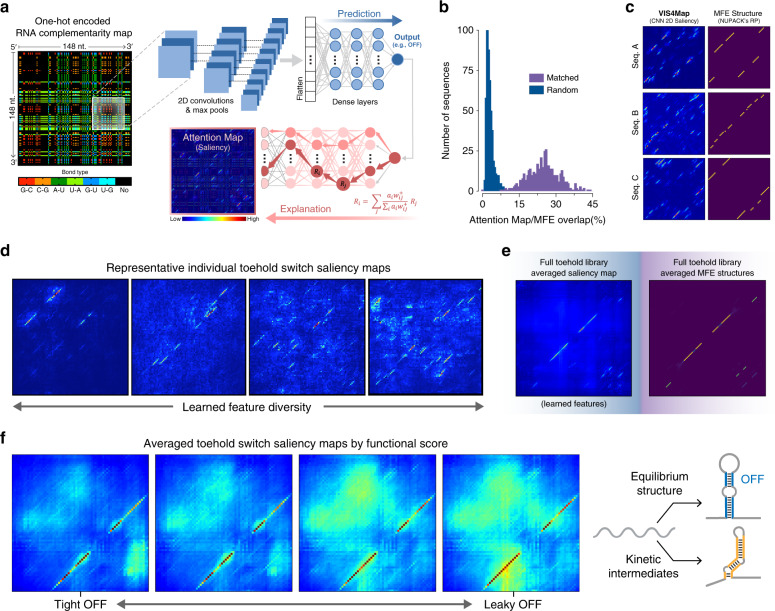
Engineered RNA elements are programmable tools capable of detecting small molecules, proteins, and nucleic acids. Predicting the behavior of these synthetic biology components remains a challenge, a situation that could be addressed through enhanced pattern recognition from deep learning. Here, we investigate Deep Neural Networks (DNN) to predict toehold switch function as a canonical riboswitch model in synthetic biology. To facilitate DNN training, we synthesize and characterize in vivo a dataset of 91,534 toehold switches spanning 23 viral genomes and 906 human transcription factors. DNNs trained on nucleotide sequences outperform (R2 = 0.43-0.70) previous state-of-the-art thermodynamic and kinetic models (R2 = 0.04-0.15) and allow for human-understandable attention-visualizations (VIS4Map) to identify success and failure modes. This work shows that deep learning approaches can be used for functionality predictions and insight generation in RNA synthetic biology.


Conflict of interest statement

The authors declare no competing interests.

Figures

Fig. 1
Fig. 1. Deep learning for ribonucleic acid (RNA) synthetic biology pipeline.
RNA tool selection is followed by library synthesis and characterization with analysis using deep neural networks (DNN) to provide functionality predictions and biological insights. We used a high-throughput toehold-switch library as a canonical model for the general investigation of RNA synthetic biology tools. The original toehold-switch architecture from Green et al. was used, containing a 12-nucleotide toehold (a/a′) and an 18-nucleotide stem (b/b′) fully unwound by the trigger (left-bottom). We selected to fuse the RNA trigger to the 5′ end of the switch by an unstructured linker to facilitate library synthesis. A flow-sequence (seq) pipeline was used to characterize the fluorescence signal of individual toehold switches in a pooled sequential assay, including pooled induction, fluorescence-activated cell sorter (FACS) sorting, next-generation sequencing (NGS), and count frequency analysis. Finally, various DNN architectures were used to predict data outputs, while features contributing to DNN predictions were intuitively visualized to elucidate biological insights. Center panel adapted from Peterman et al..
Fig. 2
Fig. 2. Flow-seq toehold-switch library characterization and trigger ontology.
The distribution of recovered toeholds for (a) ON-state signals, (b) OFF-state signals, and (c) calculated ON/OFF ratios are shown. d Validation results for toehold switches expressed in a PURExpress cell-free system with un-fused-trigger RNA, including eight low-performing (poor, ON/OFF < 0.05) and eight high-performing (good, ON/OFF > 0.97) samples. Obtained in vivo flow-seq data show competency in classifying switch performance for this in vitro cell-free biological context (P < 0.0001 between high and low switches, two-tailed t test) with n = 3 biologically independent samples each for both ON and OFF measurements. e Tested switch/trigger variants from each origin category, including randomly generated sequences, 906 human transcription factor transcripts, and 23 pathogenic viral genomes. f Experimental ON/OFF ratios for all triggers tiled across the transcripts of two clinically relevant human transcription factors (stat3 and kmt2a) upregulated in cancerous phenotypes,, as well as all triggers tiled across the genomes of two pathogenic viruses: West Nile Virus (WNV) and human immunodeficiency virus (HIV). GFP    green fluorescent protein, Seq sequence, HPV   human papillomavirus. All ON, OFF, and ON/OFF values shown were selected from quality control process #3, QC3 in Supplementary Fig. S13 and Supplementary Table 1. All source data are provided as a Source Data file.
Fig. 3
Fig. 3. Analysis of toehold-switch performance using multilayer perceptron (MLP) models.
a Sequence logos for k-mer motifs discovered to be disproportionately represented in weakly induced switches (low ON) and leaky switches (high OFF), functional proportions, and E-values. b The Pearson correlation (left, |max| = 0.4) and R2 metric (right, |max| = 0.16) for 30 state-of-the-art thermodynamic features and obtained RBS Calculator v2.1 outputs. c Base architecture of investigated MLP models, featuring three fully connected layers. For training in regression mode, three different outputs were predicted (ON, OFF, ON/OFF), whereas for classification training, only a single binary output based on ON/OFF (threshold at 0.7) was predicted. d Box-and-whisker plots for R2 between experimental and regression-based predictions for best-performing rational features, logistic regression models and MLPs using tenfold cross-validation (test sets randomly selected from quality control process #2, QC2 in Supplementary Fig. S13 and Supplementary Table 1). e Box-and-whisker- plots for mean absolute error (MAE) between experimental and predicted values for these same models. f Box- and-whisker plots for the area under the curve (AUC) of the receiver–operator curve (ROC) and the precision-recall curve (P–R) in classification-mode predictions compared to experimental values using threefold cross-validation (test sets randomly selected from quality control process #2, QC2 in Supplementary Fig. S13 and Supplementary Table 1). In both regression and classification, the one-hot encoded sequence MLP delivered top-in-class performance without using pre-computed thermodynamic or kinetic metrics. g ROC curves of pre-trained MLP classification models validated with an unseen 168-sequence external dataset from Green et al.. For all box-and-whisker plots, the horizontal line indicates the median, box edges are at the 25th and 75th percentiles, and whiskers indicate the smaller of either 1.5 × IQR or max/min. All source data are provided as a Source Data file.
Fig. 4
Fig. 4. Evaluation of neural network architectures with increased capacity.
Performance metrics for convolutional neural networks (CNN) and long short-term memory (LSTM) networks trained on one-hot encoded toehold sequences, as well as a CNN trained on a two-dimensional, one-hot encoded sequence complementarity map. All models are compared to the previously reported MLPs trained on the 30 pre-calculated thermodynamic features and one-hot toehold sequences. For regression-based predictions, a shows box-and-whisker plots for R2 metric, while b shows box-and-whisker plots for mean absolute error (MAE) for all models. In the case of classification-based predictions, c shows box-and-whisker plots of the area under the curve (AUC) of the receiver–operator curve (ROC) and the precision-recall curve (P–R) for all tested models. In both regression and classification, the one-hot encoded sequence MLP delivered a top-in-class performance as compared to higher-capacity deep-learning models. d ROC curves of pre-trained higher-capacity classification models validated with an unseen 168-sequence external dataset from Green et al.. For all box-and-whisker plots, the horizontal line indicates the median, box edges are at the 25th and 75th percentiles, and whiskers indicate the smaller of either 1.5 × IQR or max/min. All source data are provided as a Source Data file.
Fig. 5
Fig. 5. VIS4Map: visualizing learned secondary structures with complementarity matrices.
a A simplified schematic of the convolutional neural networks (CNN)-based architecture used to generate toehold functional predictions with network attention visualizations. The system receives a one-hot encoded, two-dimensional (2D) sequence complementarity map as input, followed by three 2D convolutional/max-pooling layers, a flattening step, and finally a set of dense layers. After output generation (e.g., OFF), a gradient-weighted activation mapping is performed to visualize activation maximization regions responsible for delivered predictions (VIS4Map). b Histograms of the percentage overlap between VIS4Maps generated from a CNN pre-trained to predict minimum free energy (MFE) using 120-nt RNA sequences and MFE maps generated by NUPACK. When analyzed using 500 random test-set sequences, the distributions of correctly matched and randomly assigned maps are distinct with increased percentage overlap from matched samples as compared to unmatched. c Examples of saliency VIS4Maps compared with their corresponding MFE structures as predicted by NUPACK for three randomly selected 60-nt RNA sequences. See Supplementary Fig. 11A for additional examples with 120-nt RNA sequences. d Four representative VIS4Map examples of randomly selected 118-nt RNA toehold-switch sequences from an OFF-predictive CNN model. e Averaged VIS4Maps of 10,125 randomly selected toehold-switch RNA sequences from our library test set processed with our OFF-predicting CNN model (left) and compared their corresponding averaged MFE maps obtained using NUPACK (right). f Averaged VIS4Maps of the 10% most accurately predicted switches sorted by quartile from lowest OFF (tight) to highest OFF (leaky); inset for the toehold and the hairpin stem. After contrast enhancement of averaged VIS4Maps to visualize sparsely distributed secondary structures, a noticeable increase in structures outside of the prominent equilibrium-designed switch hairpin structure appears to correlate with increased toehold leakiness. A toehold-switch schematic (right) is shown to denote how incorrectly folded and potentially weaker kinetically stable intermediate structures might compete with the correctly folded structure that is designed to be reached at equilibrium. All source data are provided as a Source Data file.

Similar articles

Cited by

References

    1. Isaacs FJ, Dwyer DJ, Collins JJ. RNA synthetic biology. Nat. Biotechnol. 2006;24:545. doi: 10.1038/nbt1208. - DOI - PubMed
    1. Green AA, Silver PA, Collins JJ, Yin P. Toehold switches: de-novo-designed regulators of gene expression. Cell. 2014;159:925–939. doi: 10.1016/j.cell.2014.10.002. - DOI - PMC - PubMed
    1. Pardee K, et al. Rapid, low-cost detection of Zika virus using programmable biomolecular components. Cell. 2016;165:1255–1266. doi: 10.1016/j.cell.2016.04.059. - DOI - PubMed
    1. Takahashi MK, et al. A low-cost paper-based synthetic biology platform for analyzing gut microbiota and host biomarkers. Nat. Commun. 2018;9:3347. doi: 10.1038/s41467-018-05864-4. - DOI - PMC - PubMed
    1. Green AA, et al. Complex cellular logic computation using ribocomputing devices. Nature. 2017;548:117. doi: 10.1038/nature23271. - DOI - PMC - PubMed

Publication types