. 2020 Oct 7;9(10):88.
doi: 10.1038/s41389-020-00270-2.

Overexpression of Cyclin E1 or Cdc25A leads to replication stress, mitotic aberrancies, and increased sensitivity to replication checkpoint inhibitors

Affiliations

Overexpression of Cyclin E1 or Cdc25A leads to replication stress, mitotic aberrancies, and increased sensitivity to replication checkpoint inhibitors

Yannick P Kok et al. Oncogenesis. .

Abstract

Oncogene-induced replication stress, for instance as a result of Cyclin E1 overexpression, causes genomic instability and has been linked to tumorigenesis. To survive high levels of replication stress, tumors depend on pathways to deal with these DNA lesions, which represent a therapeutically actionable vulnerability. We aimed to uncover the consequences of Cyclin E1 or Cdc25A overexpression on replication kinetics, mitotic progression, and the sensitivity to inhibitors of the WEE1 and ATR replication checkpoint kinases. We modeled oncogene-induced replication stress using inducible expression of Cyclin E1 or Cdc25A in non-transformed RPE-1 cells, either in a TP53 wild-type or TP53-mutant background. DNA fiber analysis showed Cyclin E1 or Cdc25A overexpression to slow replication speed. The resulting replication-derived DNA lesions were transmitted into mitosis causing chromosome segregation defects. Single cell sequencing revealed that replication stress and mitotic defects upon Cyclin E1 or Cdc25A overexpression resulted in genomic instability. ATR or WEE1 inhibition exacerbated the mitotic aberrancies induced by Cyclin E1 or Cdc25A overexpression, and caused cytotoxicity. Both these phenotypes were exacerbated upon p53 inactivation. Conversely, downregulation of Cyclin E1 rescued both replication kinetics, as well as sensitivity to ATR and WEE1 inhibitors. Taken together, Cyclin E1 or Cdc25A-induced replication stress leads to mitotic segregation defects and genomic instability. These mitotic defects are exacerbated by inhibition of ATR or WEE1 and therefore point to mitotic catastrophe as an underlying mechanism. Importantly, our data suggest that Cyclin E1 overexpression can be used to select patients for treatment with replication checkpoint inhibitors.


Conflict of interest statement

M.A.T.M.v.V. has acted on the Scientific Advisory Board of Repare Therapeutics, which is unrelated to this work. The other authors declare no conflict of interest.

Figures
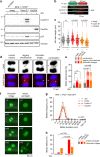
Fig. 1
Fig. 1. Cdc25A or Cyclin E1 overexpression leads to replication stress.
a RPE-1-TP53wt cells were engineered to overexpress empty, Cyclin E1 or Cdc25A constructs in a doxycycline-inducible manner. Immunoblot shows Cyclin E1, Cdc25A, p53, and Vinculin protein levels at 48 h after addition of doxycycline (dox). b Cells were treated with doxycycline for 48 h, were subsequently labeled for 20 min with CldU (25 µM) and for 20 min with IdU (250 µM). Representative DNA fibers from doxycycline-treated cells are shown. Scale bar measures 10 µm. c Quantification of IdU DNA fiber lengths as described in panel b. At least 266 fibers were analyzed. Graphs show individual data points, median and interquartile range. p-values were calculated using the Mann–Whitney U test. d Examples of chromatin bridges and lagging chromosomes. Cells were stained with α-Tubulin (red) and counterstained with DAPI (blue). Scale bar indicates 10 µm. e Quantification of anaphase and telophase cells containing chromatin bridges and/or lagging chromosomes. The bars represent the mean and standard error or the mean (SEM) from three experiments, n > 25 per experimental condition; p-values were calculated using two-tailed Student’s t-test. f Representative examples of mitotic aberrancies observed in RPE-1-TP53wt cells transduced with H2B-EGFP using live-cell microscopy. Scale bar represents 20 µm. g Duration of mitosis as measured by nuclear envelope breakdown to anaphase. Cells were pre-treated with doxycycline for 24 h and subsequently followed with live-cell microscopy using 7 min intervals for the duration of 48 h. p-value was calculated using a Kruskal–Wallis test. h Quantification of aberrant mitoses in cells from panel h. p-values were calculated using absolute values, using Mann–Whitney U test.
Fig. 2
Fig. 2. Mutation of TP53 exacerbates replication stress and mitotic defects.
a Schematic overview of CRISPR/Cas9 gene targeting in TP53 gene. The exon map and protein coding are based on Emsembl entry ENSG00000141510. Placement of the sgRNA sequence is indicated with a horizontal line under exon 4 and the wild type sequence. Sanger sequencing shows that the gRNA targeting exon 4 induced a −7 bp deletion and a +215 bp insertion in RPE-TP53−/− cl#1 and a −1 deletion and +2 insertion in RPE-TP53−/− cl#2, leading to frame-shifts in TP53. b RPE-1-TP53−/− cl#1 cells were engineered to overexpress empty, Cyclin E1 or Cdc25A constructs in a doxycycline-inducible manner. Immunoblot shows Cyclin E1, Cdc25A, p53, and Vinculin protein levels at 48 h after addition of doxycycline (dox). RPE-1-TP53wt cells were used as a positive control for p53. c Cells were treated with doxycycline for 48 h, and were then labeled for 20 min with CldU (25 µM) and subsequently for 20 min with IdU (250 µM). Per condition at least 279 fibers were analyzed. Graphs show individual data points, median and interquartile range. p-values were calculated using the Mann–Whitney U test. d Quantification of anaphase or telophase cells containing chromatin bridges or lagging chromosomes. The bars represent mean and standard error or the mean (SEM) from three experiments, n > 25 per experimental condition; p-values were calculated using two-tailed Student’s t-test. e Representative examples of mitotic aberrancies observed in RPE-1-TP53−/− cells transduced with H2B-EGFP cells using live-cell microscopy. Scale bar represents 20 µm. f Duration of mitosis as measured by NEB breakdown to anaphase. Cells were pre-treated for 24 h with doxycycline and subsequently followed with live-cell microscopy using 7 min intervals for the duration of 48 h. p-value was calculated using a Kruskal–Wallis test. g Quantification of aberrant mitoses in cells from panel f. p-values were calculated using absolute values, using Mann–Whitney U test.
Fig. 3
Fig. 3. Cyclin E1 or Cdc25A overexpression induces genomic instability.
a Genome-wide copy number deviation plots of RPE-TP53−/− cl#1 empty (n = 47), RPE-TP53−/− cl#1 -Cyclin E1 (n = 44) and RPE-TP53−/− cl#1 -Cdc25A cells (n = 46). Cells were treated with doxycycline for 120 h. After single cell sorting, genomic DNA was harvested for single-cell whole genome sequencing (sc-WGS). Each panel displays the individual cells in rows, and the chromosomes numbers from 1-X in columns. The modal copy number state is pictured in green, deviations of the modal copy number state, both focal and whole-chromosome, are colored red). b Copy-number alterations (CNAs) per cell were calculated according to the modal state. Medians with interquartile range are depicted and statistical analyses were performed using a One-sided Mann–Whitney U test. c whole numerical chromosomes per cell were counter per single cell. Medians with interquartile range are depicted and statistical analyses were performed using a one-sided Mann–Whitney U test.
Fig. 4
Fig. 4. ATR and WEE1 inhibition cause mitotic aberrancies.
a, b RPE-TP53wt (panel a) and RPE-TP53−/− cl#1 (panel b) cells were treated with doxycycline for 72 h to induce overexpression of Cyclin E or Cdc25A. Control cells (RPE-TP53wt) were then left untreated or were treated with ATR inhibitor (ATRi, VE-822, 1 µM) for 2 h, followed by a 6 h treatment with hydroxyurea (HU, 1 mM) and immunoblotted for ATR-response proteins pATR, pCHK1, pRPA, and γH2AX, and for WEE1-response marker pCDK (Tyr15). Vinculin serves as a loading control. c, d RPE-TP53wt (panel c) and RPE-TP53−/− cl#1 (panel d) were treated with doxycycline for 72 h to induce overexpression of Cyclin E or Cdc25A. Control cells (RPE-TP53wt) were then left untreated or were treated with ATR inhibitor (ATRi, VE-822, 1 µM) for 2 h, followed by a 6 h treatment with hydroxyurea (HU, 1 mM) and immunoblotted for WEE1 response protein pCDK (Tyr15). e RPE-1-TP53wt cells induced to express Cyclin E1 or Cdc25A were treated with ATR inhibitor (ATRi, VE-822, 0.25 µM) for 8 h as indicated. The percentages of anaphase or telophase cells containing chromatin bridges or lagging chromosomes were quantified. The bars represent mean and standard error or the mean (SEM) from three experiments, n > 25 per condition; p-values were calculated using two-tailed Student’s t-test. f RPE-1-TP53wt cells induced to express Cyclin E1 or Cdc25A were treated with WEE1 inhibitor (WEE1i, MK-1775, 0.1 µM) for 8 h if indicated. The percentages of anaphase or telophase cells containing chromatin bridges or lagging were quantified. The bars represent mean and SEM from three experiments, n > 25 per experimental condition; p-values were calculated using two-tailed Student’s t-test. g RPE-1-TP53−/− cl#1 cells induced to express Cyclin E1 or Cdc25A were treated as in panels e and f. The percentages of anaphase or telophase cells containing chromatin bridges or lagging chromosomes were quantified. The bars represent mean and SEM from three experiments, n > 25 per experimental condition; The p-values were calculated by one-way ANOVA (p < 0.0001) and followed by Sidak’s multiple comparison test. h Percentage of RPE-1-TP53−/− cl#1 -Cyclin E1-H2B-EGFP cells that showed aberrant mitoses. Cells were pre-treated for 24 h with doxycycline. Cells were then treated with ATR inhibitor (VE-822, 0.25 µM) or WEE1 inhibitor (MK-1775, 0.1 µM), and subsequently followed with live-cell microscopy using 7 min intervals for 48 h. p-values were calculated using a Mann–Whitney U test. i RPE-1-TP53wt and RPE-1-TP53−/− cl#1 cell lines were induced to express Cyclin E1 or Cdc25A, and were treated for 3 days with ATR inhibitor (VE-822) in a range from 0 to 3.2 µM, or WEE1 inhibitor (MK-1775) in a range from 0 to 1.28 µM. Subsequently, relative cell survival was assessed using MTT conversion as a proxy. Plots include mean and standard error of the means (SEM) of three biological replicates. Reported p-values were calculated by a Student’s t-test comparing the area under the curve of doxycycline-untreated samples to the curve of the doxycycline-treated samples.
Fig. 5
Fig. 5. Reducing Cyclin E1 overexpression diminishes replication stress and mitotic errors.
a HCC1806 cells transduced with inducible Cyclin E1 construct (shCCNE1#1 or shCCNE1#2) or control shRNA (shLuc) were treated with doxycycline for 2 days, and immunoblotted for Cyclin E1 and β-Actin. Cyclin E1 protein levels were measured and normalized to ‘shLuc -DOX’ controls for each experiment. Bar graphs reflect the average and standard deviation from eight independent experiments. b Cyclin E1 knock-down after 2 days of doxycycline treatment assessed by immunofluorescence microscopy. The white lines indicate boundaries of nuclei based on DAPI counterstaining. c Average staining intensity of Cyclin E1 as shown in panel b was categorized and plotted in a histogram. The curve fitted is a log-normal Gaussian distribution. At least 450 nuclei were measured. d Percentage of EdU-positive cells after 48 h of doxycycline treatment, measured by flow cytometry. e Representative pictures of clonogenic survival of HCC1806 cells. Cells were plated in six-well plates and allowed to attach for 24 h, after which doxycycline was added. After 14 days, surviving colonies were stained. f, g Colony survival percentages compared to Luc-dox controls f and relative average diameter of colonies counted g in panel f, relative to Luc-dox control. Bars represent the mean and standard error of the mean (SEM) mitotic fraction of two independent experiments. p-values were calculated using two-tailed Student’s t-test h cells were treated with doxycycline for 48 h and sequentially labeled for 20 min with CldU (25 µM) and 20 min with IdU (250 µM). Representative DNA fibers of doxycycline-treated samples are shown. i Quantification of IdU DNA fiber lengths as described in panel h. Per condition, at least 466 fibers were analyzed and corresponding medians with interquartile range are shown. p-value was calculated using Mann–Whitney U test. j γH2AX intensity as measured by flow cytometry in cells treated with and without doxycycline for 48 h. Means and SEM normalized to the untreated luciferase condition are shown from three biological replicates. k Cyclin E1 knock-down was induced by doxycycline treatment for 48 h. Cells were then fixed and the percentage of mitotic aberrancies was quantified. Data represents mean and SEM of three independent experiments; at least 30 mitoses were analyzed for each experimental condition. The p-values were calculated by one-way ANOVA (p < 0.0001) and followed by Sidak’s multiple comparison test. l Duration of mitosis as measured by NEB breakdown to anaphase. HCC1806 H2B-EGFP cells were pre-treated for 48 h with doxycycline and subsequently followed with live-cell microscopy in 7 min intervals for the duration of 48 h. p-value was calculated using a Kruskal–Wallis test. and subsequently followed with live-cell microscopy using 7 min intervals for 48 h. Duration of mitosis is shown. m Quantification of aberrant mitoses in cells from panel l. p-values were calculated using absolute values, using Mann–Whitney U test.
Fig. 6
Fig. 6. Cyclin E1 overexpression is required for ATR and WEE1 inhibitor sensitivity.
a HCC1806 cell lines were induced to express Cyclin E1 shRNA for 2 days and were then treated with 0.25 µM of ATR inhibitor (ATRi, VE-822) or 0.1 µM of WEE1 inhibitor (WEE1i, MK-1775) for 8 h. Cells were then fixed and stained for DNA content (propidium iodine) and for mitotic population (MPM2) and analyzed using flow cytometry. Bars represent the mean and standard error of the mean (SEM) mitotic fraction of four independent experiments, normalized to untreated Luc-dox; p-values were calculated using two-tailed Student’s t-test b, c HCC1806 cell lines were induced to express Cyclin E1 shRNA and were subsequently treated for 3 days with ATR inhibitor (ATRi, VE-822) (panel b) or WEE1 inhibitor (WEE1i, MK-1775) (panel c) in a range from 0 to 1.28 µM. Subsequently, relative cell survival was assessed using MTT conversion as a proxy. Averages and standard error of the means (SEM) of three biological replicates are plotted. Reported p-values were calculated by a Student’s t-test comparing the area under the curve of doxycycline untreated samples to the curve of the doxycycline-treated samples. d Doxycycline-inducible HCC1806 cells were plated in six-well plates and allowed to attach for 24 h. Subsequently, cells were treated with doxycycline and 0.05 µM of ATR inhibitor (ATRi, VE-822) or 0.08 µM of WEE1 inhibitor (WEE1i, MK-1775). After 11 days, surviving colonies were stained. e Quantification of clonogenic survival from panel d. Bars represent the mean and SEM of clonogenic survival, relative to the non-doxycycline treated controls of two independent experiments; p-values were calculated using two-tailed Student’s t-test. f Quantification of colony diameter, relative to non-treated shLuc cells of two independent experiments. Bars represent mean and SEM; p-values were calculated using two-tailed Student’s t-test.

References

    1. Negrini S, Gorgoulis VG, Halazonetis TD. Genomic instability—an evolving hallmark of cancer. Nat. Rev. Mol. Cell Biol. 2010;11:220–228. doi: 10.1038/nrm2858. - DOI - PubMed
    1. Gerlinger M, Swanton C. How Darwinian models inform therapeutic failure initiated by clonal heterogeneity in cancer medicine. Br. J. Cancer. 2010;103:1139–1143. doi: 10.1038/sj.bjc.6605912. - DOI - PMC - PubMed
    1. Bester AC, et al. Nucleotide deficiency promotes genomic instability in early stages of cancer development. Cell. 2011;145:435–446. doi: 10.1016/j.cell.2011.03.044. - DOI - PMC - PubMed
    1. Zeman MK, Cimprich KA. Causes and consequences of replication stress. Nat. Cell Biol. 2014;16:2–9. doi: 10.1038/ncb2897. - DOI - PMC - PubMed
    1. Abbas, T., Keaton, M. A. & Dutta, A. Genomic instability in cancer. Cold Spring Harb. Perspect. Biol. 5, a012914 (2013). - PMC - PubMed