. 2020 Oct 7;10(1):16656.
doi: 10.1038/s41598-020-73340-5.

Ninjurin 1 dodecamer peptide containing the N-terminal adhesion motif (N-NAM) exerts proangiogenic effects in HUVECs and in the postischemic brain

Affiliations

Ninjurin 1 dodecamer peptide containing the N-terminal adhesion motif (N-NAM) exerts proangiogenic effects in HUVECs and in the postischemic brain

Seung-Woo Kim et al. Sci Rep. .

Abstract

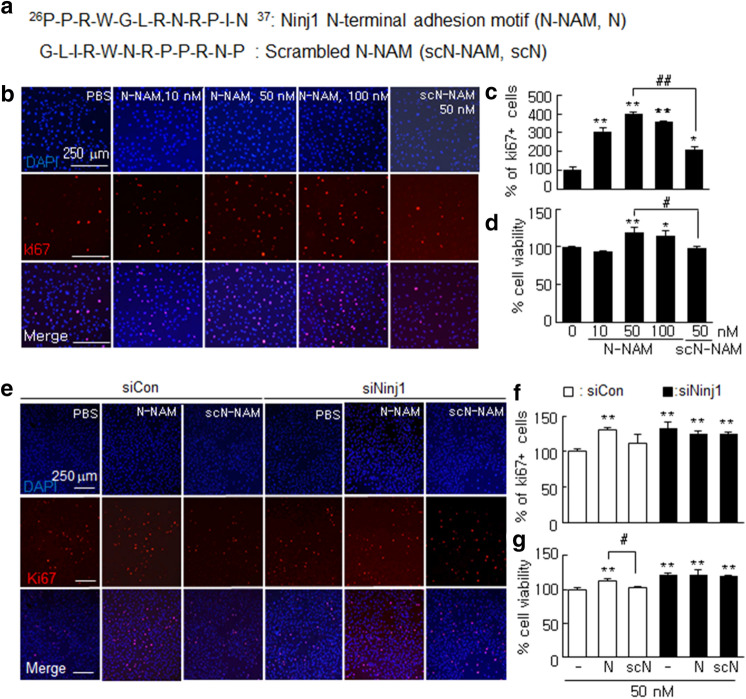
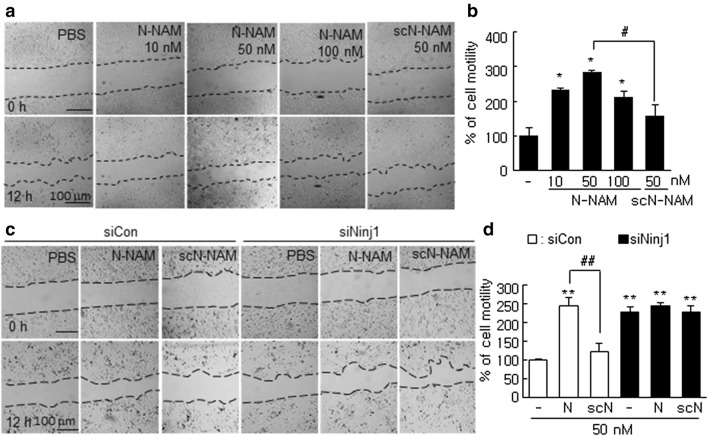
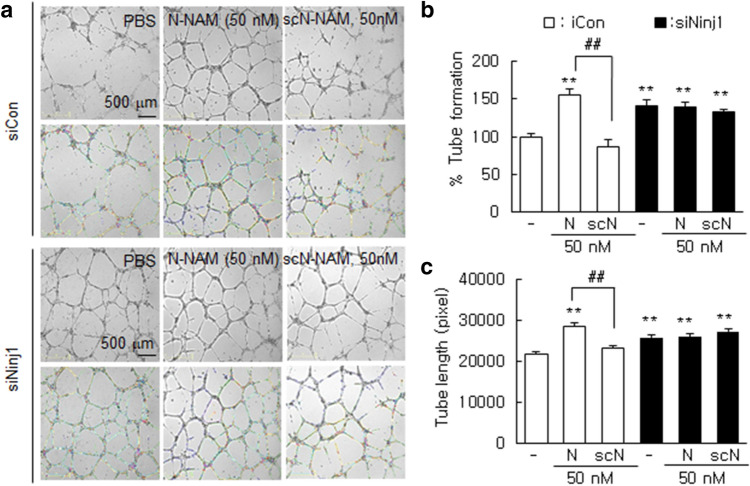
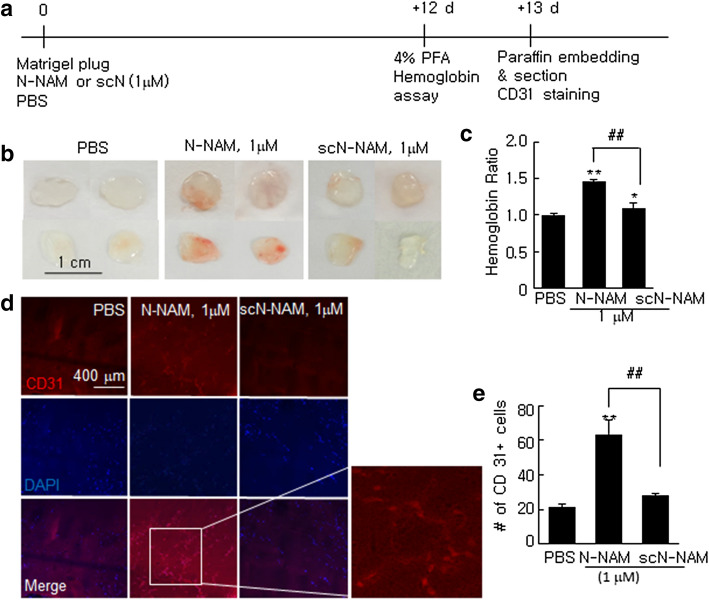
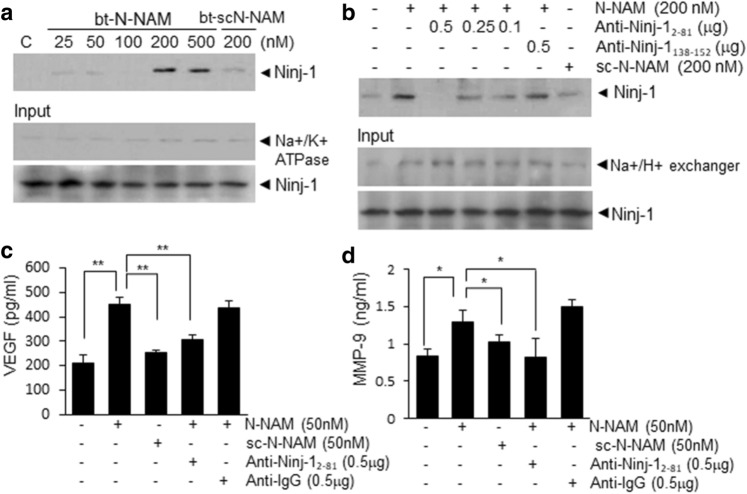
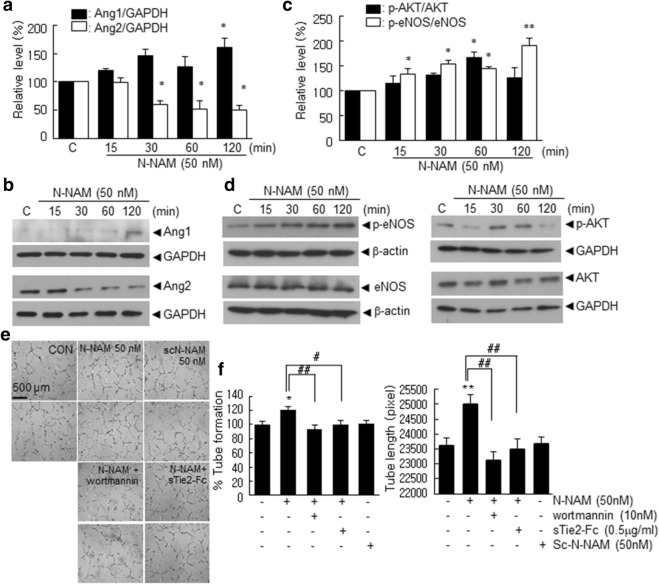
Nerve injury-induced protein 1 (Ninjurin 1, Ninj1) is a cell adhesion molecule responsible for cell-to-cell interactions between immune cells and endothelial cells. In our previous paper, we have shown that Ninj1 plays an important role in the infiltration of neutrophils in the postischemic brain and that the dodecamer peptide harboring the Ninj1 N-terminal adhesion motif (N-NAM, Pro26-Asn37) inhibits infiltration of neutrophils in the postischemic brain and confers robust neuroprotective and anti-inflammatory effects. In the present study, we examinedt the pro-angiogenic effect of N-NAM using human umbilical vein endothelial cells (HUVECs) and rat MCAO (middle cerebral artery occlusion) model of stroke. We found that N-NAM promotes proliferation, migration, and tube formation of HUVECs and demonstrate that the suppression of endogenous Ninj1 is responsible for the N-NAM-mediated pro-angiogenic effects. Importantly, a pull-down assay revealed a direct binding between exogenously delivered N-NAM and endogenous Ninj1 and it is N-terminal adhesion motif dependent. In addition, N-NAM activated the Ang1-Tie2 and AKT signaling pathways in HUVECs, and blocking those signaling pathways with specific inhibitors suppressed N-NAM-induced tube formation, indicating critical roles of those signaling pathways in N-NAM-induced angiogenesis. Moreover, in a rat MCAO model, intranasal administration of N-NAM beginning 4 days post-MCAO (1.5 µg daily for 3 days) augmented angiogenesis in the penumbra of the ipsilateral hemisphere of the brain and significantly enhanced total vessel lengths, vessel densities, and pro-angiogenic marker expression. These results demonstrate that the 12-amino acid Ninj1 peptide, which contains the N-terminal adhesion motif of Ninj1, confers pro-angiogenic effects and suggest that those effects might contribute to its neuroprotective effects in the postischemic brain.


Conflict of interest statement

The authors declare no competing interests.

Figures

Figure 1
Figure 1
Induction of cell proliferation by N-NAM in human umbilical vein endothelial cell (HUVEC) cultures. (a) Sequences of N-NAM and scrambled N-NAM (scN-NAM). (b,c) HUVECs were treated with N-NAM (10, 50, 100 nM) or scN-NAM (50 nM) for 24 h, and cell proliferation was measured after immunofluorescent staining with anti-Ki67 antibody. Ki67-positive cells among DAPI (4′,6-diamidino-2-phenylindole)-positive cells were counted in two high-power fields in each of three plates. (e,f) Ninj1 siRNA (siNinj1) and non-specific siRNA (siCon) were transfected into separate HUVECs, and then the cells were treated with 50 nM of N-NAM or scN-NAM. The number of Ki67-positive cells was counted after immunostaining with anti-Ki67 antibody. Representative images are presented (b,e), and the results are presented as the means ± SEMs (n = 6). (d,f) MTT assays were performed under the same conditions used in b and e. The results are also presented as the means ± SEMs (n = 6). Scale bars, 250 µm. **p < 0.01, *p < 0.05 versus PBS-treated controls, ##p < 0.01, #p < 0.05 between indicated groups.
Figure 2
Figure 2
Induction of cell migration by N-NAM in HUVECs. (a,b) HUVECs were incubated with N-NAM (10, 50, or 100 nM) or scN-NAM (50 nM) for 12 h, and cell migration was evaluated using a wound healing assay and measuring wound widths at 0 and 12 h after scratching. (c,d) HUVECs were transfected with Ninj1 siRNA (siNinj1) or non-specific siRNA (siCon) and then treated with 50 nM of N-NAM or scN-NAM. Cell migrations was evaluated using a wound healing assay and measuring wound widths at 0 and 12 h. Representative images are shown (a,c), and the results are presented as the means ± SEMs (n = 5) (b,d). Scale bars, 100 μm. **p < 0.01, *p < 0.05 versus PBS-treated controls, #p < 0.05, ##p < 0.01 between indicated groups.
Figure 3
Figure 3
Induction of tube formation by N-NAM in HUVECs. HUVECs were transfected with Ninj1 or non-specific siRNA, and tube formation was accessed after incubating the cells with N-NAM (50 nM) or scN-NAM (50 nM) for 12 h. (a) Images obtained using an ImageJ analyzer (https://imagej.nih.gov/ij/download.html) are presented (green, branches; yellow, master segments; blue, tubes; red, master junctions) and (b) the number of tubes and (c) total tube lengths were measured. Results are presented as the means ± SEMs (n = 10). Scale bars, 500 μm. **p < 0.01 versus PBS-treated controls, ##p < 0.01 between indicated groups.
Figure 4
Figure 4
Proangiogenic effects of N-NAM in a reconstituted tissue model of angiogenesis. (a) Matrigel was mixed with 1 µM of N-NAM, scN-NAM, or PBS and injected subcutaneously into the mid-ventral region of BALB/c mice. Plugs were harvested 12 days later and subjected to a hemoglobin assay and immunofluorescent staining. (b) Representative images of Matrigel after harvesting. (c) Hemoglobin content was measured and normalized versus the Matrigel weights in the plugs. Results are presented as the means ± SEMs (n = 3). (d,e) Plugs were embedded in paraffin, and sections were prepared and stained with anti-CD31 antibody. The number of CD31-positive cells was counted and the results are presented as the means ± SEMs (n = 3). **p < 0.01, *p < 0.05 versus PBS-treated controls, ##p < 0.01 between indicated groups.
Figure 5
Figure 5
Interaction between N-NAM and endogenous Ninj1 and induction of proangiogenic markers in HUVECs. Direct binding between endogenous Ninj1 and biotinylated-N-NAM (bt-N-NAM) or biotinylated-scN-NAM (bt-scN-NAM) was examined using a pull-down assay. (a) HUVECs were treated with bt-N-NAM (25, 50, 100, 200, or 500 nM) or bt-scN-NAM (200 nM) for 3 h. Complexes were pulled down with streptavidin beads, and the level of Ninj1 in each binding complex was measured by immunoblot using anti-Ninj1 antibody. (b) HUVECs were preincubated with anti-Ninj12–81 (0.1, 0.25, or 0.5 ng/μl) or anti-Ninj1138–152 antibody (0.5 ng/μl) for 15 min and then treated with bt-N-NAM (200 nM) or bt-scN-NAM (200 nM) for 3 h and a pull-down assay was carried out as described in (a). A Na+/K+ ATPase , Na+/H+ exchanger, and Ninj1 were used as input controls. (c,d) VEGF (vascular endothelial growth factor) and MMP9 (matrix metallopeptidase 9) levels in culture media from HUVECs were assessed by ELISA after treating the cells with N-NAM (50 nM) or scN-NAM (50 nM) in the presence or absence of anti-Ninj12–81 (1 µg/ml) antibody or IgG (1 µg/ml). Results are presented as the means ± SEMs (n = 3). **p < 0.01, *p < 0.05 versus the N-NAM-treated cells.
Figure 6
Figure 6
The Ang1-Tie2 and PI3K/AKT signaling pathways were involved in the N-NAM-mediated proangiogenic effect. (ad) HUVECs were incubated with N-NAM (50 nM) for 15, 30, 60, or 120 min, and Ang1 or Ang2 levels (a,b) and total and phosphorylated AKT and eNOS levels (c,d) were assessed by immunoblotting. Representative images are presented (b,d) and results are presented as the means ± SEMs (n = 3 for Ang1, Ang2, and eNOS and n = 5 for AKT) (a,c). (ef) HUVECs were treated with N-NAM (50 nM) or scN-NAM (50 nM) for 12 h with or without sTie2-Fc (0.5 µg/ml) or wortmannin (10 nM) pretreatment and tube formation was examined. Representative images are presented and the number of tubes and total tube lengths are presented as the means ± SEMs (n = 10). Scale bar in e, 500 µm, **p < 0.01, *p < 0.05 versus the PBS-treated controls, #p < 0.05 versus 50 nM N-NAM-treated cells.
Figure 7
Figure 7
Proangiogenic effects of N-NAM in the postischemic brain. (a) N-NAM (5 µg) or scN-NAM (5 µg) was administered intranasally three times daily at 4, 5, and 6 days after 60 min of MCAO. (b,c) At 7 days post-MCAO, coronal brain sections were stained using cresyl violet (b) or double-fluorescence-stained with anti-rat endothelial cell antigen-1 (RECA-1) antibody and DAPI (c). Representative images are presented (c), and RECA-1-positive vessel densities are presented as the mean ± SEMs (n = 5) (d). Total vessel lengths were measured using AngioTool software 0.6a (https://angiotool.software.informer.com/0.6/), and the results are presented as the means ± SEMs (n = 5) (e). Scale bars, 100 μm, **p < 0.01 versus the 50 nM N-NAM-treated group.
Figure 8
Figure 8
Functional blood vessel formation and proangiogenic marker induction by N-NAM in the postischemic brain. N-NAM (5 µg) or scN-NAM (5 µg) was administered intranasally three times daily at 4, 5 and 6 days after 60 min of MCAO, and IgG or fluorescein isothiocyanate (FITC)-dextran (60 mg/kg) was injected intravenously (i.v.) 1 h prior to sacrifice 7 days post-MCAO (Fig. 7a). Coronal brain sections were prepared and stained using biotynylated rat anti-IgG antibody for IgG staining (b) or FITC-dextran images acquired with confocal microscopy (c). IgG-positive area or FITC intensity were measured using Scion Image 4.0 (https://scion-image.software.informer.com/) or ImageJ (https://imagej.nih.gov/ij/download.html), respectively. Representative images are shown (upper panels in b and c), and the intraparenchymal leakage area are presented as the means ± SEMs (n = 7 for IgG staining and n = 12 (3 consecutive planes from 4 animals) for FITC-dextran image). (d,e) Tissue lysates were prepared from the asterisked regions in (a) 7 days post-MCAO and immunoblotted for Ang1 and Ang2. (f) Schematic diagram of a proposed mechanism showing how N-NAM induce angiogenesis in HUVECs. Ang1, angiopoietin-1; Ang2, angiopoietin-2; MMP-9, metalloprpoteinase 9; VEGF, vascular endothelial growth factor; eNOS, endothelial nitric oxide synthase. The results are representative of three independent experiments. Scale bars, 200 or 50 μm in C, **p < 0.01, *p < 0.05 versus theN-NAM + PBC control group.

References

    1. Chen J, et al. Atorvastatin induction of VEGF and BDNF promotes brain plasticity after stroke in mice. J. Cereb. Blood Flow Metab. 2005;25:281–290. doi: 10.1038/sj.jcbfm.9600034. - DOI - PMC - PubMed
    1. Zhang Z, Chopp M. Vascular endothelial growth factor and angiopoietins in focal cerebral ischemia. Trends Cardiovasc. Med. 2002;12:62–66. doi: 10.1016/S1050-1738(01)00149-9. - DOI - PubMed
    1. Krupinski J, Kaluza J, Kumar P, Kuma S, Wang JM. Role of angiogenesis in patients with cerebral ischemic stroke. Stroke. 1994;25:1794–1798. doi: 10.1161/01.STR.25.9.1794. - DOI - PubMed
    1. Hayashi T, Noshita N, Sugawara T, Chan PH. Temporal profile of angiogenesis and expression of related genes in the brain after ischemia. J. Cereb. Blood Flow Metab. 2003;23:166–180. doi: 10.1097/01.WCB.0000041283.53351.CB. - DOI - PubMed
    1. Liu XS, et al. Stroke induces gene profile changes associated with neurogenesis and angiogenesis in adult subventricular zone progenitor cells. J. Cereb. Blood Flow Metab. 2007;27:564–574. doi: 10.1038/sj.jcbfm.9600371. - DOI - PubMed

Publication types

MeSH terms

Substances