. 2020 Oct 7;10(1):16669.
doi: 10.1038/s41598-020-73704-x.

Arabidopsis phenotyping reveals the importance of alcohol dehydrogenase and pyruvate decarboxylase for aerobic plant growth

Affiliations

Arabidopsis phenotyping reveals the importance of alcohol dehydrogenase and pyruvate decarboxylase for aerobic plant growth

Irene Ventura et al. Sci Rep. .

Abstract

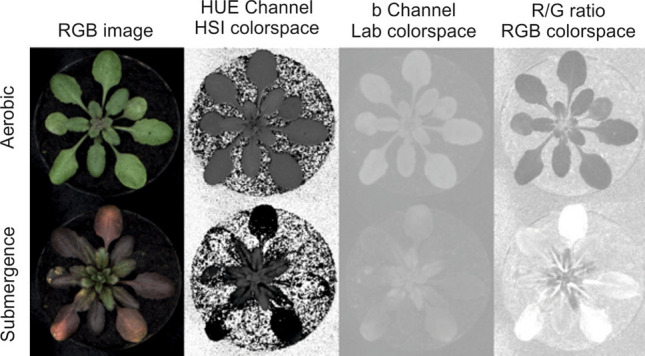
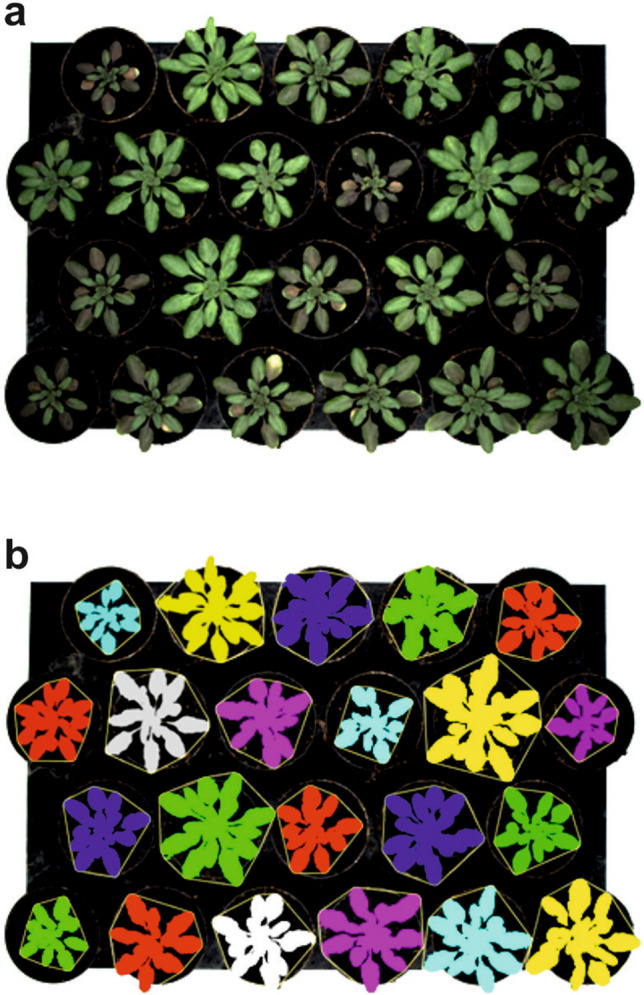
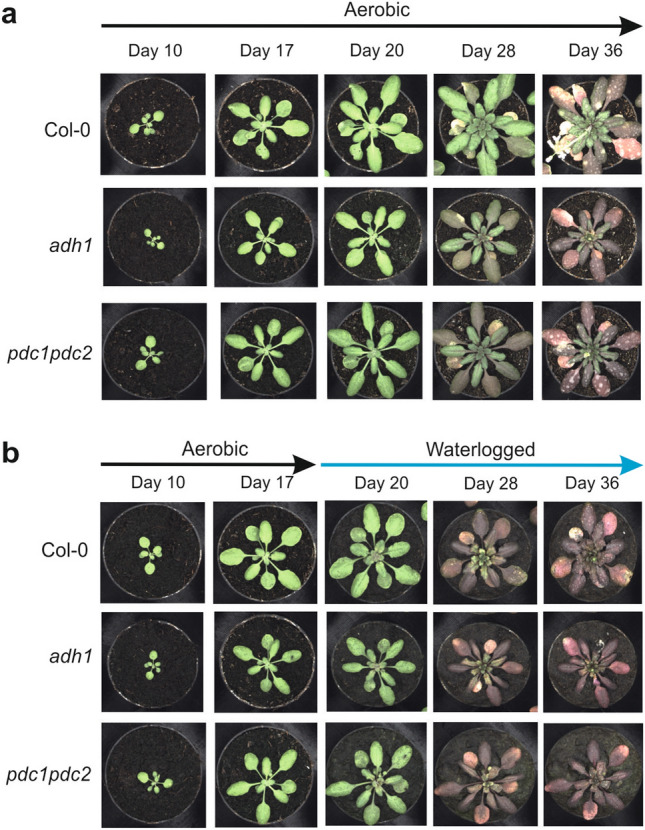
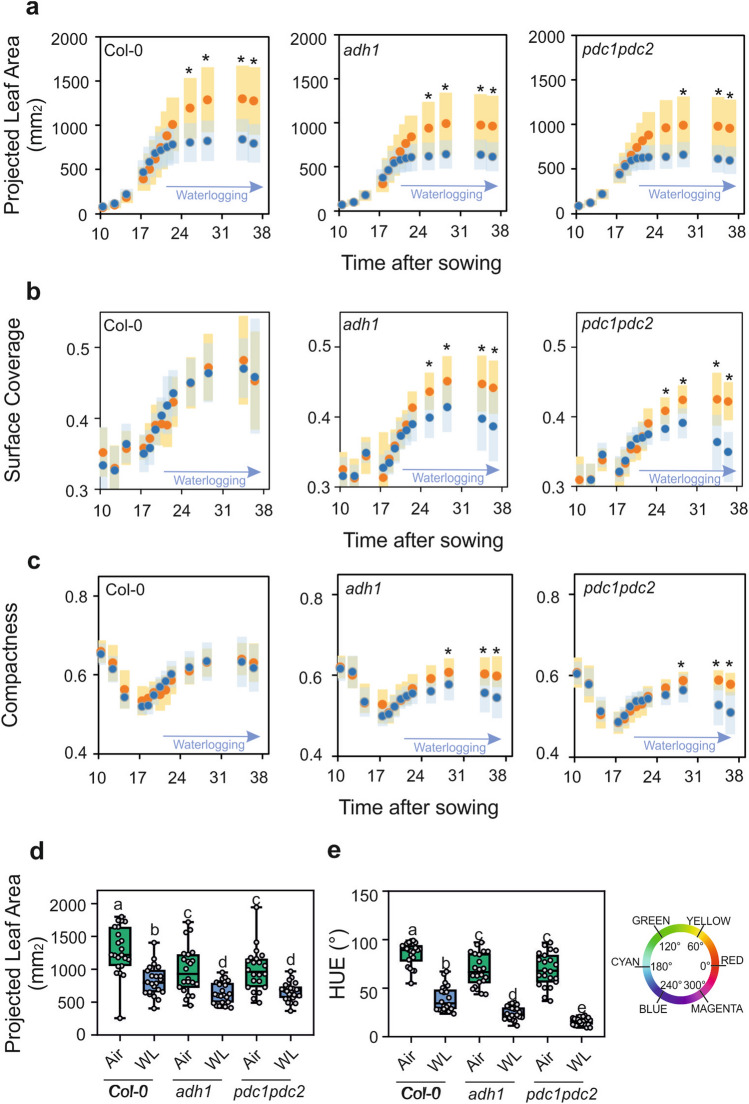
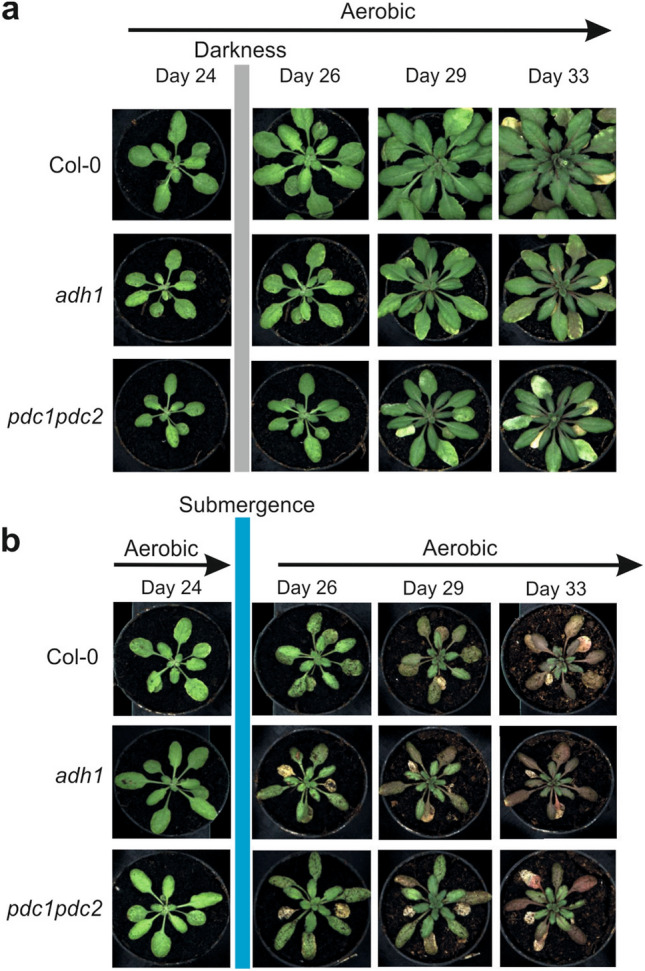
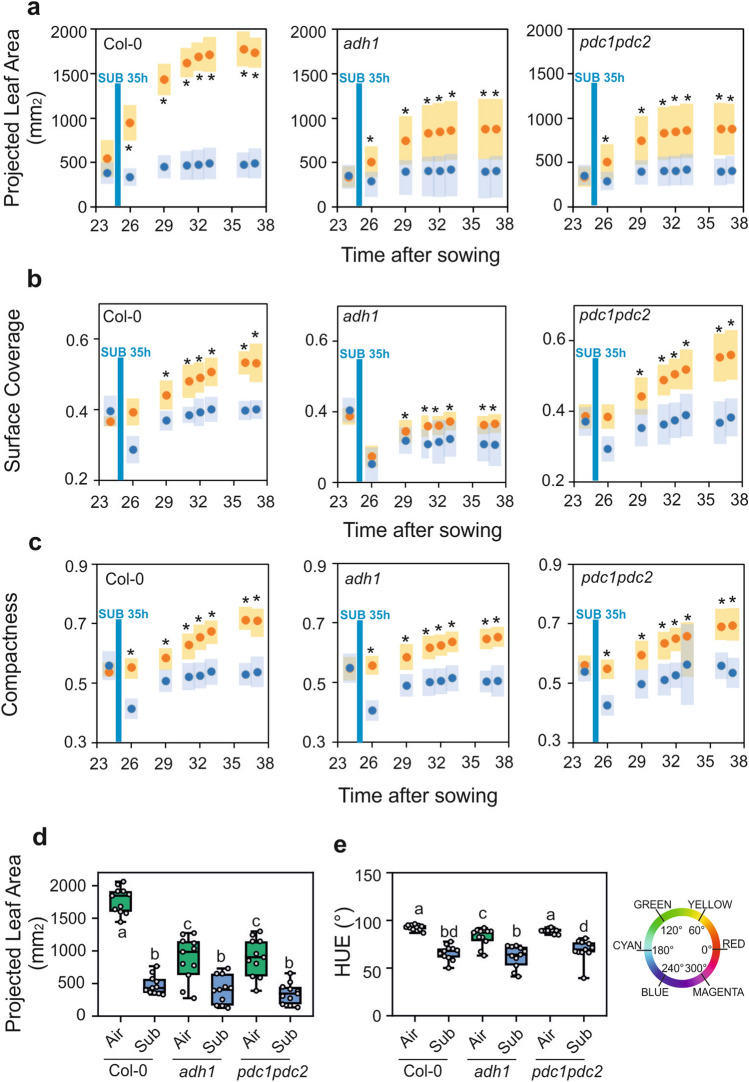
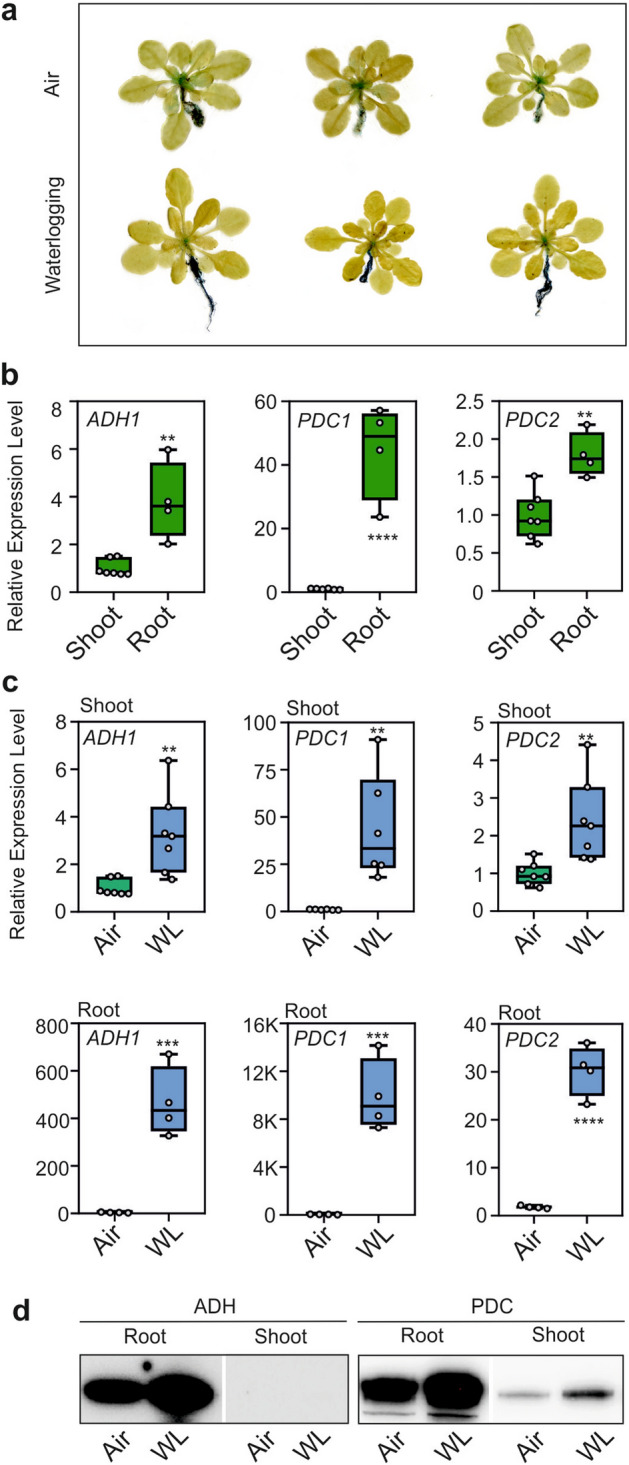
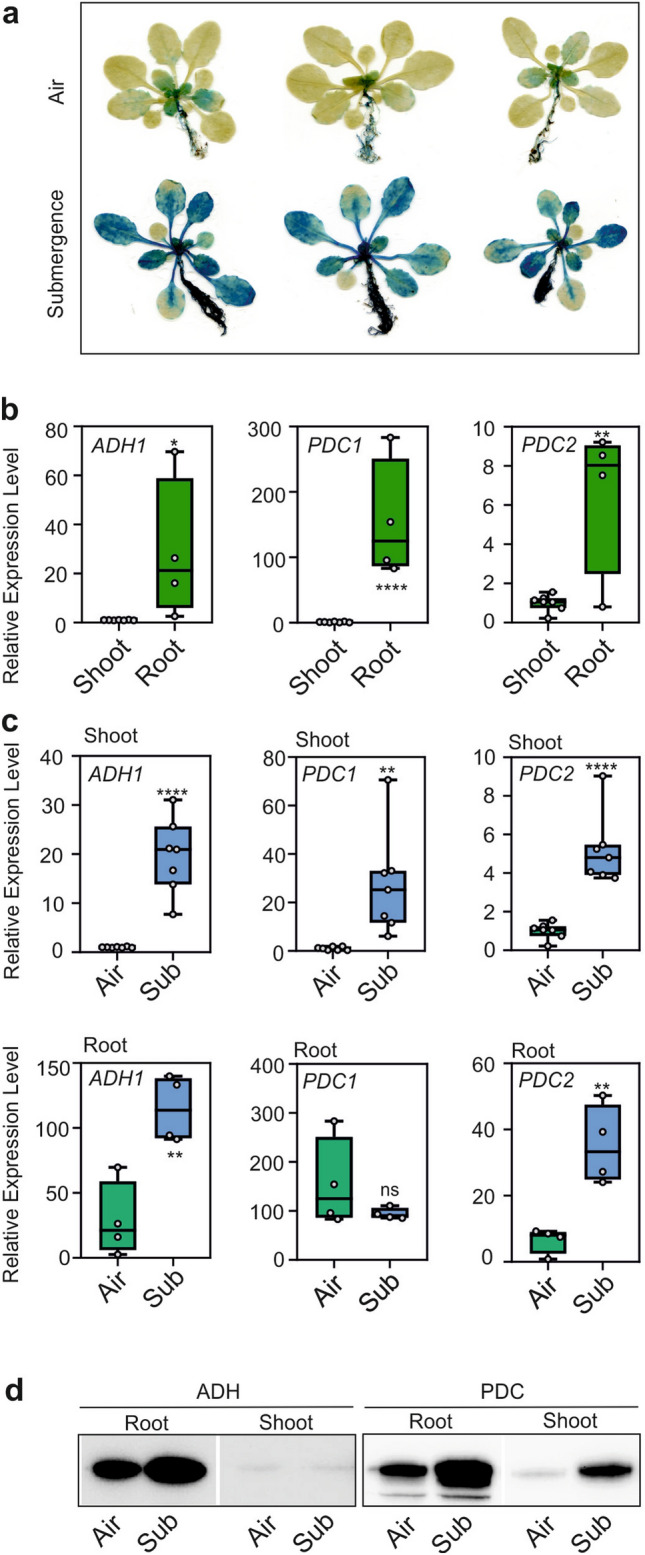
Alcohol dehydrogenase (ADH) and pyruvate decarboxylase (PDC) are key to the establishment of the fermentative metabolism in plants during oxygen shortage. Most of the evidence that both ADH and PDC are required for plant tolerance to hypoxia comes from experiments performed by limiting oxygen in the environment, such as by exposing plants to gaseous hypoxia or to waterlogging or submergence. However, recent experiments have shown that hypoxic niches might exist in plants grown in aerobic conditions. Here, we investigated the importance of ADH and PDC for plant growth and development under aerobic conditions, long-term waterlogging and short-term submergence. Data were collected after optimizing the software associated with a commercially-available phenotyping instrument, to circumvent problems in separation of plants and background pixels based on colour features, which is not applicable for low-oxygen stressed plants due to the low colour contrast of leaves with the brownish soil. The results showed that the growth penalty associated with the lack of functional ADH1 or both PDC1 and PDC2 is greater under aerobic conditions than in hypoxia, highlighting the importance of fermentative metabolism in plants grown under normal, aerobic conditions.


Conflict of interest statement

The authors declare the following competing interests: at the time of the study Tino Dornbusch was an employee of LemnaTec GmbH. The other authors have no competing interests as defined by Nature Research, or other interests that might be perceived to influence the results and/or discussion reported in this paper.

Figures

Figure 1
Figure 1
Arabidopsis grown under aerobic and submerged conditions to illustrate the reduced color contrast arising from the stress treatment in the HUE channel (HSI colorspace) b channel (Lab colorspace) and the Red/Green ratio (RGB colorspace). While the aerobic plant shows color contrast to the background, this contrast is greatly reduced for the submerged plant.
Figure 2
Figure 2
Image segmentation separating plants with green or reddish leaves from brownish background. Plants with reddish leaves are difficult to identify correctly using a phenotyping instrument based on RGB imaging unless training is performed and specific machine-learning algorithms are used. (a) Tray with Arabidopsis plants with different leaf colors. (b) Segmented image obtained with the software developed here, showing that almost all pixels are correctly associated with plants, regardless of their leaf color. Pixels related to each plant are colored as overlay on the original image. The convex hull area of the plants is also shown as a thin yellow line around the plant shape.
Figure 3
Figure 3
Effect of waterlogging on the phenotype of Arabidopsis plants. Plants were grown under aerobic conditions for 17 days and then transferred to waterlogging conditions. Waterlogging treatments were performed with plants having all the root system under water, but with the petioles and leaves above the water level. (a) Plants grown under aerobic conditions for 36 days. (b) Plants grown under aerobic conditions for 17 days and transferred to waterlogging conditions for up to 36 days.
Figure 4
Figure 4
Plant size (a) and morphology traits (b, c) plotted against time in aerobic plants (orange symbols) compared to plants that were waterlogged (blue symbols). Variance (± SD, n = 22) is shown as color-shaded areas (yellow: aerobic; light blue: waterlogging). Statistically significant differences are indicated by an asterisk (T test, pairwise comparison at each time point, * = p < 0.01). (d) Plant size (projected leaf area) in aerobic plants (green box) compared to plants that were waterlogged (blue box). Data were taken at day 28. (e) Color (HUE-value from HSI color space) in aerobic plants (green box) compared to plants that were waterlogged (blue box). The color wheel gives values for HUE ranging from 0 to 360°. Data were taken at day 28. Lines in the boxes indicate the median. The bottom and top of each box denote the first and third quartile, respectively. The dots represent the single data points and whiskers denote the min/max values. Different letters indicate statistically significant differences (ANOVA).
Figure 5
Figure 5
Effect of submergence on the phenotype of Arabidopsis plants. Plants were grown under aerobic conditions for 24 days and then transferred to submergence for 35 h. Plants were then transferred back to aerobic conditions. Tanks with a water level of 10 cm above leaf level were used to submerge the plants. (a) Plants grown under aerobic conditions for 33 days. (b) Plants grown under aerobic conditions for 24 days, and transferred to submergence for 35 h, and back to aerobic conditions until day 33.
Figure 6
Figure 6
Plant size (a) and morphology traits (b, c) plotted against time in aerobic plants (orange symbols) compared to plants that were submerged for 35 h (blue symbols). Variance (± SD, n = 22) is shown as color-shaded areas (yellow: aerobic; light blue: submergence). Statistically significant differences are indicated by an asterisk (T-test, pairwise comparison at each time point, p < 0.01). (d) Plant size (projected leaf area) in aerobic plants (green box) compared to plants that were submerged (blue box). Data were taken at day 33. (e) Color (HUE value; HSI color space) in aerobic plants (green box) compared to plants that were submerged (blue box). The color wheel shows values for HUE ranging from 0 to 360°. Data were taken at day 33. Lines in the boxes indicate the median. The bottom and top of each box denote the first and third quartile, respectively. The dots represent the single data points and whiskers denote the min/max values. Different letters indicate statistically significant differences (ANOVA).
Figure 7
Figure 7
Expression of ADH1 and PDC1 in aerobic and waterlogged Arabidopsis plants. (a) GUS staining of pADH1:GUS plants in air or 5-day waterlogging. (b) Comparison of the expression (RT-qPCR) of ADH1, PDC1, and PDC2 in roots and shoots of aerobic plants. (c) Comparison of the expression (RT-qPCR) of ADH1, PDC1, and PDC2 in air (green box) vs. 5-day waterlogging (WL, blue box). Lines in the boxes indicate the median. The bottom and top of each box denote the first and third quartile, respectively. The dots represent the single data points and whiskers denote the min/max values. Statistically significant differences are indicated by an asterisk (T test, pairwise comparison at each time point, * = p < 0.05; ** = p < 0.01; *** = p < 0.001; **** = p < 0.0001). (d) Immunoblot analysis of proteins in aerobic and waterlogged plants. Equal loading was verified by protein staining (Figure S4).
Figure 8
Figure 8
Expression of ADH1, PDC1, and PDC2 in aerobic and submerged Arabidopsis plants. (a) GUS staining of pADH1:GUS plants in air or 35 h submergence. (b) Comparison of the expression (RT-qPCR) of ADH1 and PDC1 in roots and shoots of aerobic plants. (c) Comparison of the expression (RT-qPCR) of ADH1, PDC1 and PDC2 in air (green box) vs. 35 h submergence (Sub, blue box). Lines in the boxes indicate the median. The bottom and top of each box denote the first and third quartile, respectively. The dots represent the single data points and whiskers denote the min/max values. Statistically significant differences are indicated by an asterisk (T-test, pairwise comparison at each time point, * = p < 0.05; ** = p < 0.01; *** = p < 0.001; **** = p < 0.0001). (d) Immunoblot analysis of proteins in aerobic and submerged plants. Equal loading was verified by protein staining (Figure S4).

References

    1. Loreti E, van Veen H, Perata P. Plant responses to flooding stress. Curr. Opin. Plant Biol. 2016;33:64–71. doi: 10.1016/j.pbi.2016.06.005. - DOI - PubMed
    1. Perata P, Alpi A. Plant responses to anaerobiosis. Plant Sci. 1993;93:1–17. doi: 10.1016/0168-9452(93)90029-Y. - DOI
    1. App AA, Meiss AN. Effect of aeration on rice alcohol dehydrogenase. Arch. Biochem. Biophys. 1958;77:181–190. doi: 10.1016/0003-9861(58)90054-7. - DOI - PubMed
    1. Schwartz D. Genetic control of alcohol dehydrogenase–a competition model for regulation of gene action. Genetics. 1971;67:411–425. - PMC - PubMed
    1. Freeling M, Schwartz D. Genetic relationships between the multiple alcohol dehydrogenases of maize. Biochem. Genet. 1973;8:27–36. doi: 10.1007/BF00485554. - DOI - PubMed

MeSH terms

LinkOut - more resources