. 2020 Oct 7;10(1):16679.
doi: 10.1038/s41598-020-73845-z.

Wnt antagonist FRZB is a muscle biomarker of denervation atrophy in amyotrophic lateral sclerosis

Affiliations

Wnt antagonist FRZB is a muscle biomarker of denervation atrophy in amyotrophic lateral sclerosis

Thaddaeus Kwan et al. Sci Rep. .

Abstract

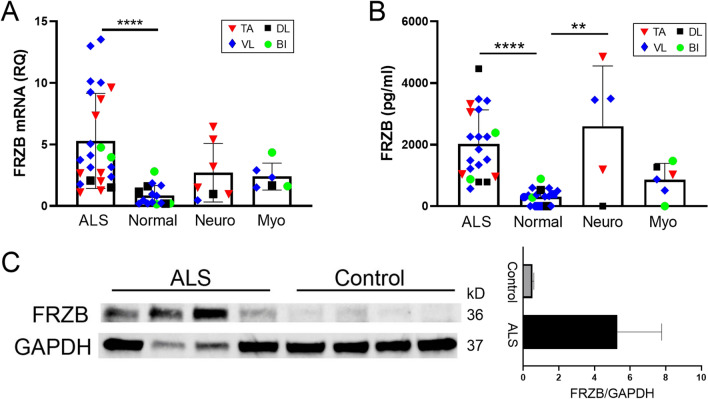
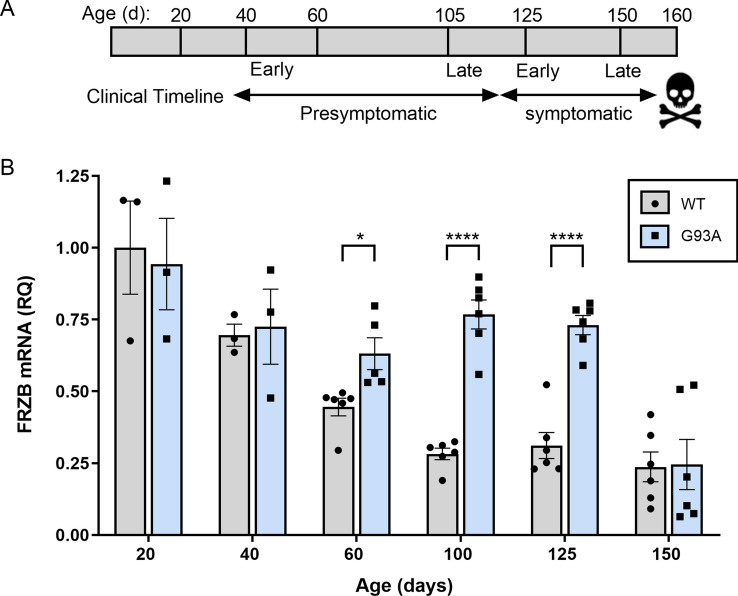
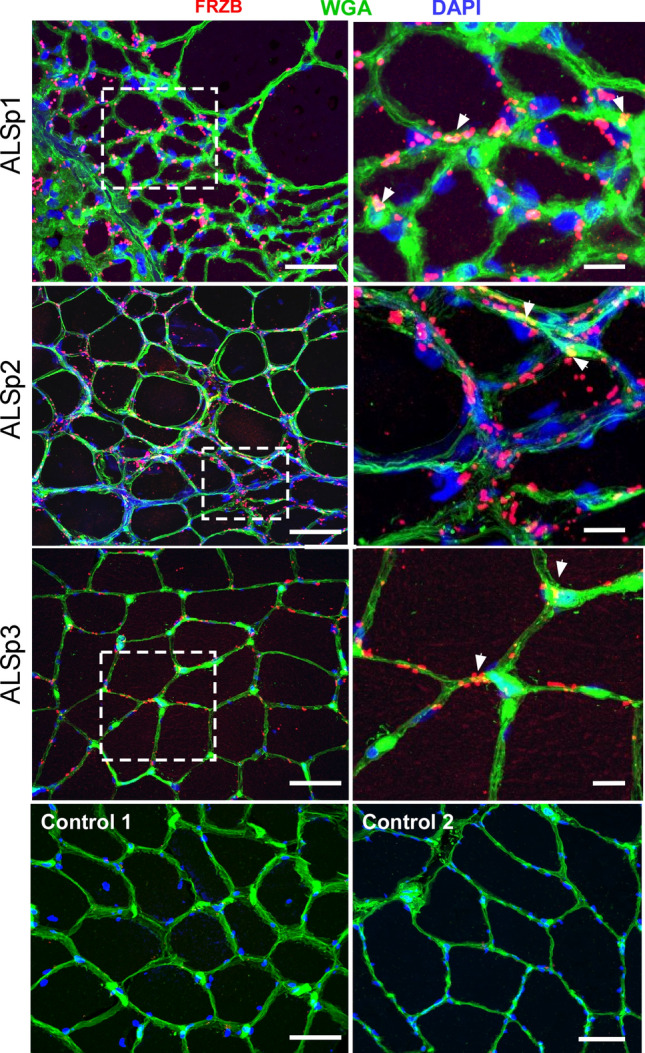
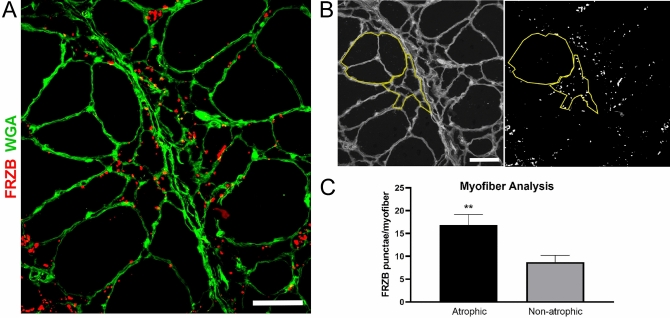
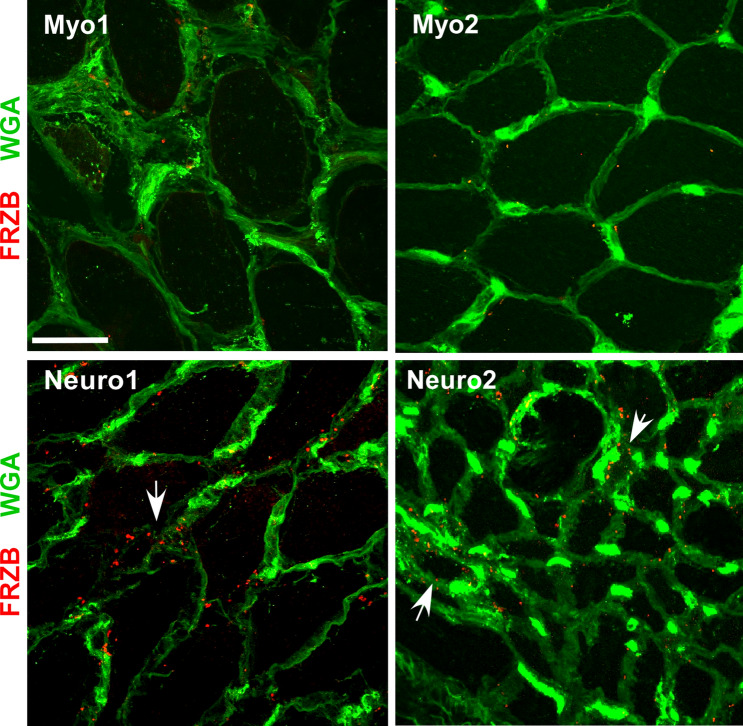
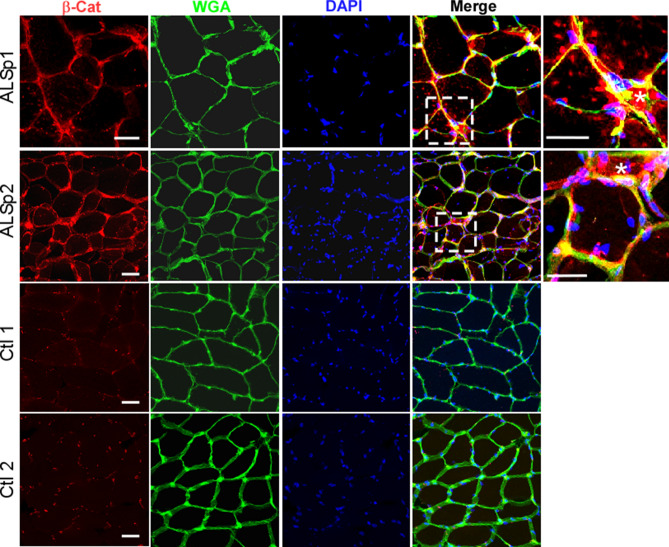
Skeletal muscle and the neuromuscular junction are the earliest sites to manifest pathological changes in amyotrophic lateral sclerosis (ALS). Based on prior studies, we have identified a molecular signature in muscle that develops early in ALS and parallels disease progression. This signature represents an intersection of signaling pathways including Smads, TGF-β, and vitamin D. Here, we show that the Wnt antagonist, Frizzled Related Protein (FRZB), was increased in ALS muscle samples and to a variable extent other denervating disease but only minimally in acquired myopathies. In the SOD1G93A mouse, FRZB was upregulated in the early stages of disease (between 40 and 60 days) until end-stage. By immunohistochemistry, FRZB was predominantly localized to endomysial connective tissue and to a lesser extent muscle membrane. There was a significant increase in immunoreactivity surrounding atrophied myofibers. Because FRZB is a Wnt antagonist, we assessed β-catenin, the canonical transducer of Wnt signaling, and found increased levels mainly at the muscle membrane. In summary, we show that FRZB is part of a molecular signature of muscle denervation that may reflect disease progression in ALS. Our findings open up avenues for future investigation as to what roles FRZB and Wnt signaling might be playing in muscle denervation/reinnervation.


Conflict of interest statement

The authors declare no competing interests.

Figures

Figure 1
Figure 1
FRZB is upregulated in ALS muscle tissues. (A) FRZB mRNA expression in muscle was quantitated relative to GAPDH endogenous control using qPCR. Mean FRZB mRNA expression in normal control samples (n = 15) was set to 1. Mean values (± SD) for FRZB mRNA in ALS (n = 24), myopathy (n = 6), and neuropathy (n = 7) were expressed as fold-change over normal control. ****P < 0.0001. (B) FRZB protein expression was quantitated in muscle lysates using ELISA. Mean (± SD) FRZB protein concentrations (pg/ml) for normal control (n = 18), ALS (n = 21), myopathy (n = 6), and neuropathy (n = 5) are shown. *P < 0.5; ****P < 0.0001. (C) Left panel: western blot comparing FRZB expression in vastus lateralis muscle samples from ALS and normal control subjects using GAPDH as a loading control. Full blots are shown in Supplemental Fig. S1. Right panel: Quantitation (mean ± SD) of FRZB protein levels estimated by densitometry and normalized to GAPDH.
Figure 2
Figure 2
FRZB mRNA is upregulated in the gastrocnemius muscle of the SOD1G93A mouse in presymptomatic and symptomatic stages of disease. (A) Time line of clinical progression in the SOD1G93A mouse. (B) FRZB mRNA expression was quantitated relative to GAPDH endogenous control using qPCR at different ages in SOD1G93A mice and littermate controls (WT). Mean FRZB expression in WT mice at 20 days was set to 1 and FRZB mRNA in all other groups was normalized to that group (Mean ± SD). For groups at 20 and 40 days, n = 3; 60, 100, 125, 150 days, n = 6. *P < 0.5; ****P < 0.0001.
Figure 3
Figure 3
FRZB is upregulated in ALS myofibers. Immunohistochemistry of FRZB in vastus lateralis muscle in three ALS and two normal control subjects is shown. FRZB staining is punctate in appearance around the periphery of myofibers. Enlarged photomicrographs of boxed areas in the ALS sections are shown in the panels on the right. Arrowheads show areas of merged FRZB/WGA signal. No immunoreactivity is seen in two normal control muscle samples (bottom panels). Scale bars, 50 µM in low power views and 10 µM in the enlarged views.
Figure 4
Figure 4
FRZB immunoreactivity is increased in atrophic myofibers of ALS muscle samples. Muscle sections from ALS patients were immunostained for quantification of FRZB punctae. (A) Representative section (from a deltoid muscle) showing the presence of both atrophic (< 25 µM) and non-atrophic myofibers (> 25 µM). The section is also immunostained with an FRZB antibody. (B) Micrographs were analyzed by ImageJ where the number of FRZB punctae associated with non-atrophic and atrophic myofibers was quantitated (yellow tracing shown in the representative section). (C) Quantitative results of FRZB-positive punctae in muscle sections from 5 ALS patients (1 deltoid, 1 biceps and 3 vastus lateralis muscles). Columns represent the mean ± SEM of 34 atrophic and 26 non-atrophic fibers analyzed. **P = 0.009. Scale bars, 50 μM.
Figure 5
Figure 5
FRZB expression in disease controls. FRZB immunostaining comparing myopathy (Myo1, necrotizing myopathy, vastus lateralis; Myo2, inflammatory myopathy, biceps) and neuropathy (Neuro1, deltoid; and Neuro2, vastus lateralis) disease controls. Some immunostaining of FRZB is seen in the neuropathy controls surrounding myofibers that appear atrophied (arrows). Minimal to no punctate signal is seen in the myopathy samples. Scale bar, 50 µM.
Figure 6
Figure 6
Increased levels of membranous β-catenin are detected in ALS muscle. Muscle sections from two ALS patients show increased β-catenin immunoreactivity which is predominantly membranous. Enlargement of the boxed area shows particularly intense myofiber staining of membrane associated β-catenin (merged signal with the membrane-associated lectin, WGA). Several of the myofibers are atrophic (asterisk). Sections from two age-matched healthy controls are shown below. Scale bars, 50 µM for low power views and 20 µM in the enlarged views (areas outlined by dashed boxes).

References

    1. Verber NS, et al. Biomarkers in motor neuron disease: A state of the art review. Front. Neurol. 2019;10:291. doi: 10.3389/fneur.2019.00291. - DOI - PMC - PubMed
    1. Mehta P, et al. Prevalence of amyotrophic lateral sclerosis—United States, 2015. Morb. Mortal. Wkly. Rep. 2018;67:1285–1289. doi: 10.15585/mmwr.mm6746a1. - DOI - PMC - PubMed
    1. Al-Chalabi A, Hardiman O. The epidemiology of ALS: A conspiracy of genes, environment and time. Nat. Rev. Neurol. 2013;9:617–628. doi: 10.1038/nrneurol.2013.203. - DOI - PubMed
    1. Bradley WG. Biological markers in amyotrophic lateral sclerosis: Help or hindrance? J. Neurol. 1999;246:13–15. doi: 10.1007/bf03161084. - DOI - PubMed
    1. Benatar M, et al. ALS biomarkers for therapy development: State of the field and future directions. Muscle Nerve. 2016;53:169–182. doi: 10.1002/mus.24979. - DOI - PMC - PubMed

Publication types

MeSH terms

Substances