. 2020 Oct;586(7830):600-605.
doi: 10.1038/s41586-020-2785-8. Epub 2020 Oct 7.

The genomic landscapes of individual melanocytes from human skin

Affiliations

The genomic landscapes of individual melanocytes from human skin

Jessica Tang et al. Nature. 2020 Oct.

Erratum in

Abstract

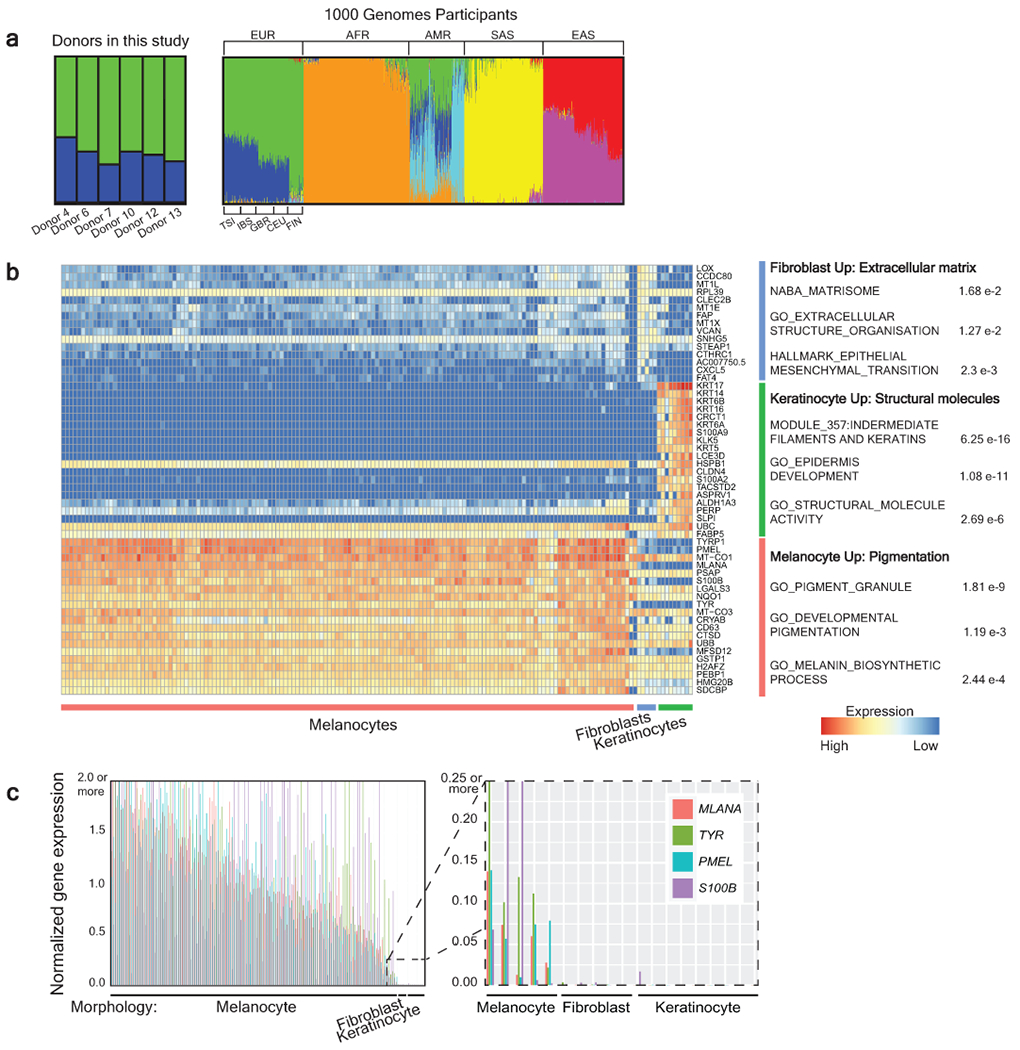
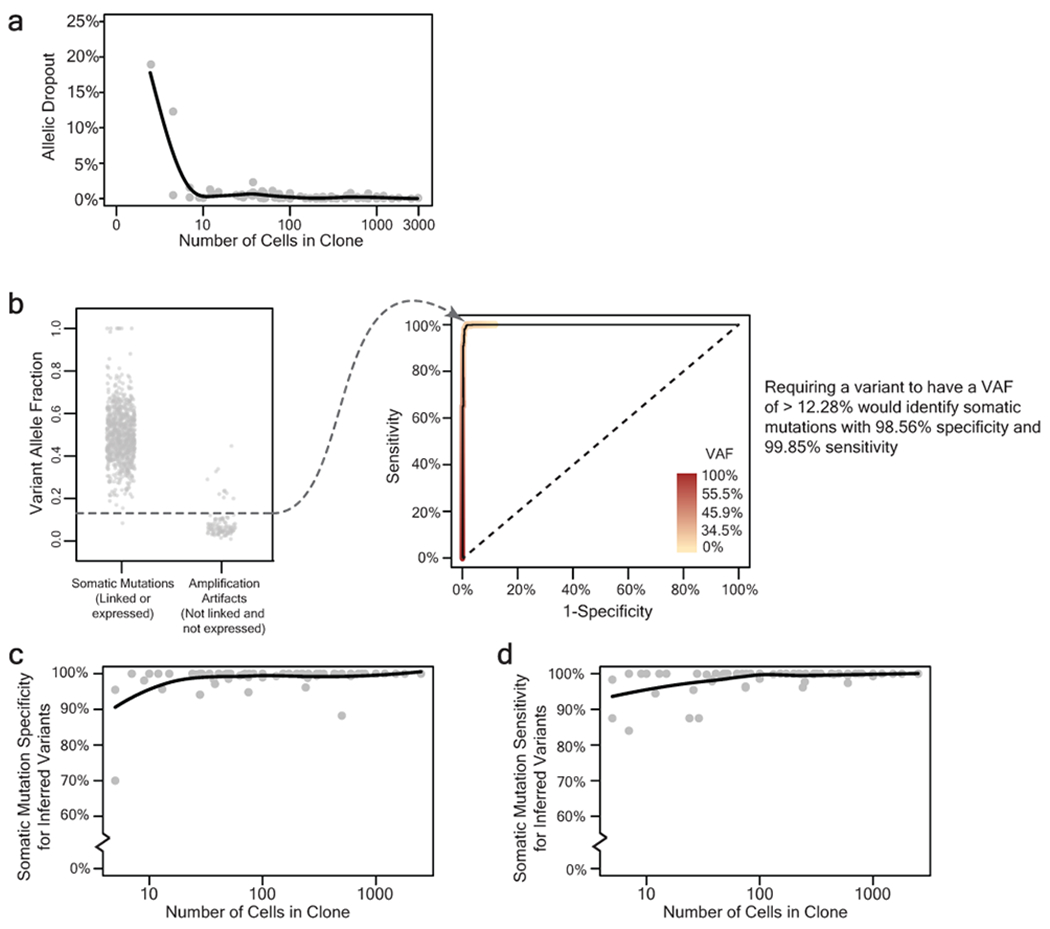
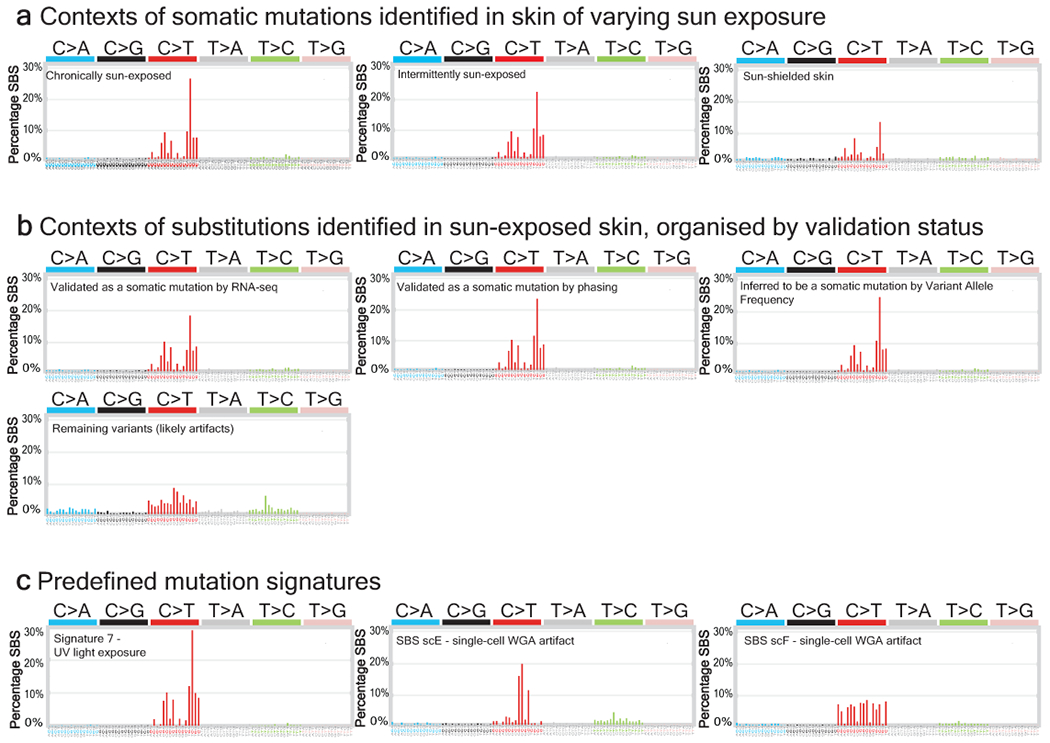
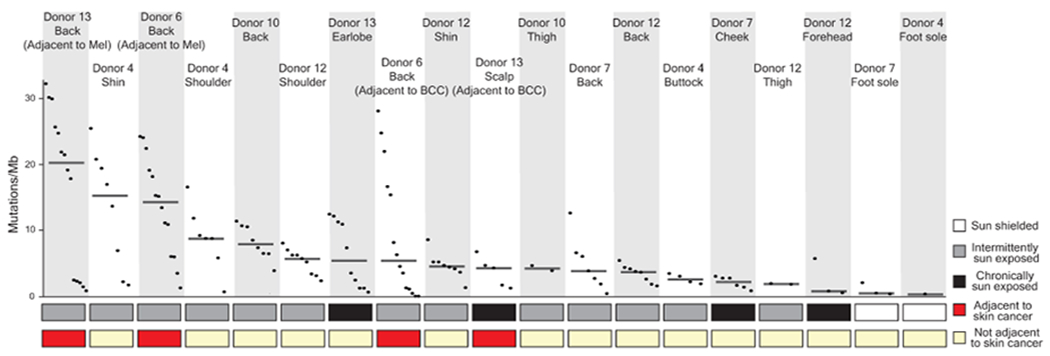
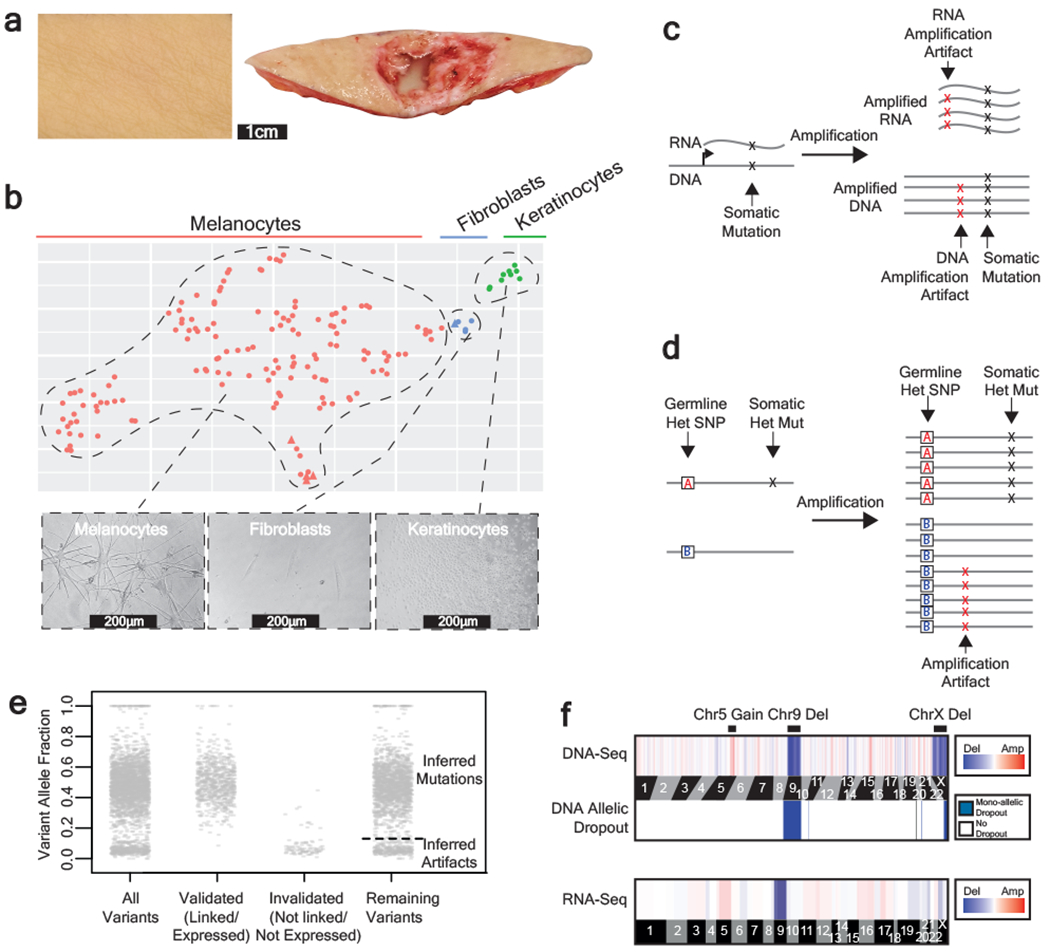
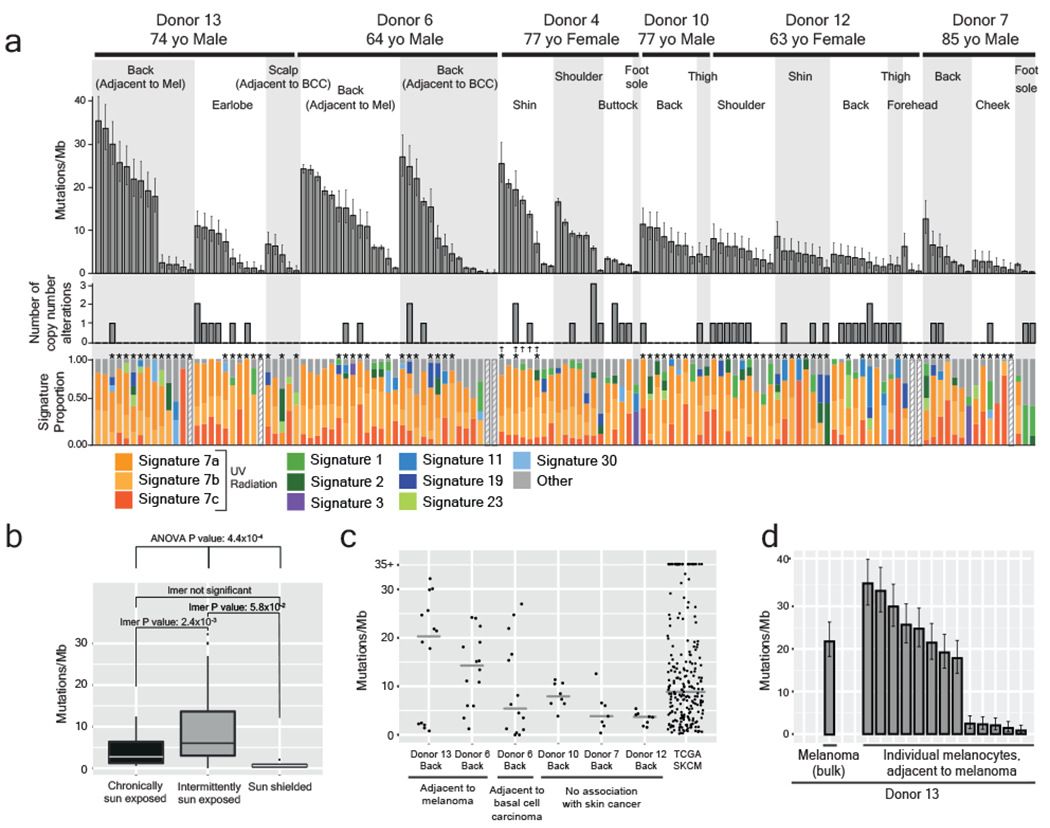
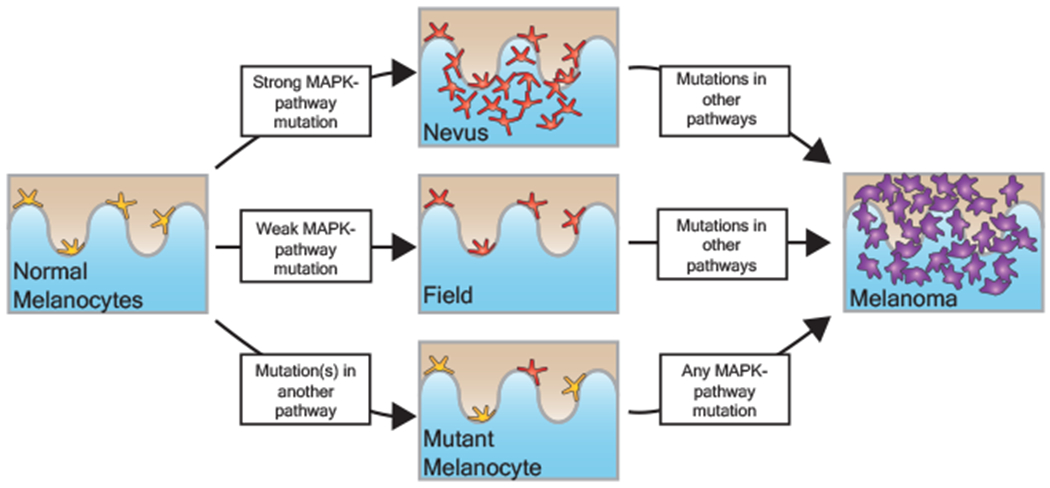
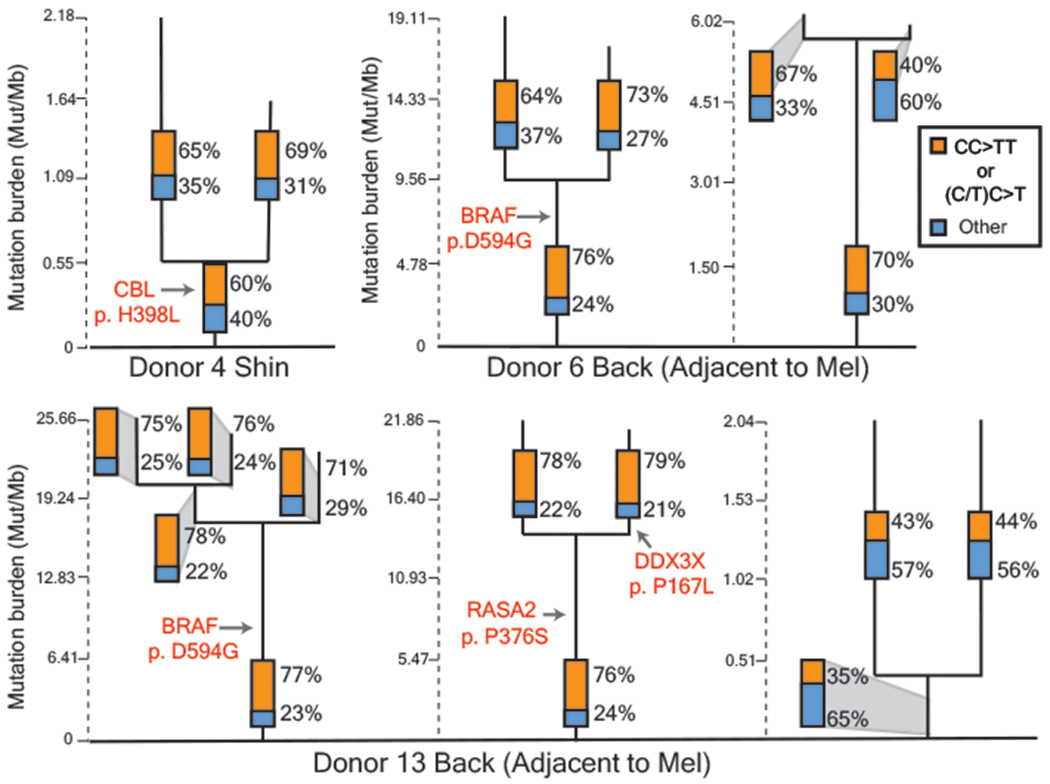
Every cell in the human body has a unique set of somatic mutations, but it remains difficult to comprehensively genotype an individual cell1. Here we describe ways to overcome this obstacle in the context of normal human skin, thus offering a glimpse into the genomic landscapes of individual melanocytes from human skin. As expected, sun-shielded melanocytes had fewer mutations than sun-exposed melanocytes. However, melanocytes from chronically sun-exposed skin (for example, the face) had a lower mutation burden than melanocytes from intermittently sun-exposed skin (for example, the back). Melanocytes located adjacent to a skin cancer had higher mutation burdens than melanocytes from donors without skin cancer, implying that the mutation burden of normal skin can be used to measure cumulative sun damage and risk of skin cancer. Moreover, melanocytes from healthy skin commonly contained pathogenic mutations, although these mutations tended to be weakly oncogenic, probably explaining why they did not give rise to discernible lesions. Phylogenetic analyses identified groups of related melanocytes, suggesting that melanocytes spread throughout skin as fields of clonally related cells that are invisible to the naked eye. Overall, our results uncover the genomic landscapes of individual melanocytes, providing key insights into the causes and origins of melanoma.


Conflict of interest statement

Competing Interests Declaration

STA is an employee at Rakuten Medical and a consultant for Castle Biosciences and Enspectra Health.

Figures

Extended Data Figure 1 |
Extended Data Figure 1 |. Establishing the ethnicity of donors and identity of cells in this study.
a, Admixture analysis of donors included in this study alongside participants from the 1000 Genomes Project. Donors in our study were genotypically most similar to European participants from the 1000 Genomes Project. EUR- European (TSI-Toscani in Italia, IBS - Iberian Population in Spain, GBR - British in England and Scotland, CEU - Utah Residents with Northern and Western European Ancestry, FIN - Finnish in Finland), AFR - African, AMR - Latin American, SAS - South Asian, and EAS - East Asian. b, Differential expression analysis comparing cells that were morphologically predicted to be keratinocytes, melanocytes, or fibroblasts (see Fig. 1B for more details). The top 20 differentially expressed genes for each group are shown along with gene ontology terms with significant overlap. c, Cells with melanocyte morphology express higher levels of known melanocyte markers. Bar plots showing gene expression levels of MLANA, TYR, PMEL, and S100B, colored as indicated. A value of 1 is equivalent to the medium FPKM value for that gene across cells. Each quartet of bars corresponds to an individual clone, and clones are rank ordered by their medium normalized gene expression values for these 4 genes. The zoomed inset portrays the 5 melanocyte clones with lowest expression levels of melanocyte markers adjacent to the fibroblast and keratinocyte clones.
Extended Data Figure 2 |
Extended Data Figure 2 |. Detection of somatic mutations in small clones of skin cells with high specificity and sensitivity.
a, Allelic dropout declines rapidly as a function of clone size. Each data point represents the percent of germline SNP alleles that could not be detected for a given clone as a function of the number of cells within the clone. b, Establishing a variant allele fraction (VAF) cut-off to infer somatic mutations within a clone. The left panel depicts the VAFs for known somatic mutations and known amplification artifacts from a single clone. The right panel depicts a ROC curve, showing the VAF at which sensitivity and specificity of somatic mutation calls would be maximized when inferring the mutational status of variants based on VAF alone. Variants that fell within expressed or phase-able portions of the genome were classified as mutations or artifacts as described (see Fig. 1c, d). The remaining variants were inferred based on the VAF cut-off, which maximized sensitivity and specificity of somatic mutation calls. c-d, The specificity (panel c), and sensitivity (panel d), of inferred somatic mutations as a function of clone size. The mean specificity and sensitivity of inferred somatic mutations was respectively 98.83% and 98.60% for all clones of at least 5 cells. All trendlines correspond to a moving average.
Extended Data Figure 3 |
Extended Data Figure 3 |. Contexts of single-base substitutions corroborate the quality of somatic mutation calls.
| a, The proportion of somatic mutations identified in chronically sun-exposed, intermittently sun-exposed, and sun-shielded skin that belong to each of the 96 trinucleotide substitution contexts. Note the similarity to signature 7 (shown for reference in panel c), albeit to a lesser extent in sun-shielded skin cells. b, Tri-nucleotide contexts of variants from sun-exposed skin validated to be somatic mutations by RNA-seq or phasing as well as variants inferred to be somatic mutations by their variant allele frequency (VAF). Note the similarity to signature 7. The tri-nucleotide contexts of remaining variants (assumed to be amplification artifacts) are also shown. c, Predefined mutation signatures shown for reference; Signature 7 (associated with UV-radiation-induced DNA damage), and SBS scE and SBS scF, which are associated with single-cell whole genome amplification artifacts.
Extended Data Figure 4 |
Extended Data Figure 4 |. Median mutation burden of melanocytes from different anatomic sites.
Mutation burden of melanocytes from physiologically normal skin of six donors across different anatomic sites with varied sun exposure that are rank ordered by median mutation burden (line) within each site. (BCC = Basal Cell Carcinoma, Mel = Melanoma)
Extended Data Figure 5 |
Extended Data Figure 5 |. Differential expression analysis revealing genes significantly correlating with mutation burden.
a-c, Gene expression versus normalised mutation burden is shown for two top correlative genes (HLA-DPA1 and MDM2) and one (CLEC2B) anti-correlative gene of interest from Supplementary Table 4. Clones included in this analysis are from anatomic sites with greater than 3 standard deviations of mutation burdens among their cells, thus demonstrating a range of mutation burdens. The plotted blue line represents a linear model fit to the data with 95% confidence intervals for that model prediction shown in grey.
Extended Data Figure 6 |
Extended Data Figure 6 |. Copy number landscape of melanocytes from normal human skin.
Copy number was inferred, as described, and segments (regions of equal copy number) are depicted, here, denoting gains (red) and losses (blue) for each melanocyte (rows). Note that copy number alterations over autosomes were rare, whilst the loss of one sex chromosome is a common occurrence. All X chromosome deletions in females affect the inactive X (see Supplementary Table 5).
Extended Data Figure 7 |
Extended Data Figure 7 |. Fields of related melanocytes exist within the skin.
Phylogenetic trees in which each branch corresponds to an individual cell. Mutations that are shared between cells comprise the trunk of each tree and private mutations in each cell form the branches. Trunk and branch lengths are scaled equivalently within each tree but not across trees. The proportion of mutations that can be attributed to ultraviolet radiation (CC>TT or (C/T)C>T) is annotated in the bar charts on each tree trunk or branch.
Extended Data Figure 8 |
Extended Data Figure 8 |. Melanocytes accumulate few mutations in tissue culture.
a, We sequenced a bulk culture of neonatal melanocytes to establish the germline SNPs and somatic mutations in the dominant clones. We continued to passage the cell line for 239 days, genotyping individual clones at the timepoints indicated to establish the rate at which mutations were acquired in culture. In parallel, Petljak et al performed similar experiments on common cancer cell lines, and we analysed their data from a melanoma cell line (Mewo) included in their study. b, On average, the mutation burden of neonatal melanocytes and Mewo cells respectively increased by 0.090 and 0.086 mutations/Mb for every 2 weeks in tissue culture (we typically cultured melanocytes 2 weeks or less in this study). To put these mutation burdens in perspective, the average mutation burdens of sun-exposed and sun-shielded melanocytes from this study are shown in comparison. Based on these results, we conclude that the brief period of tissue culture contributed little towards the mutation burdens observed in our study.
Figure 1 |
Figure 1 |. A workflow to genotype individual skin cells.
a, Examples of healthy skin from which we genotyped individual cells. Left panel: skin from the back of a cadaver. Right panel: skin surrounding a basal cell carcinoma. b, Expression profiles classify the cells that we genotyped into their respective lineages. Each cell is depicted in a t-SNE plot and colored by their morphology. A subset of 5 cells was engineered (see methods) and depicted as triangles. See Extended Data Fig. 1b–c for further details on cell identity. c-d, Patterns to distinguish true mutations from amplification artifacts. c, Mutations in expressed genes are evident in both DNA- and RNA- sequencing data, whereas amplification artifacts are not. d, Germline polymorphisms, distinguished here as “A” and “B” alleles, are in linkage with somatic mutations but not amplification artifacts. e, Variant allele fractions from an example cell indicate how we inferred the mutational status of variants outside of the expressed and phase-able portions of the genome. Variants that were validated as somatic mutations had variant allele fractions (VAFs) around 1 or 0.5, and variants that were invalidated had lower VAFs; however, PCR biases sometimes skewed these allele fractions. Variants that could not be directly validated or invalidated were inferred by their VAF (see methods for details). The dotted line indicates the optimal VAF cut-off to distinguish somatic mutations from amplification artifacts for this particular cell’s variants (see Extended Data Fig. 2b for more details). f, Copy number was inferred from DNA- and RNA- sequencing depth as well as from allelic imbalance -- an example of a cell with a gain over chr. 5q, loss of chr. 9, and loss of chr. X is shown.
Figure 2 |
Figure 2 |. The genomic landscape of individual melanocytes from physiologically normal human skin.
a, Top panel: Mutation burden of melanocytes from physiologically normal skin of six donors across different anatomic sites (BCC = Basal Cell Carcinoma, Mel = Melanoma). Middle panel: Number of copy number alterations identified within each melanocyte. Lower panel: The proportion of each cell’s mutations that are attributable to established mutational signatures. Each bar represents one cell (n=1). Error bars represent 95% confidence intervals determined by two-sided Poisson test. Hashed bars indicate that there were too few mutations for signature analysis. Asterisks denote samples that only underwent targeted DNA-sequencing. Crosses denote CDKN2A-engineered cells. b, Comparisons between mutation burden of chronically sun-exposed (n=24), intermittently sun-exposed (n=105), and sun-shielded sites (n=4). An ANOVA, comparing the results of linear mixed-effect models both including and excluding sun exposure to account for repeated donor measurements, presented a p-value of 4.43x10⁻⁴ demonstrating that sun exposure has a significant effect on mutation burden. Pairwise p-values from linear mixed-effects model are also shown (LMER p-values). Each box plot shows the 25th and 75th percentile of mutation burdens, where the midline is the data median and outliers are represented as dots. c, Mutation burden of site-matched melanocytes adjacent to cancer versus not adjacent to cancer. Melanoma mutation burdens from TCGA are shown as a reference. The median is denoted by a grey line. d, Mutation burden of melanocytes as compared to an adjacent melanoma. Each bar represents one cell (n=1). Error bars represent 95% confidence intervals calculated using a two-sided Poisson test.
Figure 3 |
Figure 3 |. Distinct trajectories of melanoma evolution.
Based on the data shown here and in conjunction with previous genetic, clinical, and histopathologic observations, we propose that melanomas can evolve via distinct trajectories, depending upon the order in which mutations occur. MAPK = Mitogen-Activated Protein-Kinase.
Figure 4 |
Figure 4 |. Fields of related melanocytes identified in normal human skin.
Phylogenetic trees in which each branch corresponds to an individual cell. Mutations that are shared between cells comprise the trunk of each tree and private mutations in each cell form the branches. Trunk and branch lengths are scaled equivalently within each tree but not across trees. The proportion of mutations that can be attributed to ultraviolet radiation (CC>TT or (C/T)C>T) is annotated in the bar charts on each tree trunk or branch. Pathogenic mutations and their location on each tree are indicated in red text. Mel = Melanoma.

Comment in

  • Seeds of cancer in normal skin.
    Martincorena I. Martincorena I. Nature. 2020 Oct;586(7830):504-506. doi: 10.1038/d41586-020-02749-9. Nature. 2020. PMID: 33028991 No abstract available.

References

    1. Gawad C, Koh W, Quake SR. Single-cell genome sequencing: current state of the science. Nat Rev Genet 2016;17(3):175–88. - PubMed
    1. Ziegler A, Jonason AS, Leffell DJ, et al. Sunburn and p53 in the onset of skin cancer. Nature 1994;372(6508):773–6. - PubMed
    1. Jonason AS, Kunala S, Price GJ, et al. Frequent clones of p53-mutated keratinocytes in normal human skin. Proc Natl Acad Sci USA 1996;93(24):14025–9. - PMC - PubMed
    1. Martincorena I, Roshan A, Gerstung M, et al. Tumor evolution. High burden and pervasive positive selection of somatic mutations in normal human skin. Science 2015;348(6237):880–6. - PMC - PubMed
    1. Jaiswal S, Fontanillas P, Flannick J, et al. Age-related clonal hematopoiesis associated with adverse outcomes. N Engl J Med 2014;371(26):2488–98. - PMC - PubMed

Methods references

    1. Zeng H, Jorapur A, Shain AH, et al. Bi-allelic Loss of CDKN2A Initiates Melanoma Invasion via BRN2 Activation. Cancer Cell 2018;34(1):56–68.e9. - PMC - PubMed
    1. Reinius B, Mold JE, Ramsköld D, et al. Analysis of allelic expression patterns in clonal somatic cells by single-cell RNA-seq. Nat Genet 2016;48(11):1430–5. - PMC - PubMed
    1. Pritchard JK, Stephens M, Donnelly P. Inference of population structure using multilocus genotype data. Genetics 2000;155(2):945–59. - PMC - PubMed
    1. Sudmant PH, Rausch T, Gardner EJ, et al. An integrated map of structural variation in 2,504 human genomes. Nature 2015;526(7571):75–81. - PMC - PubMed
    1. Dobin A, Davis CA, Schlesinger F, et al. STAR: ultrafast universal RNA-seq aligner. Bioinformatics 2013;29(1):15–21. - PMC - PubMed

Publication types