. 2020 Nov;587(7835):613-618.
doi: 10.1038/s41586-020-2795-6. Epub 2020 Oct 7.

Microglia-organized scar-free spinal cord repair in neonatal mice

Affiliations

Microglia-organized scar-free spinal cord repair in neonatal mice

Yi Li et al. Nature. 2020 Nov.

Abstract

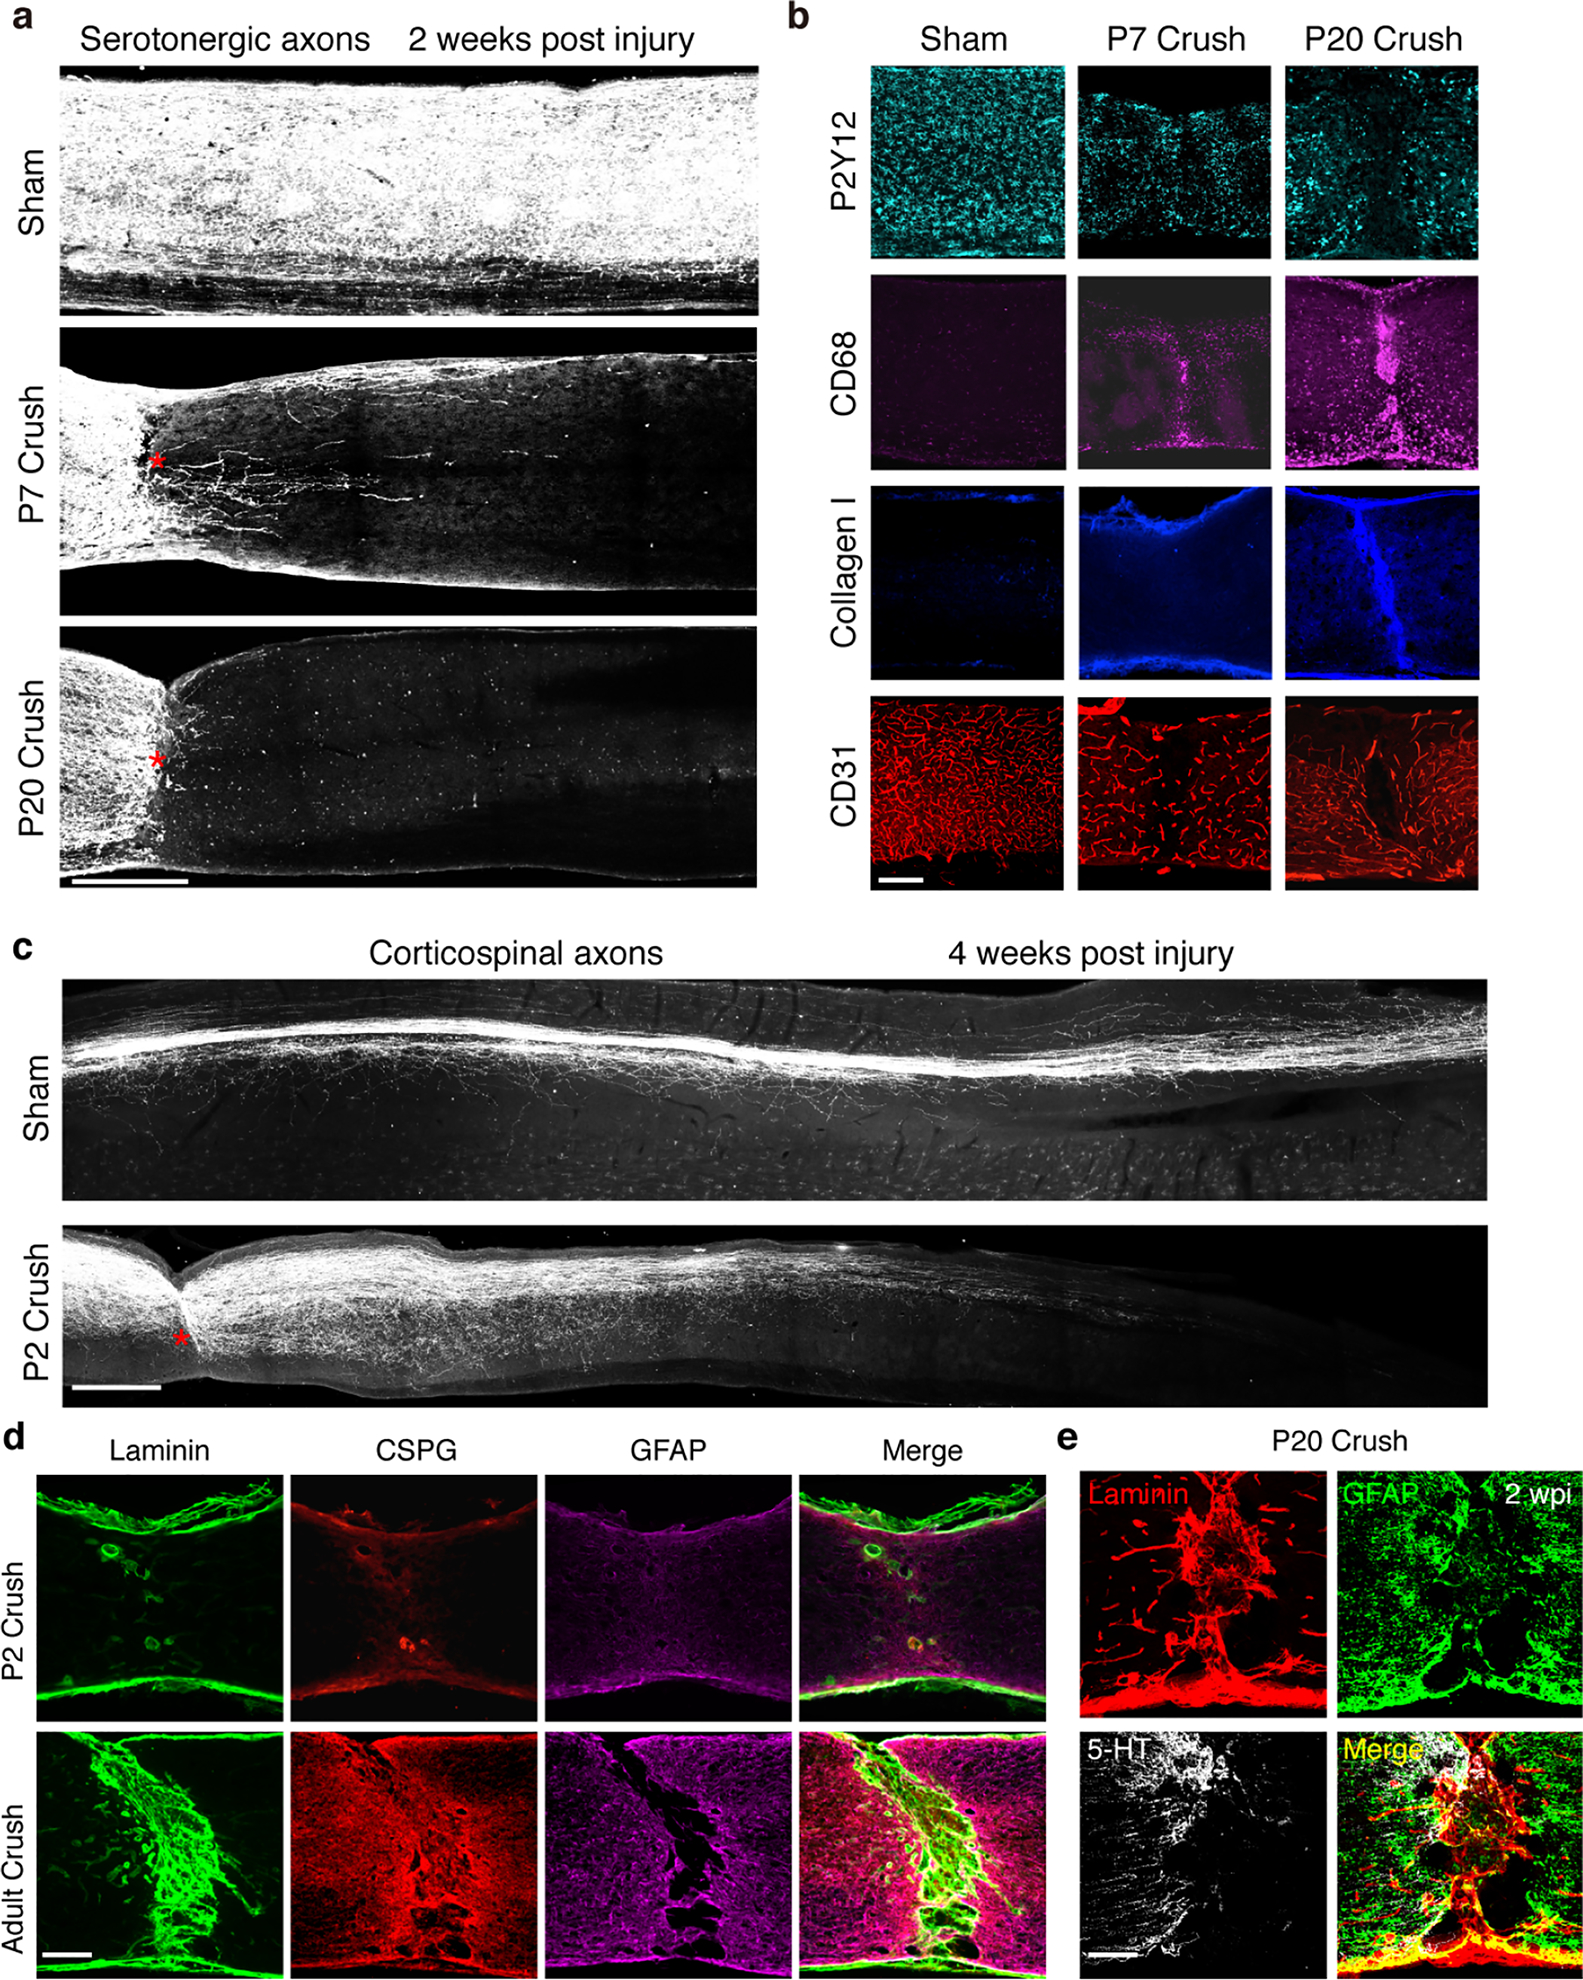
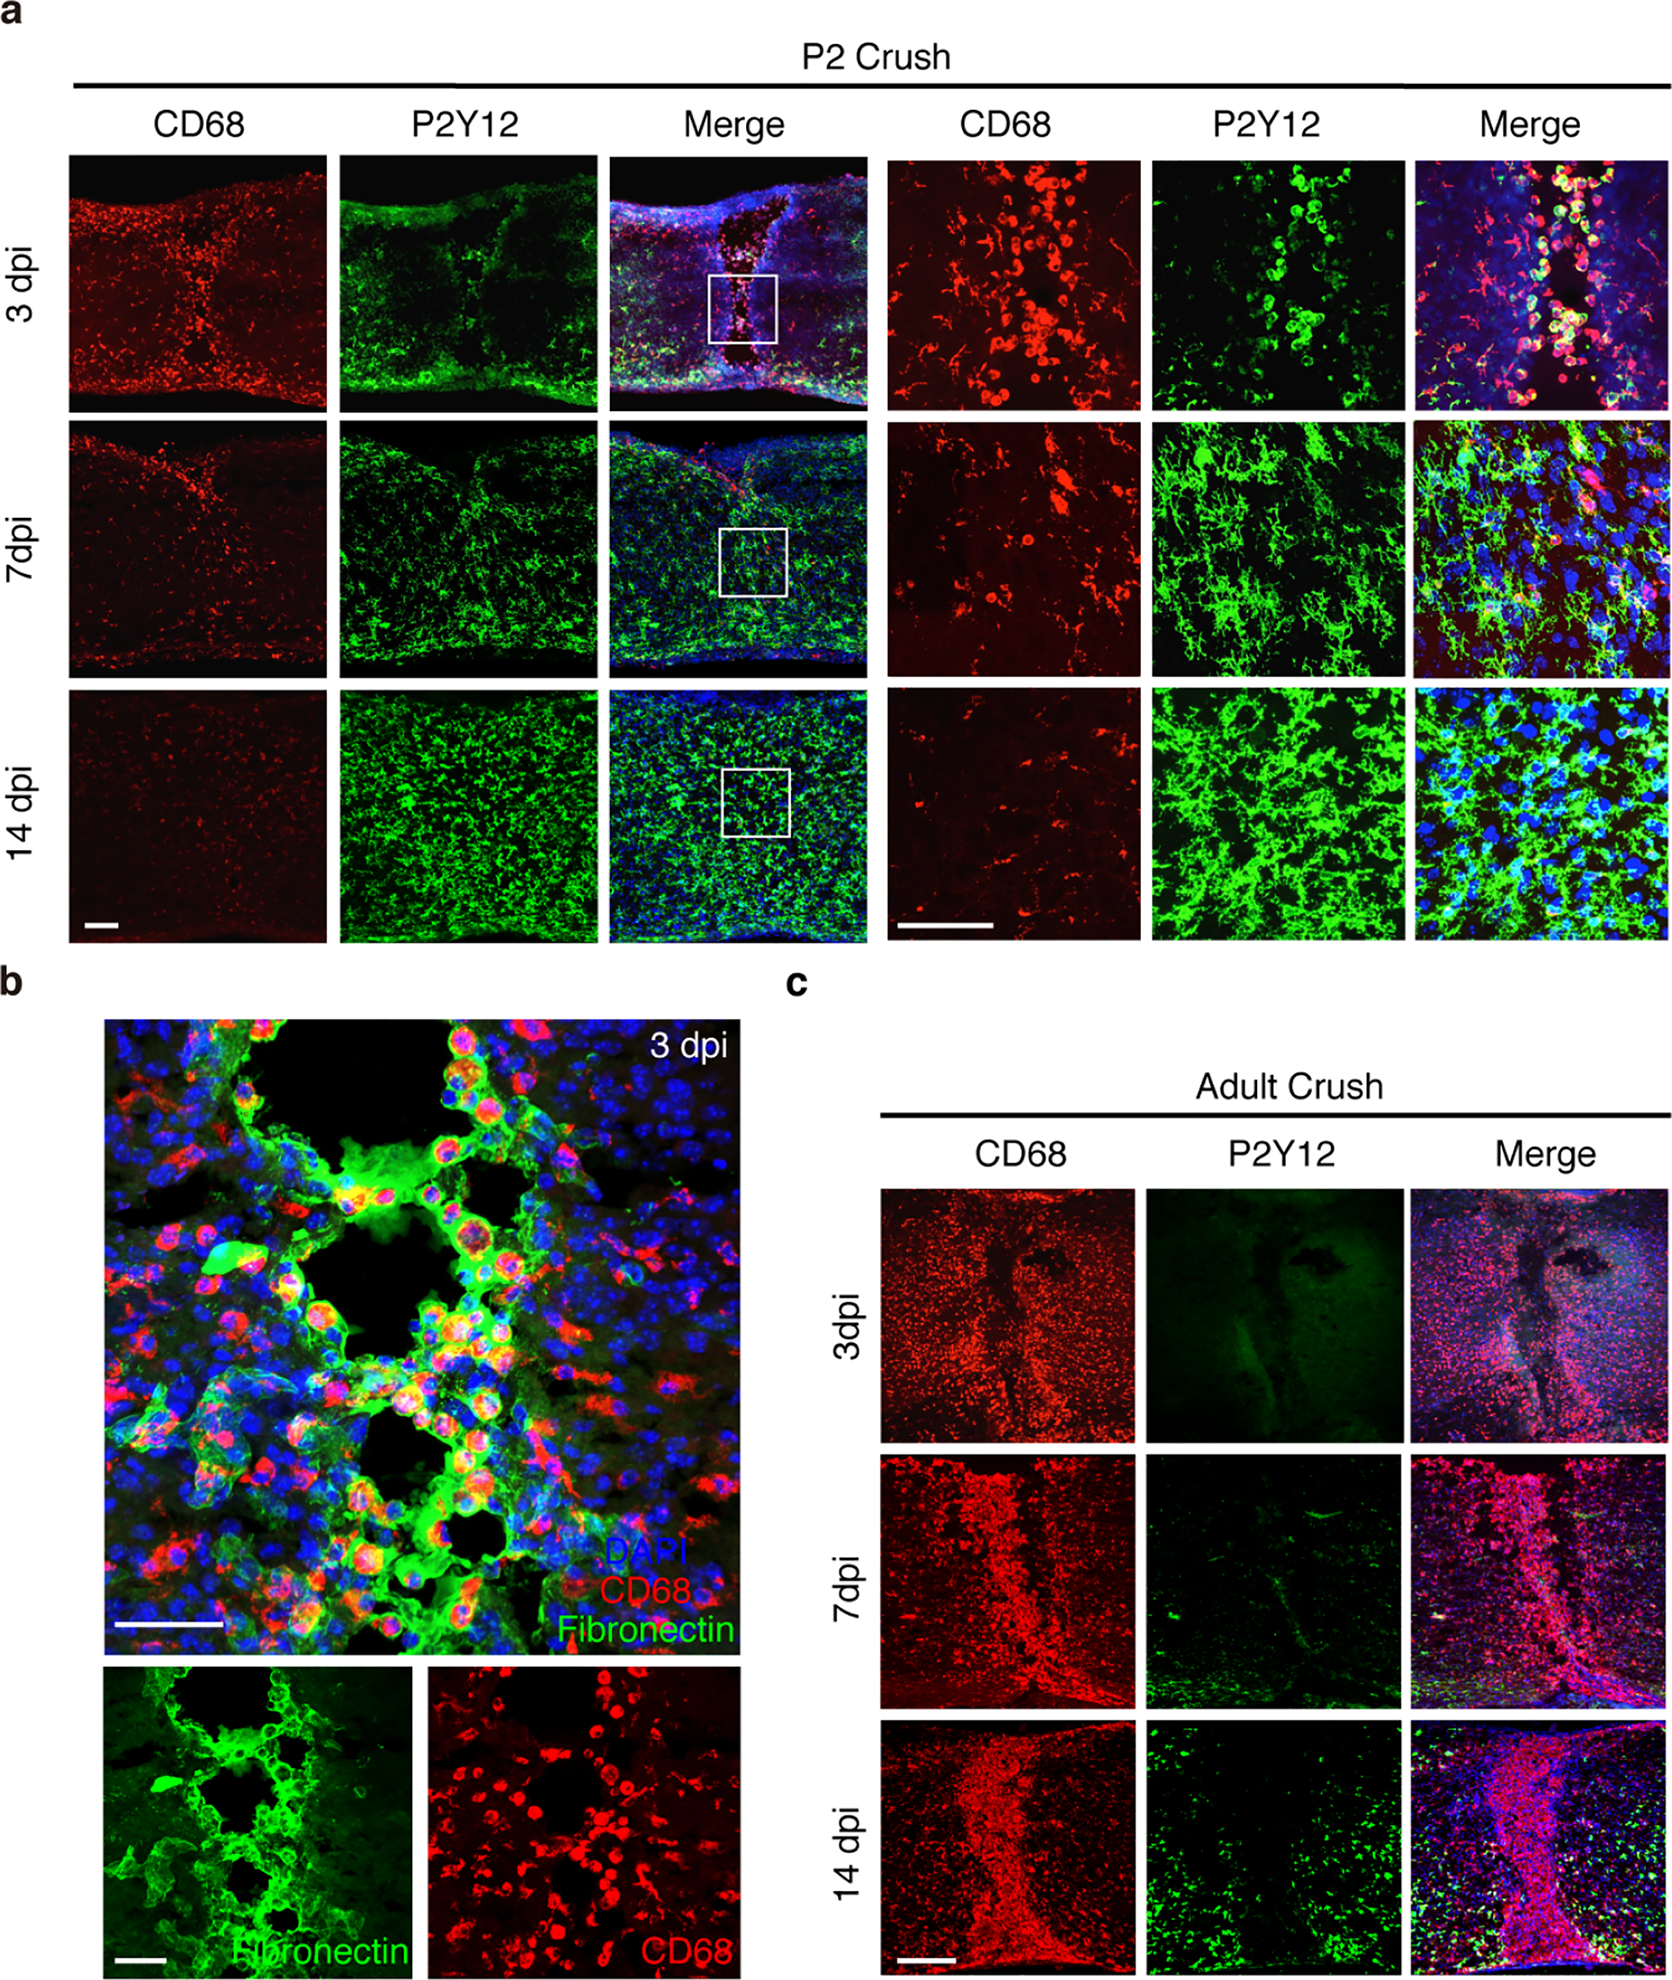
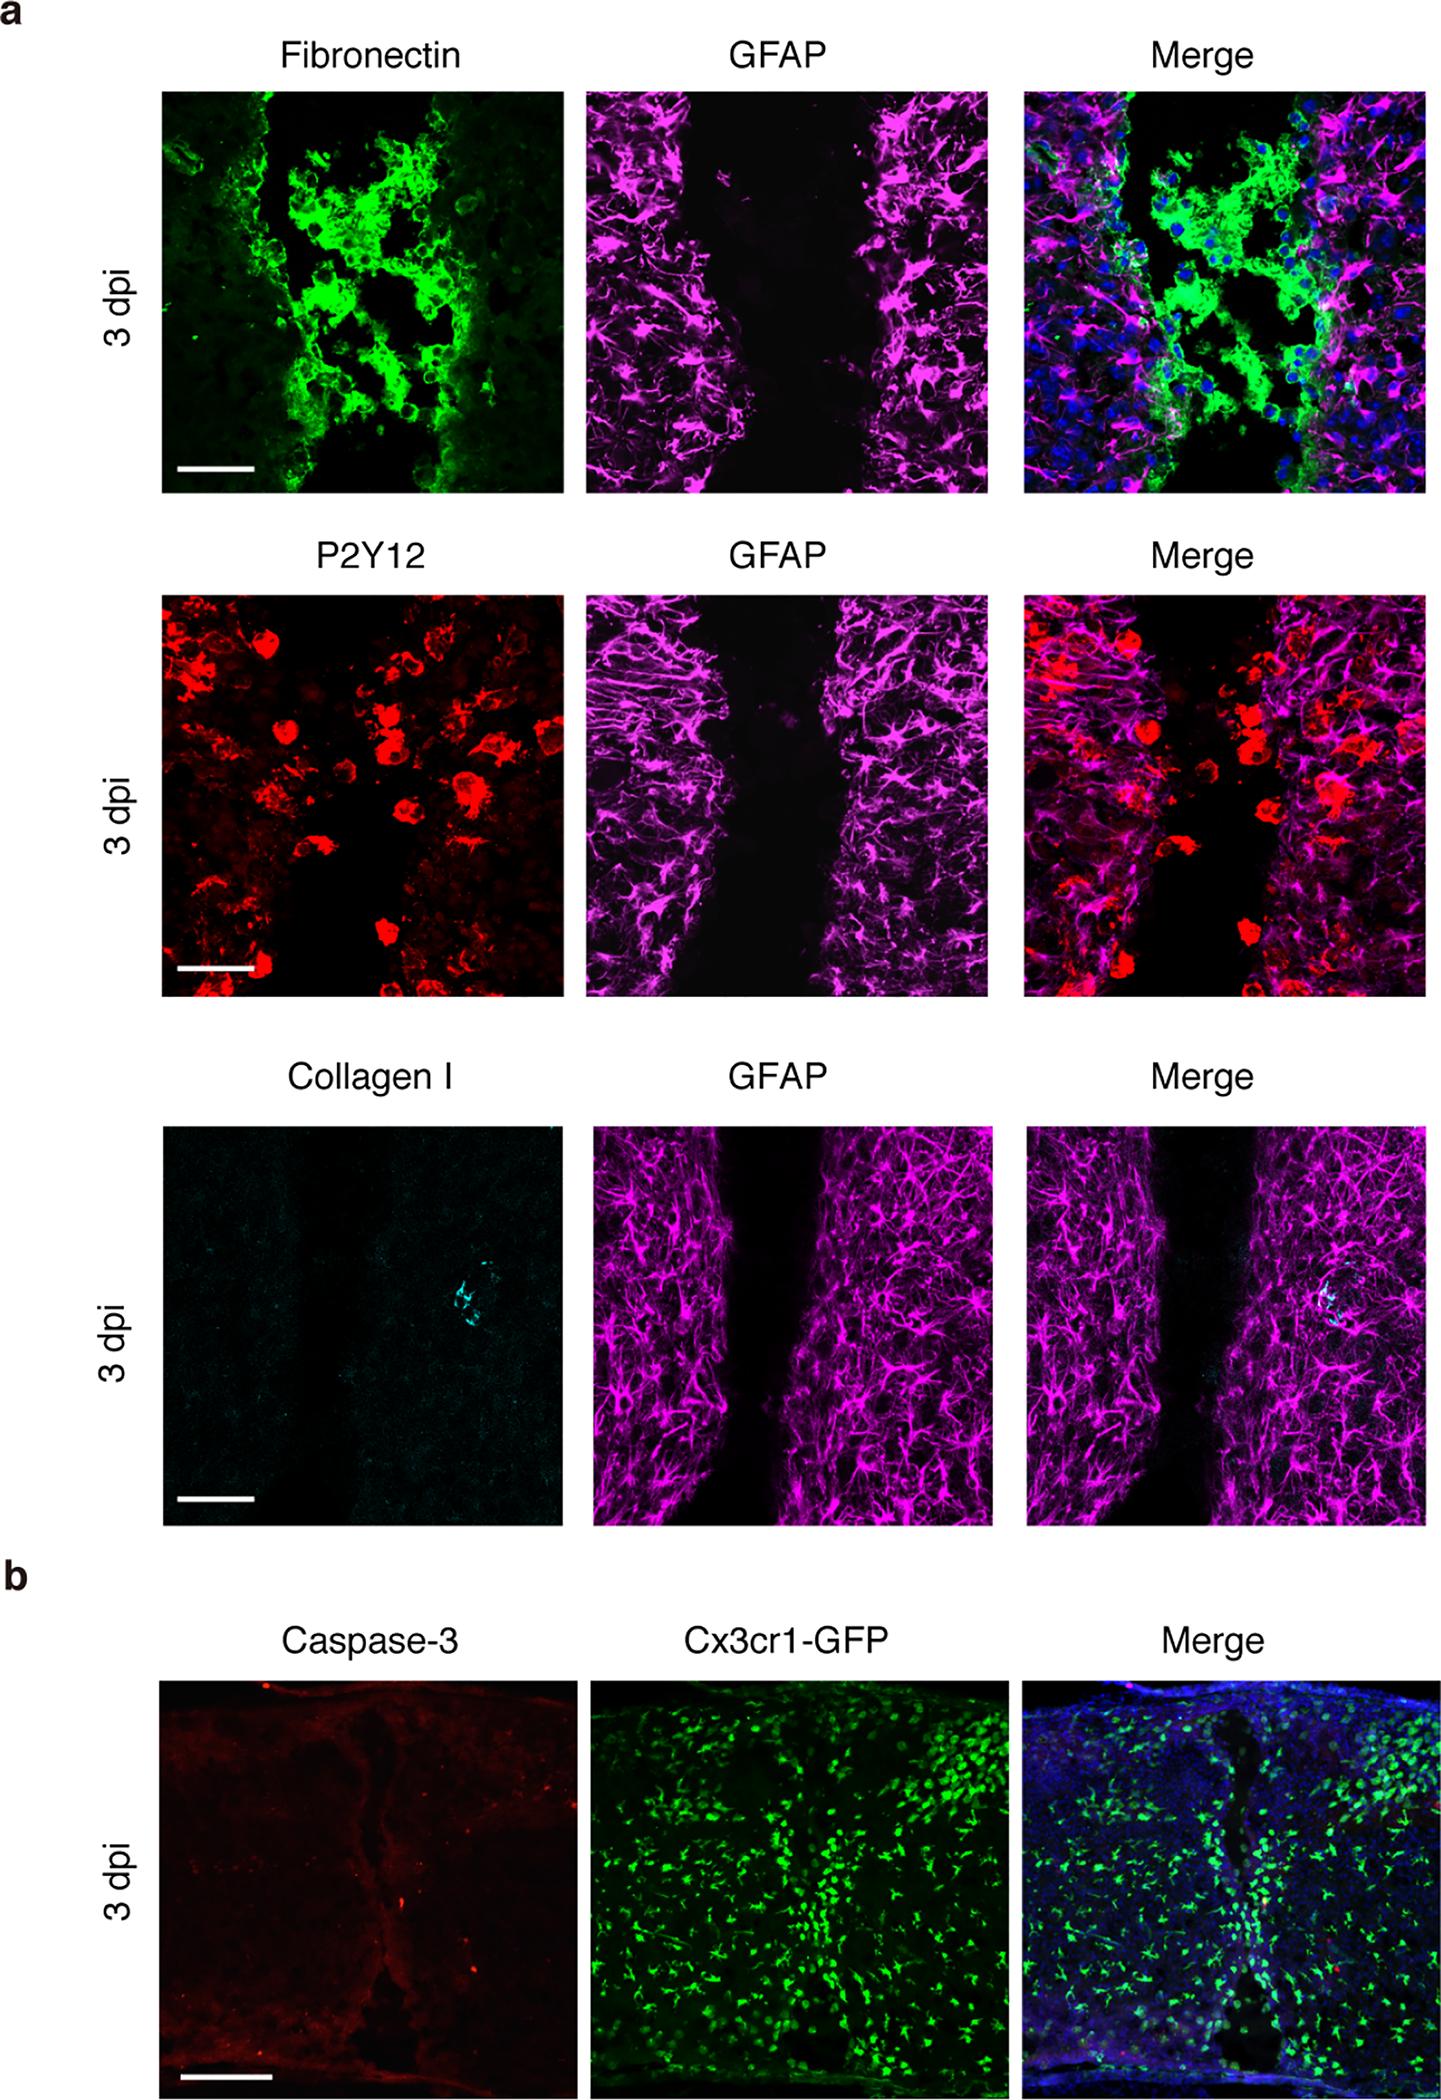
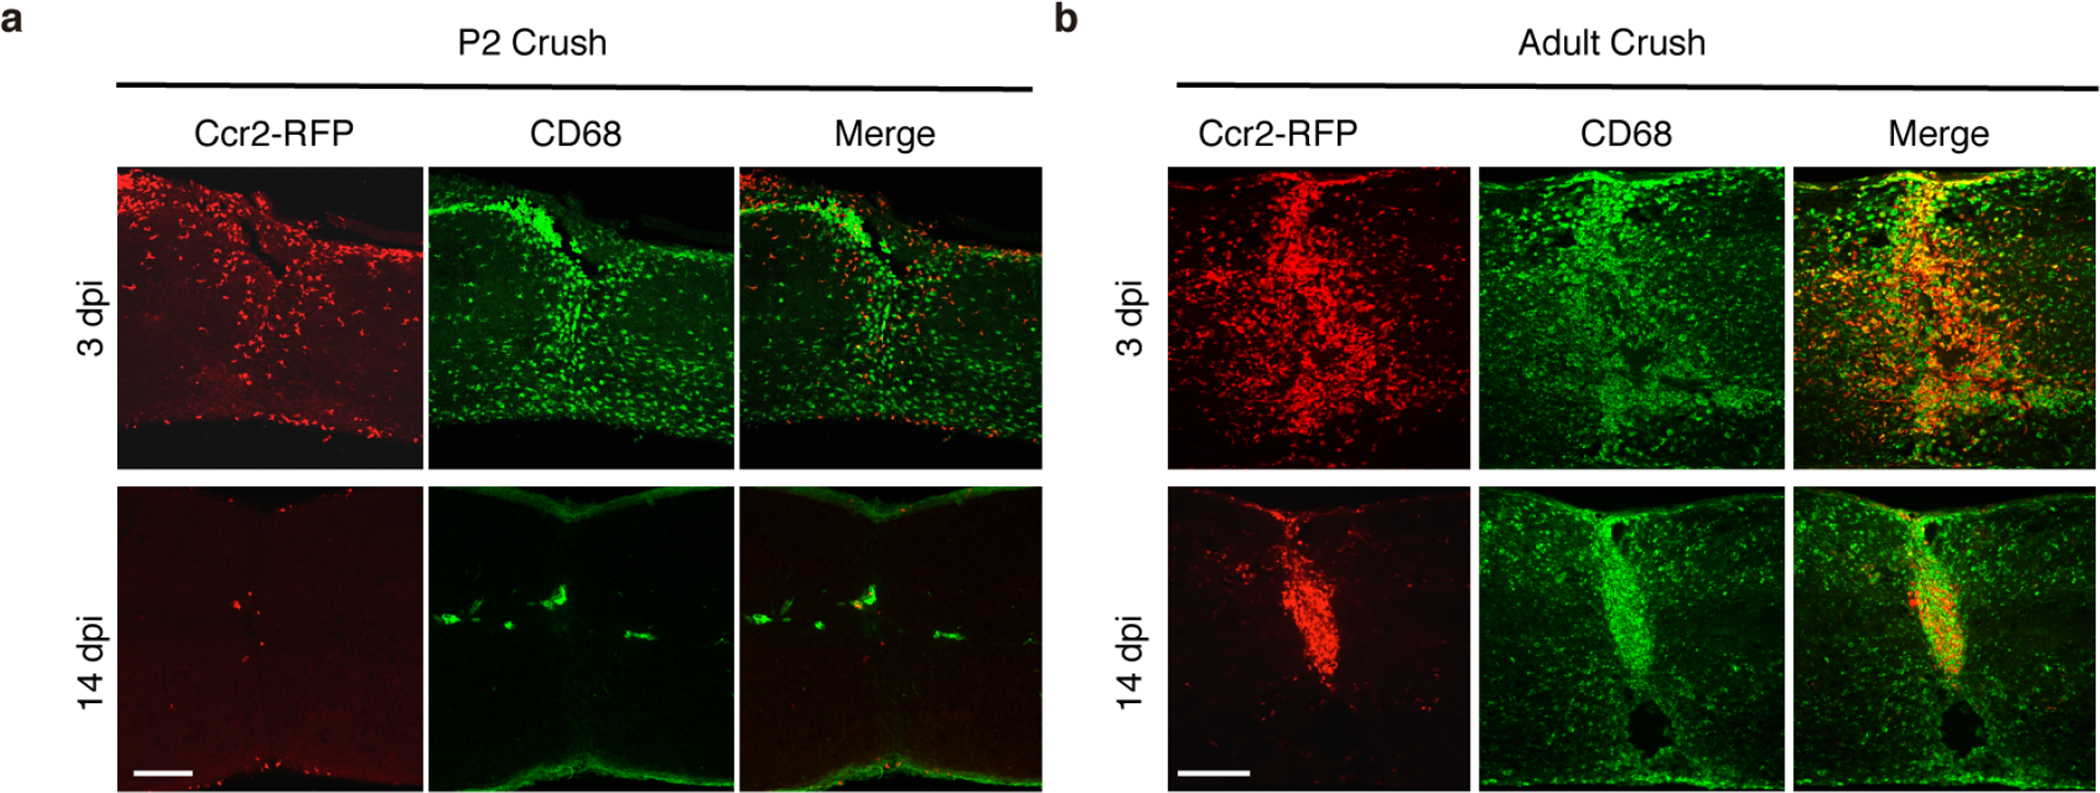
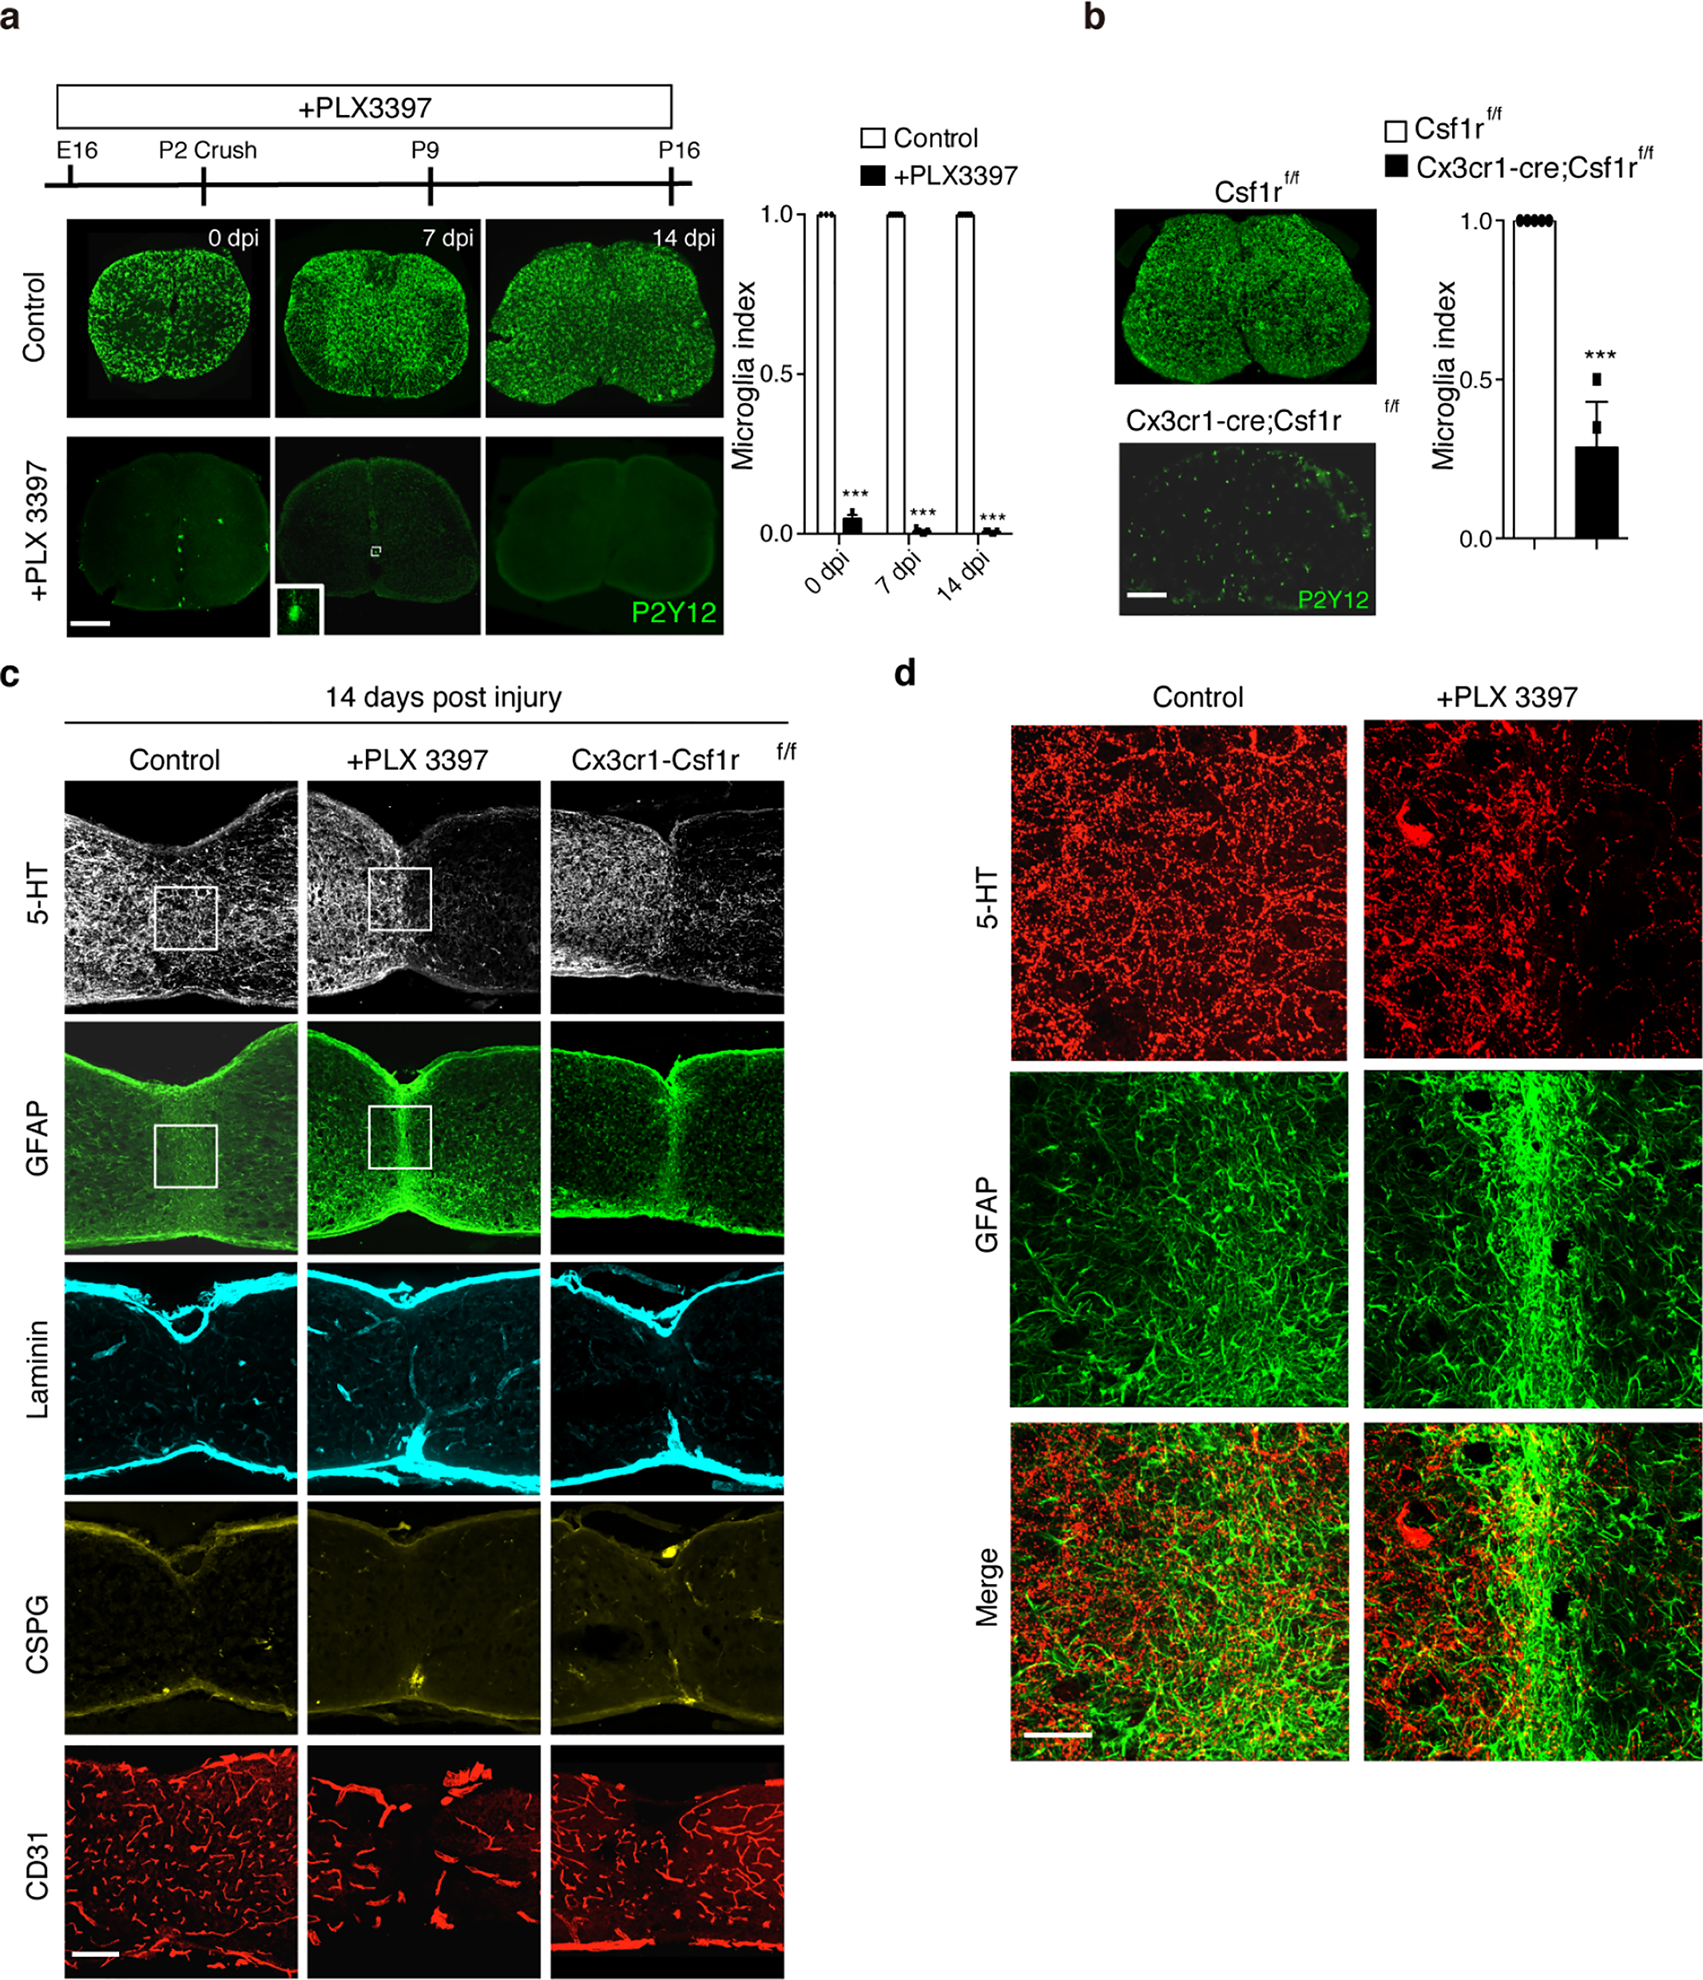
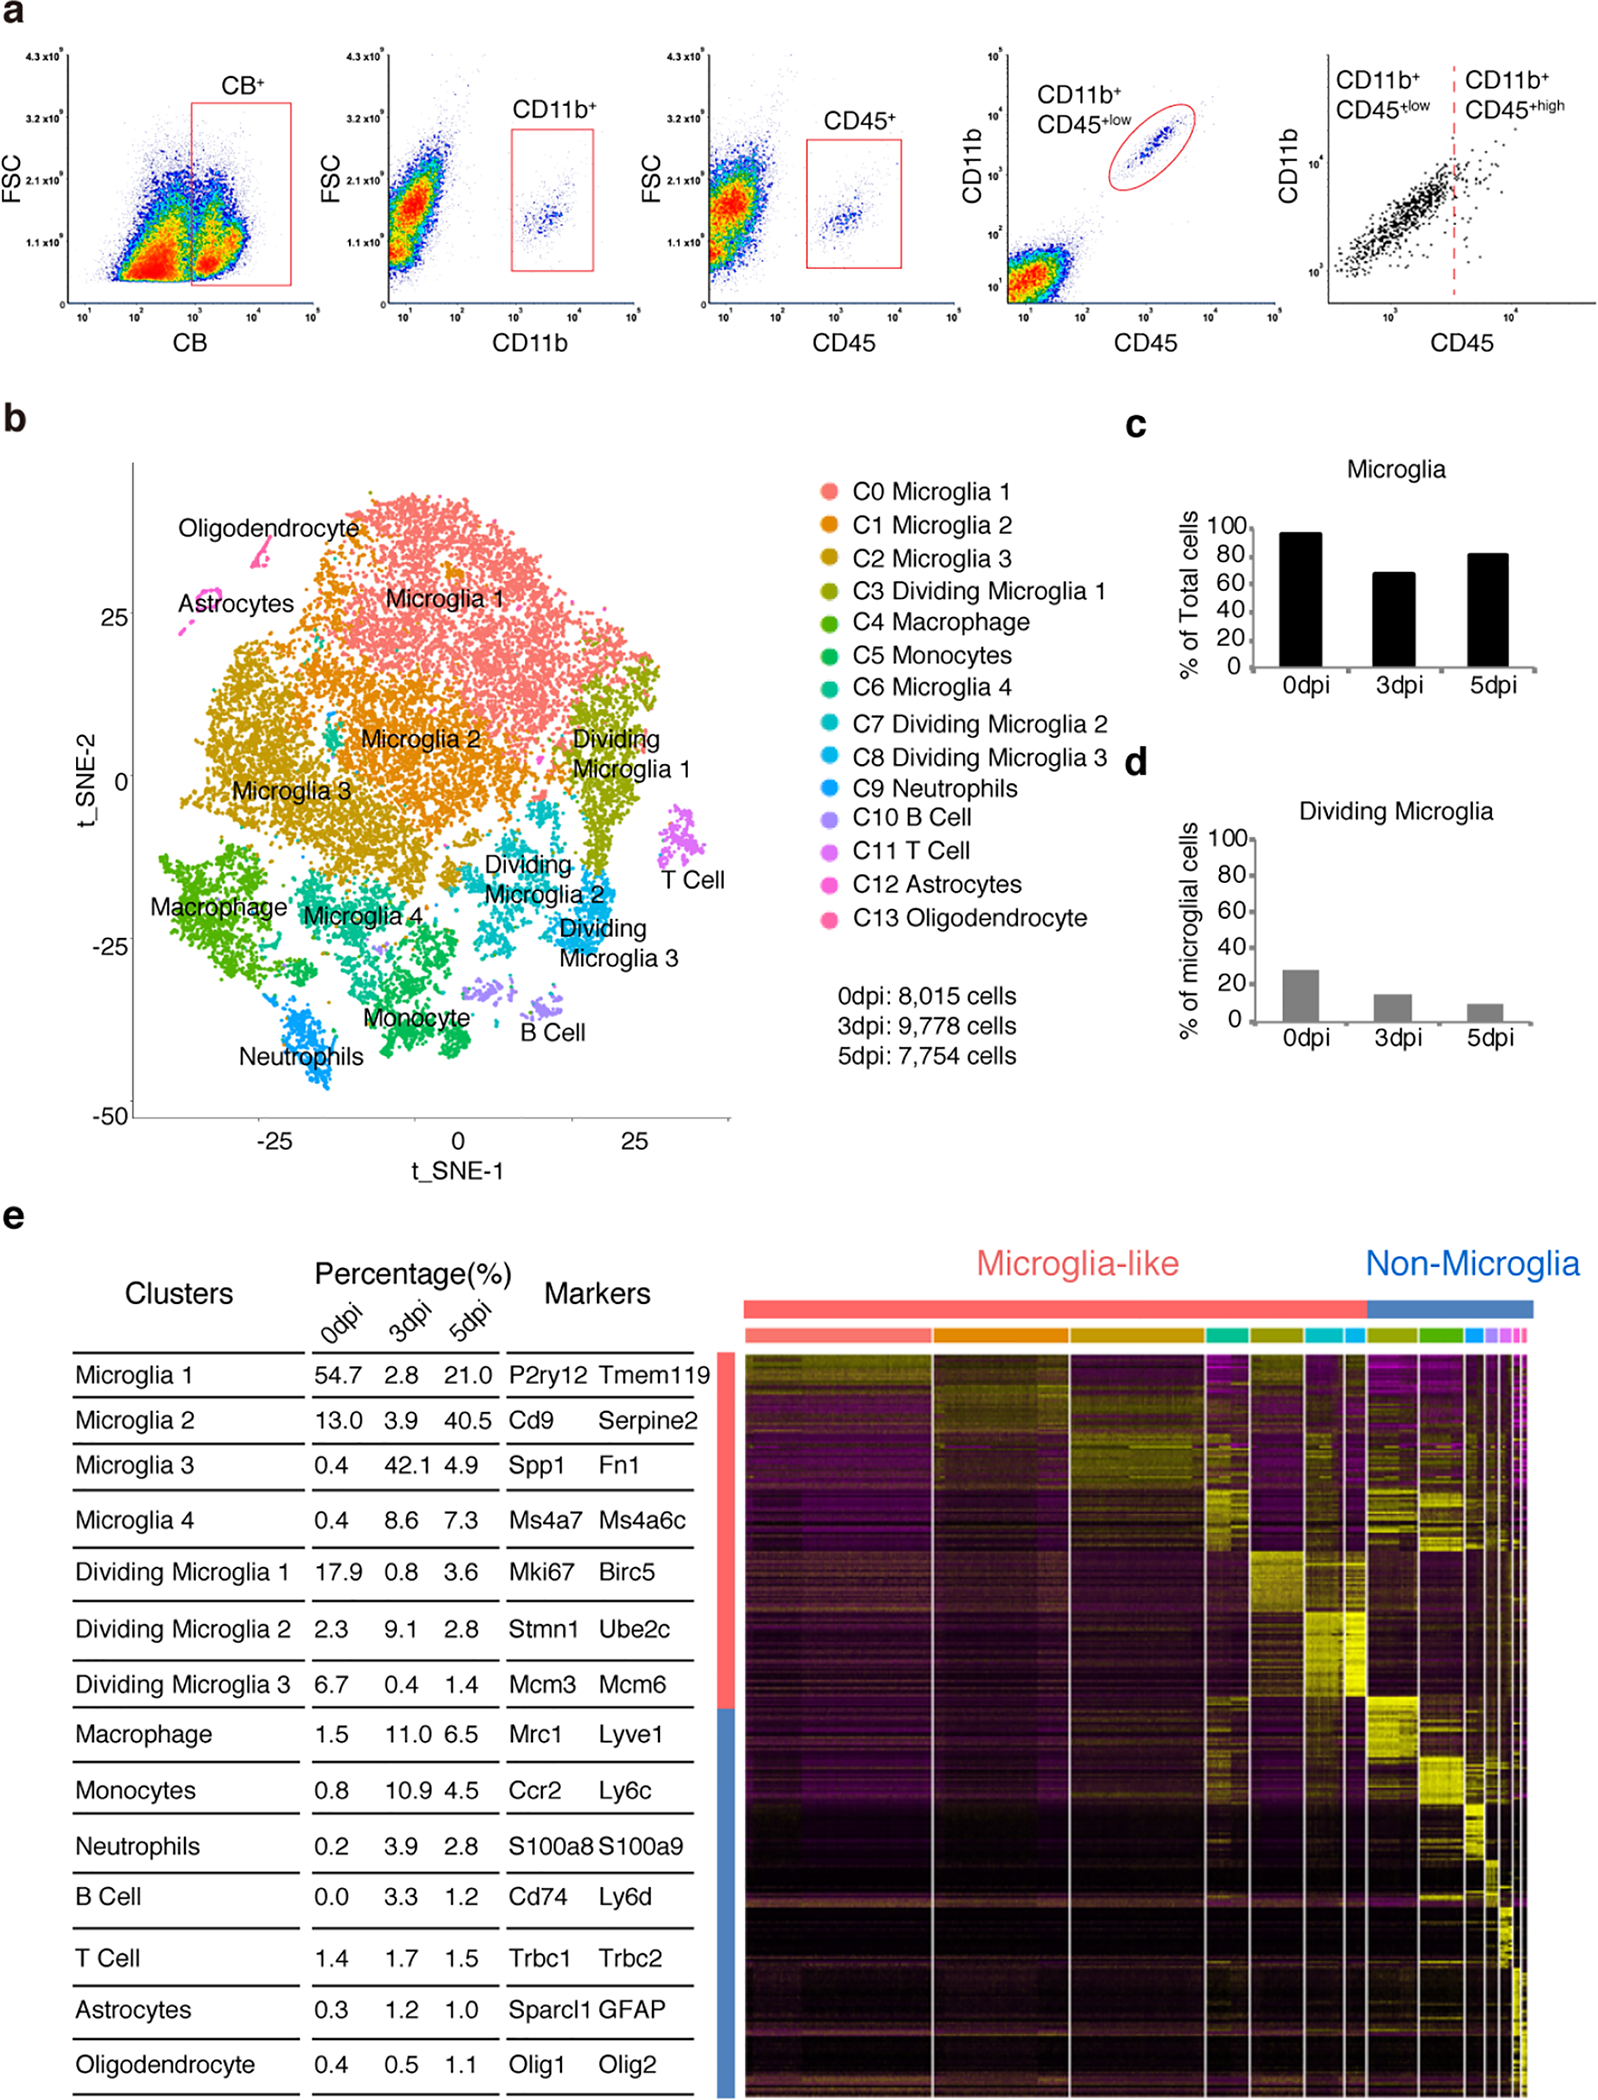
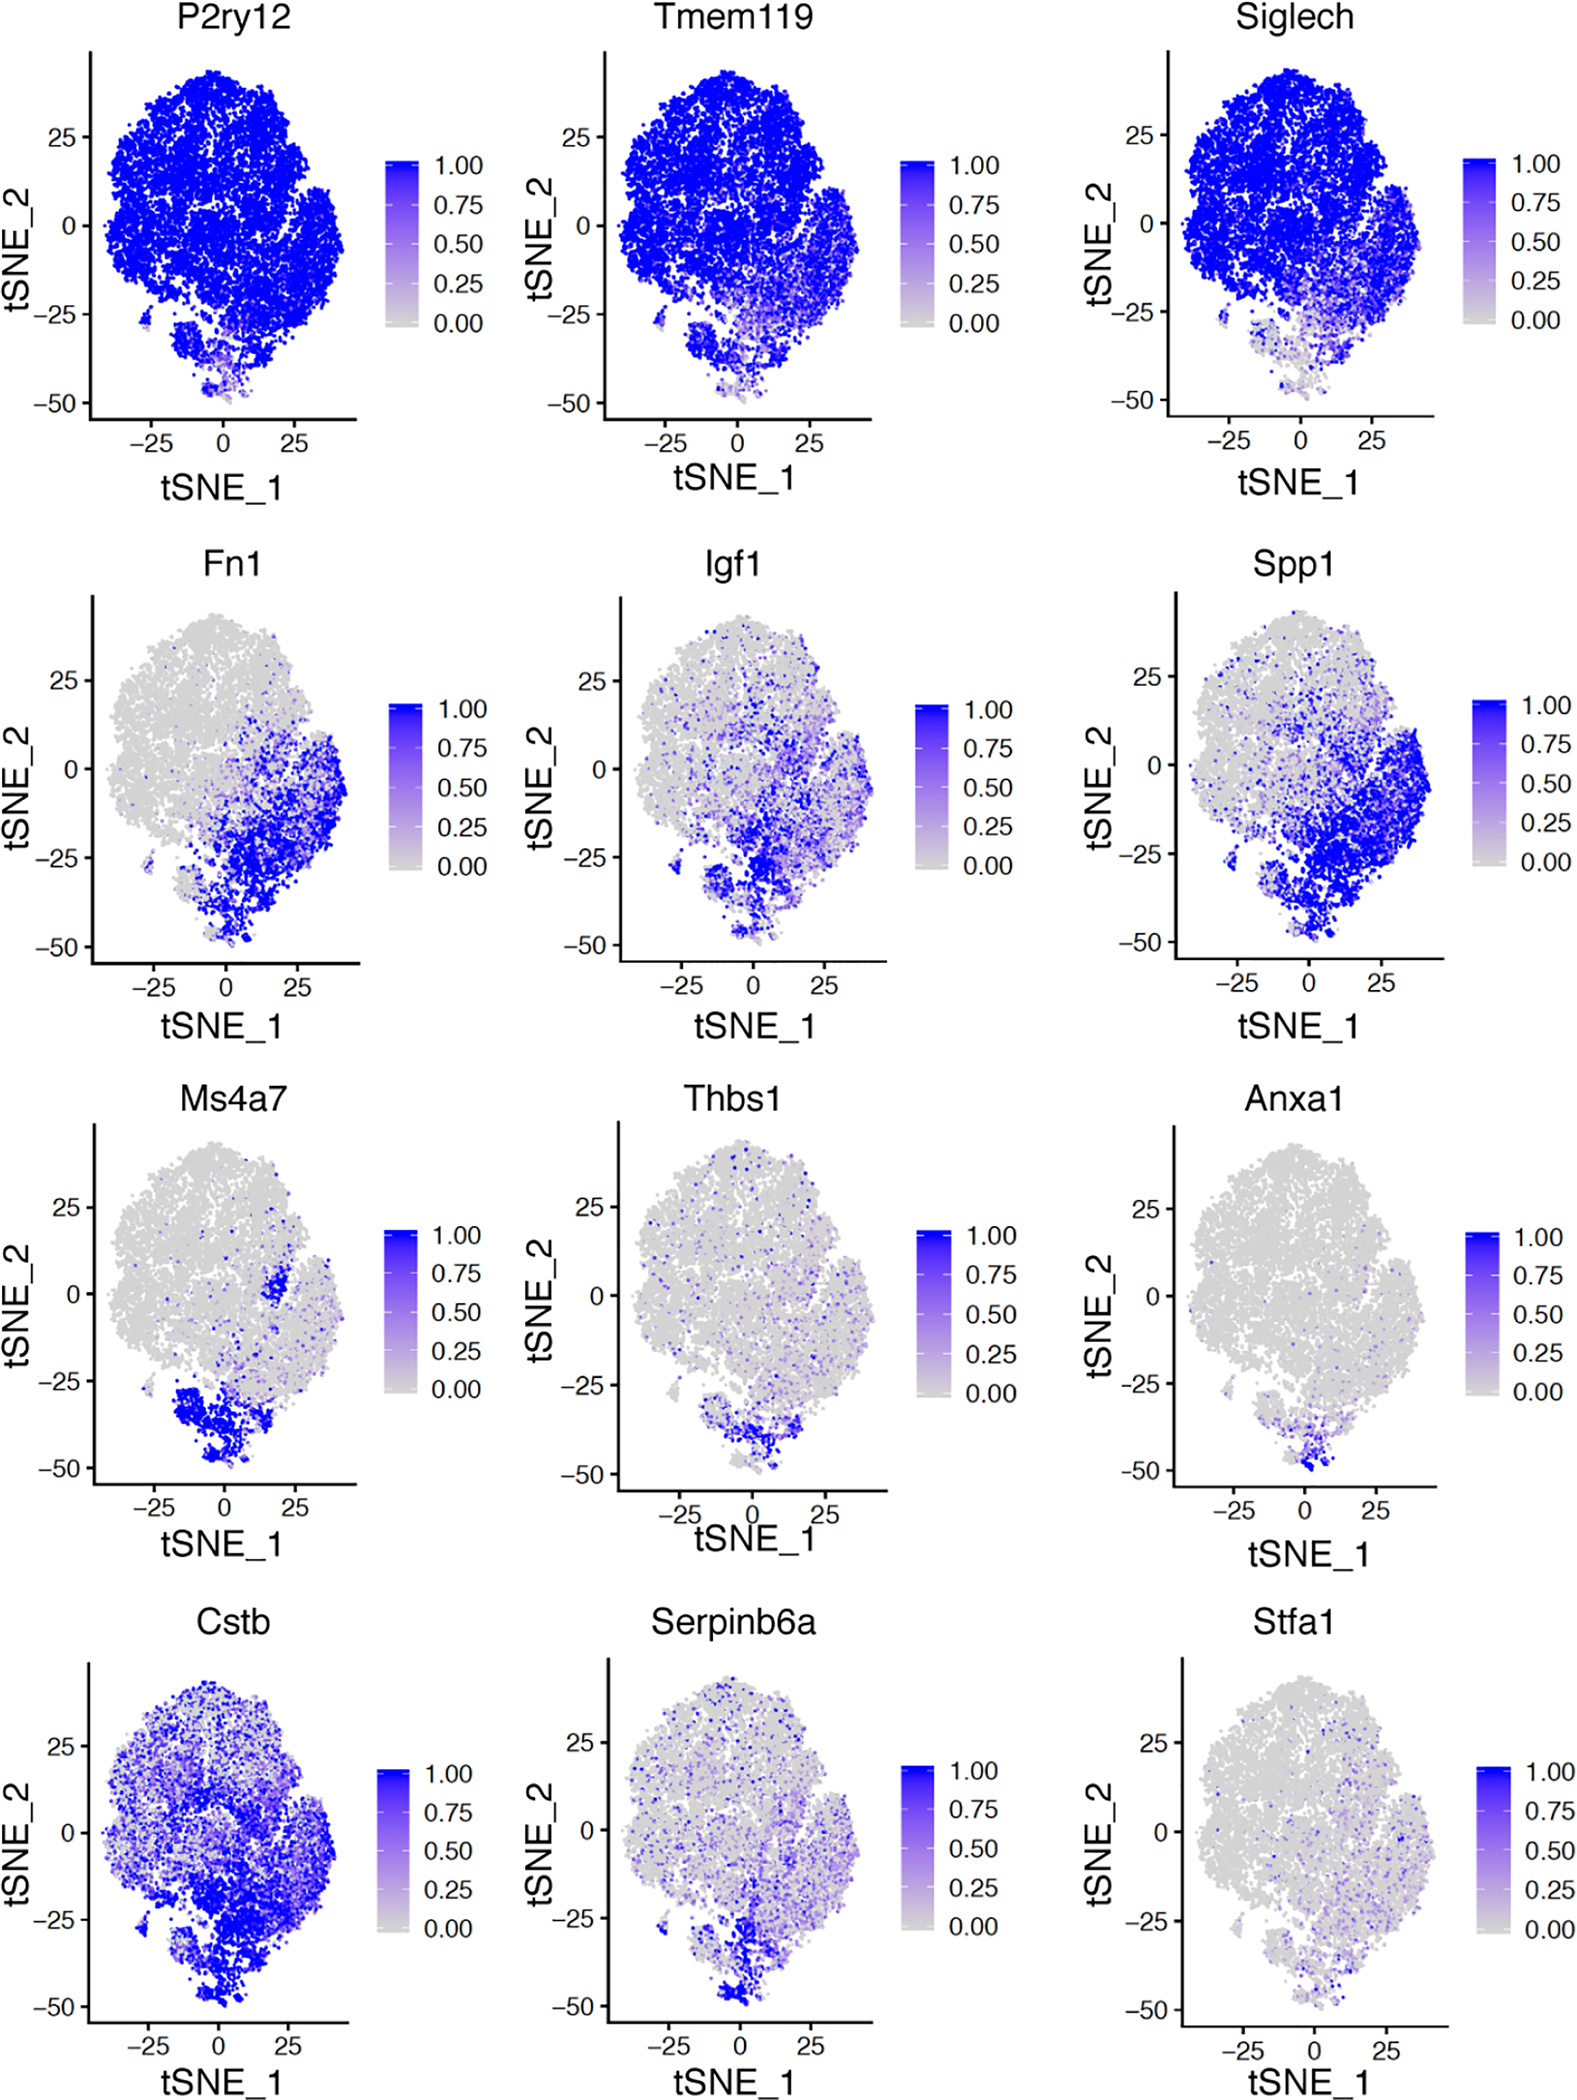
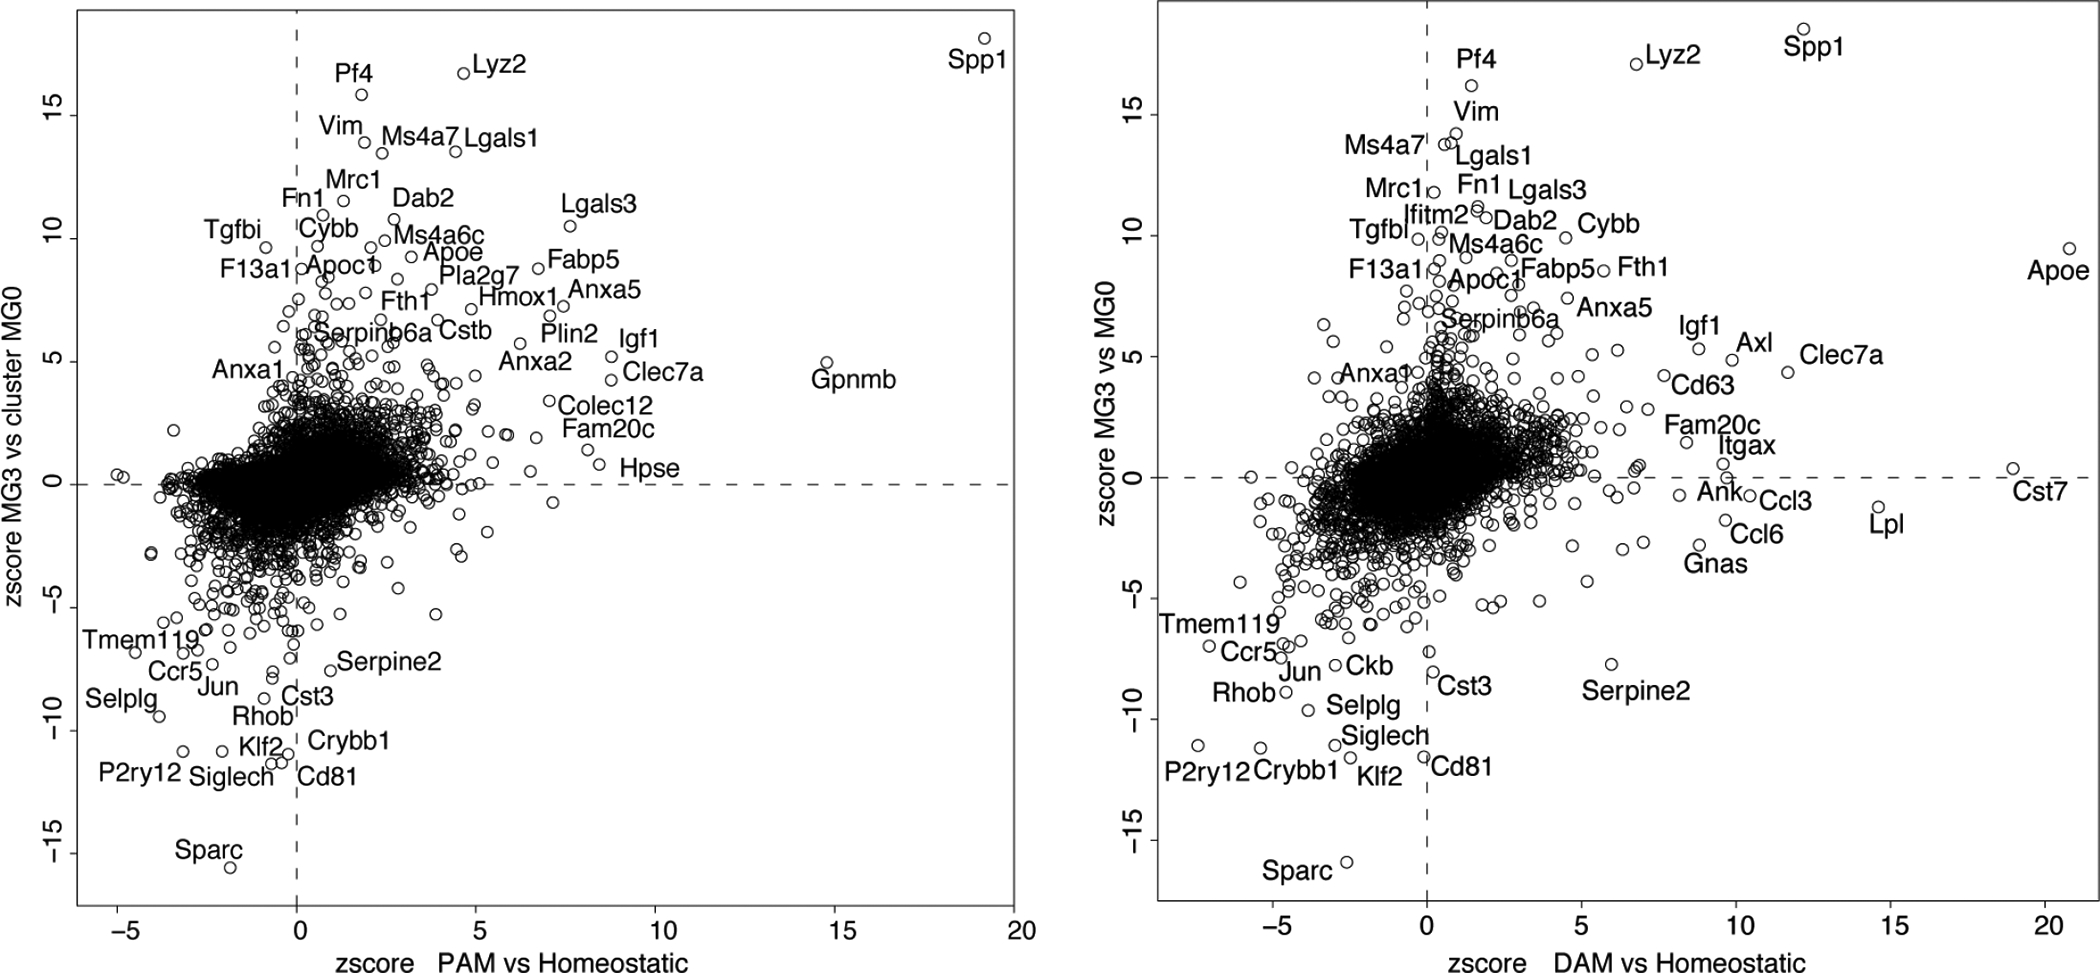
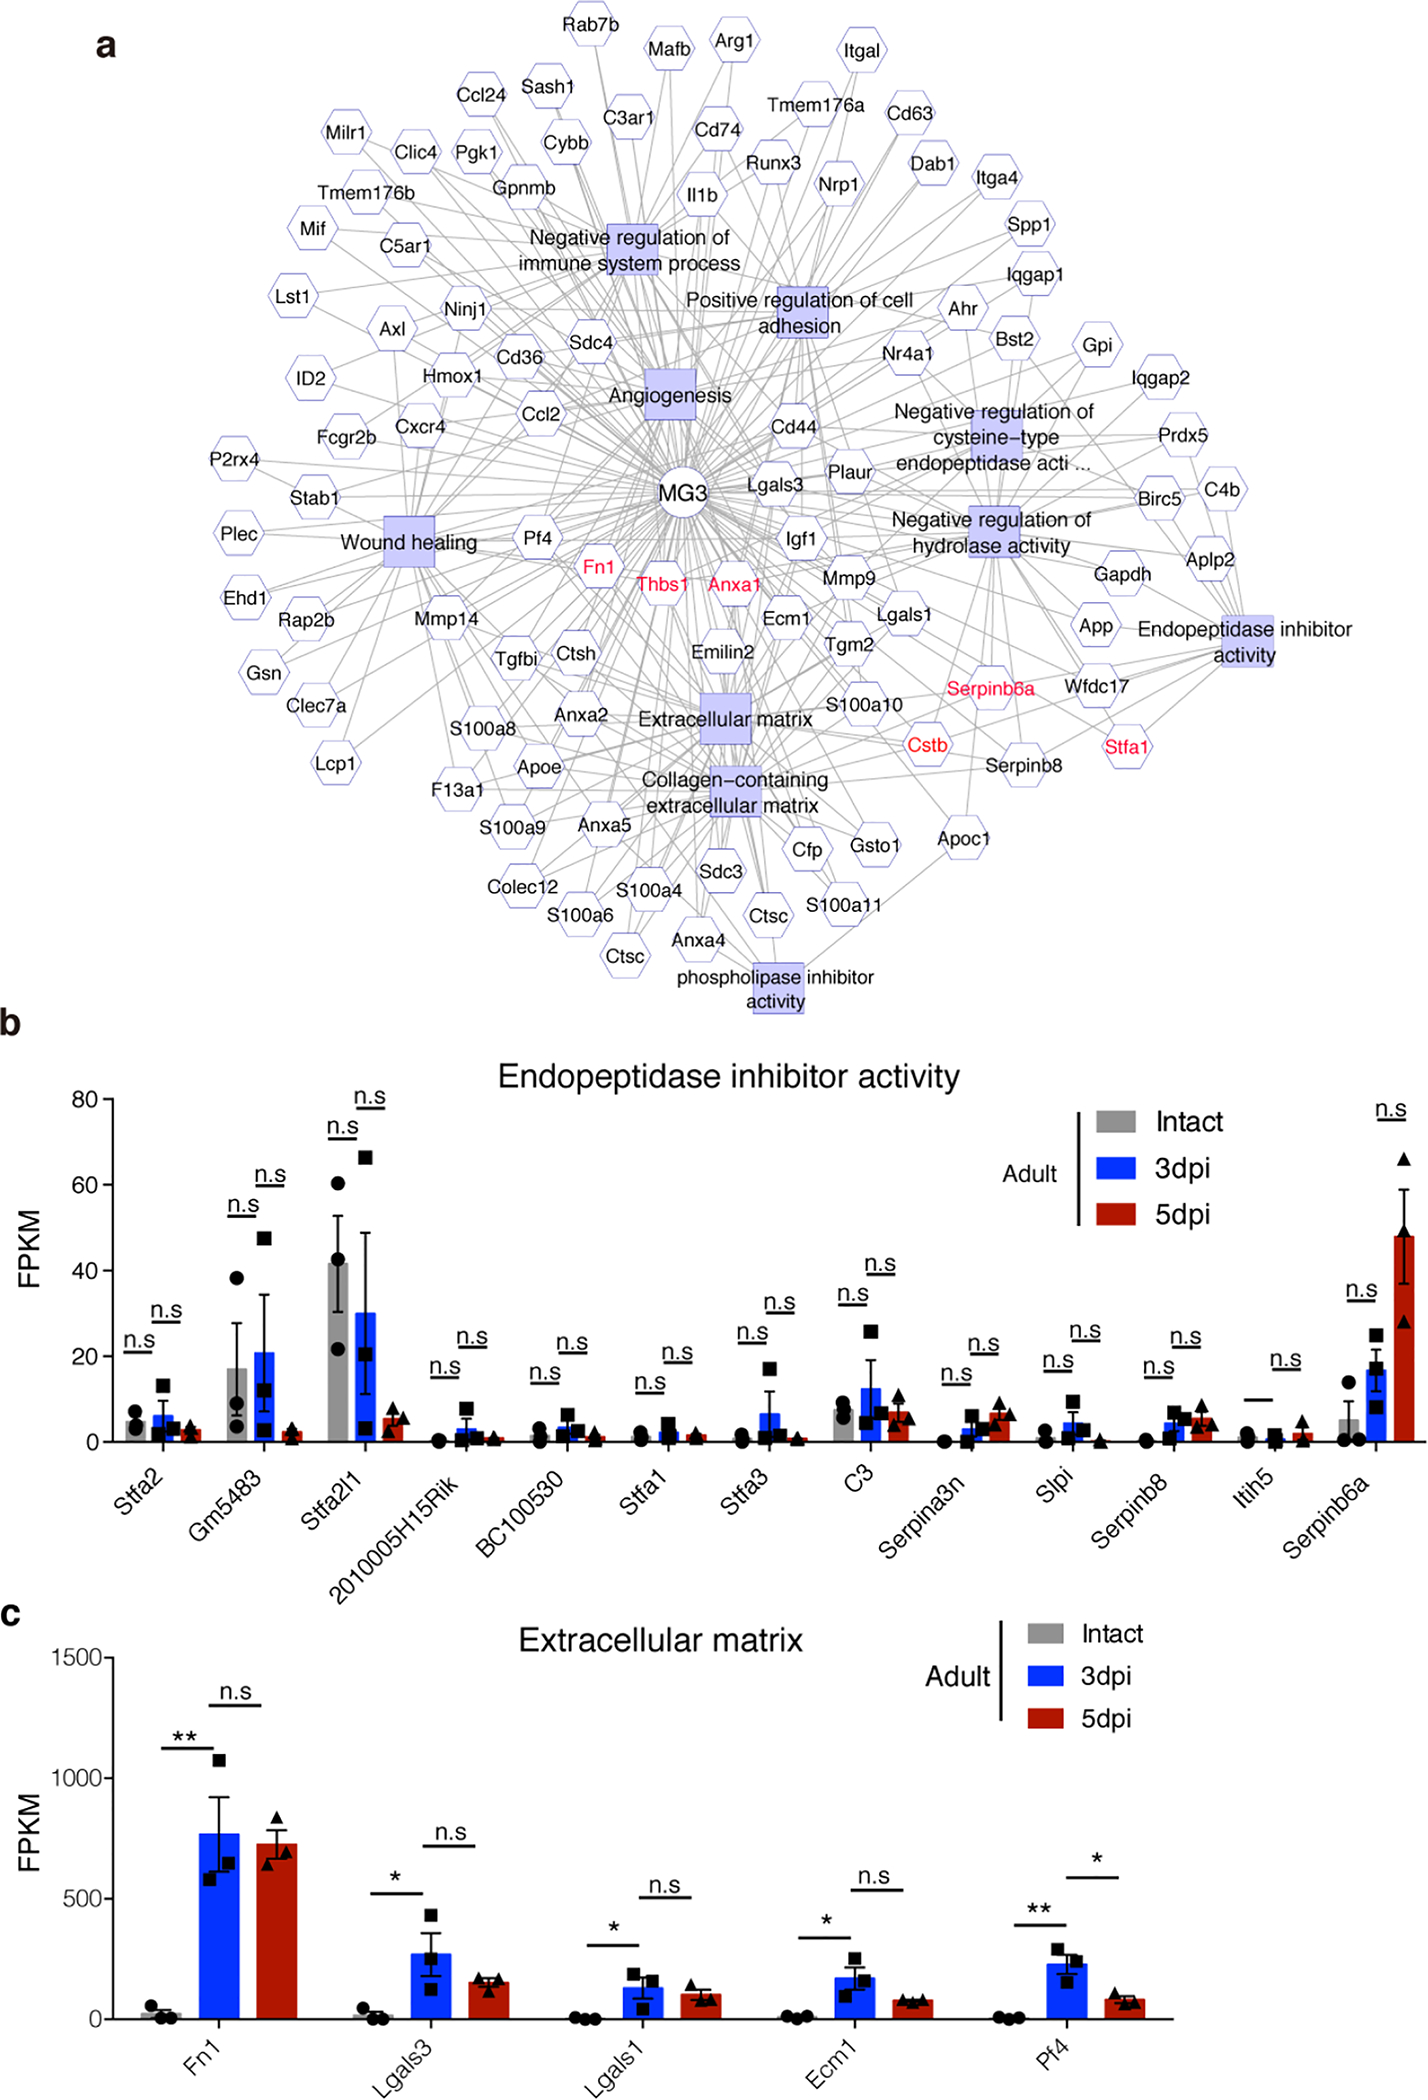
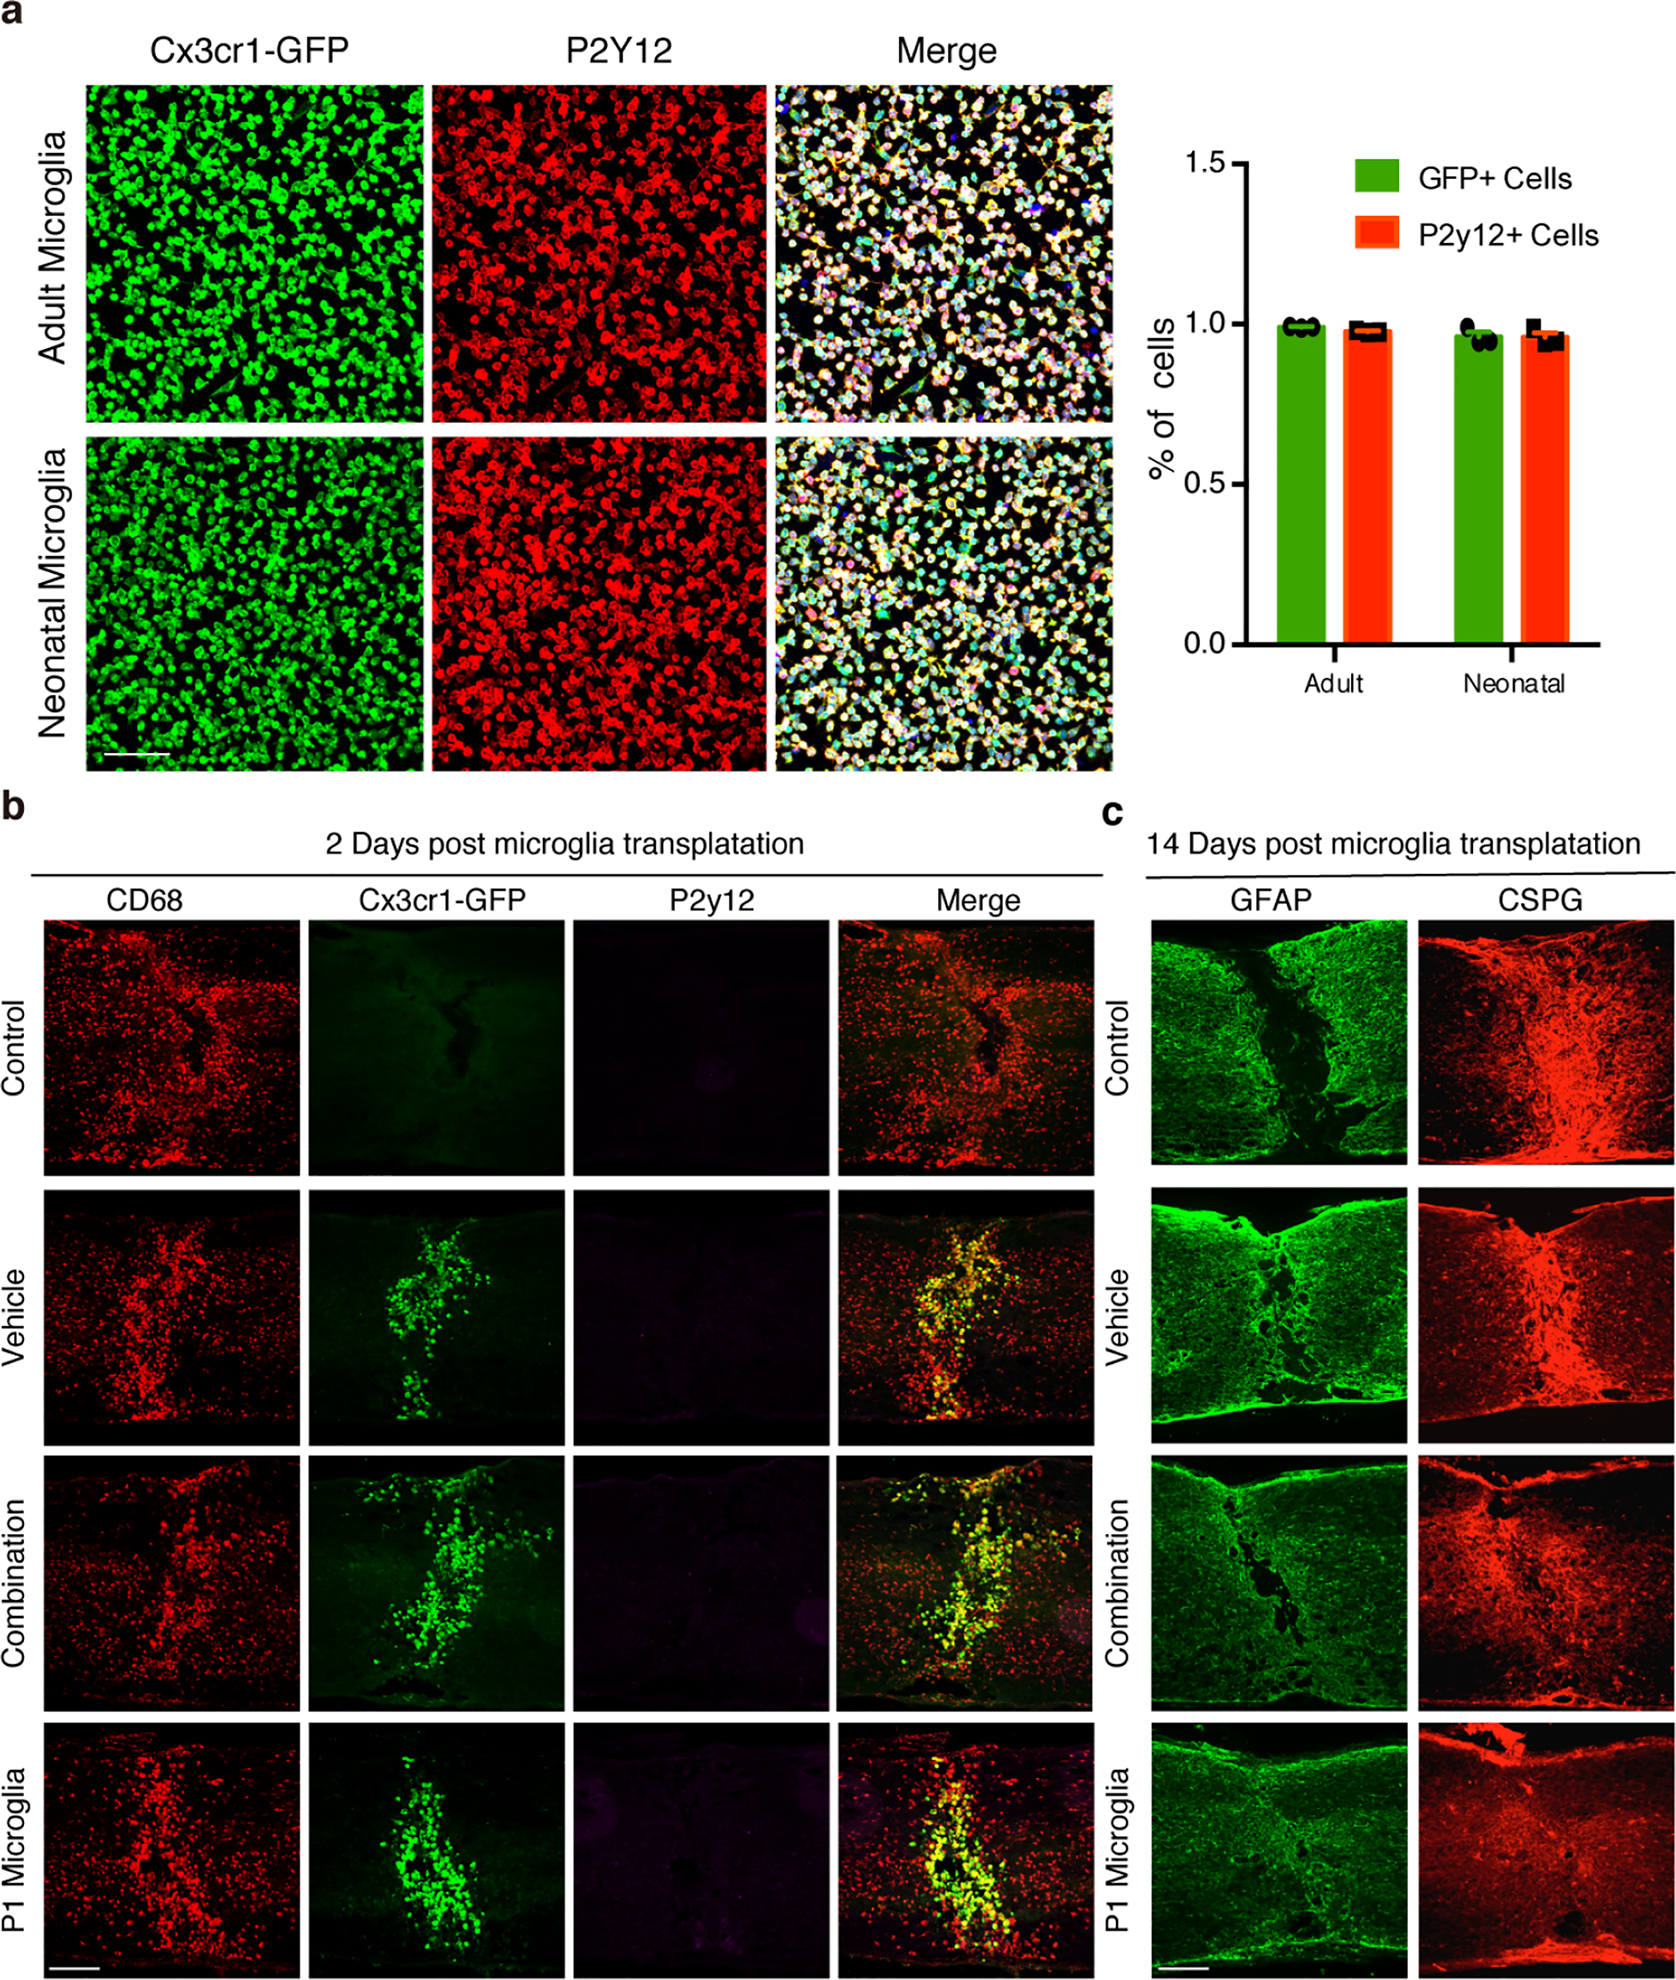
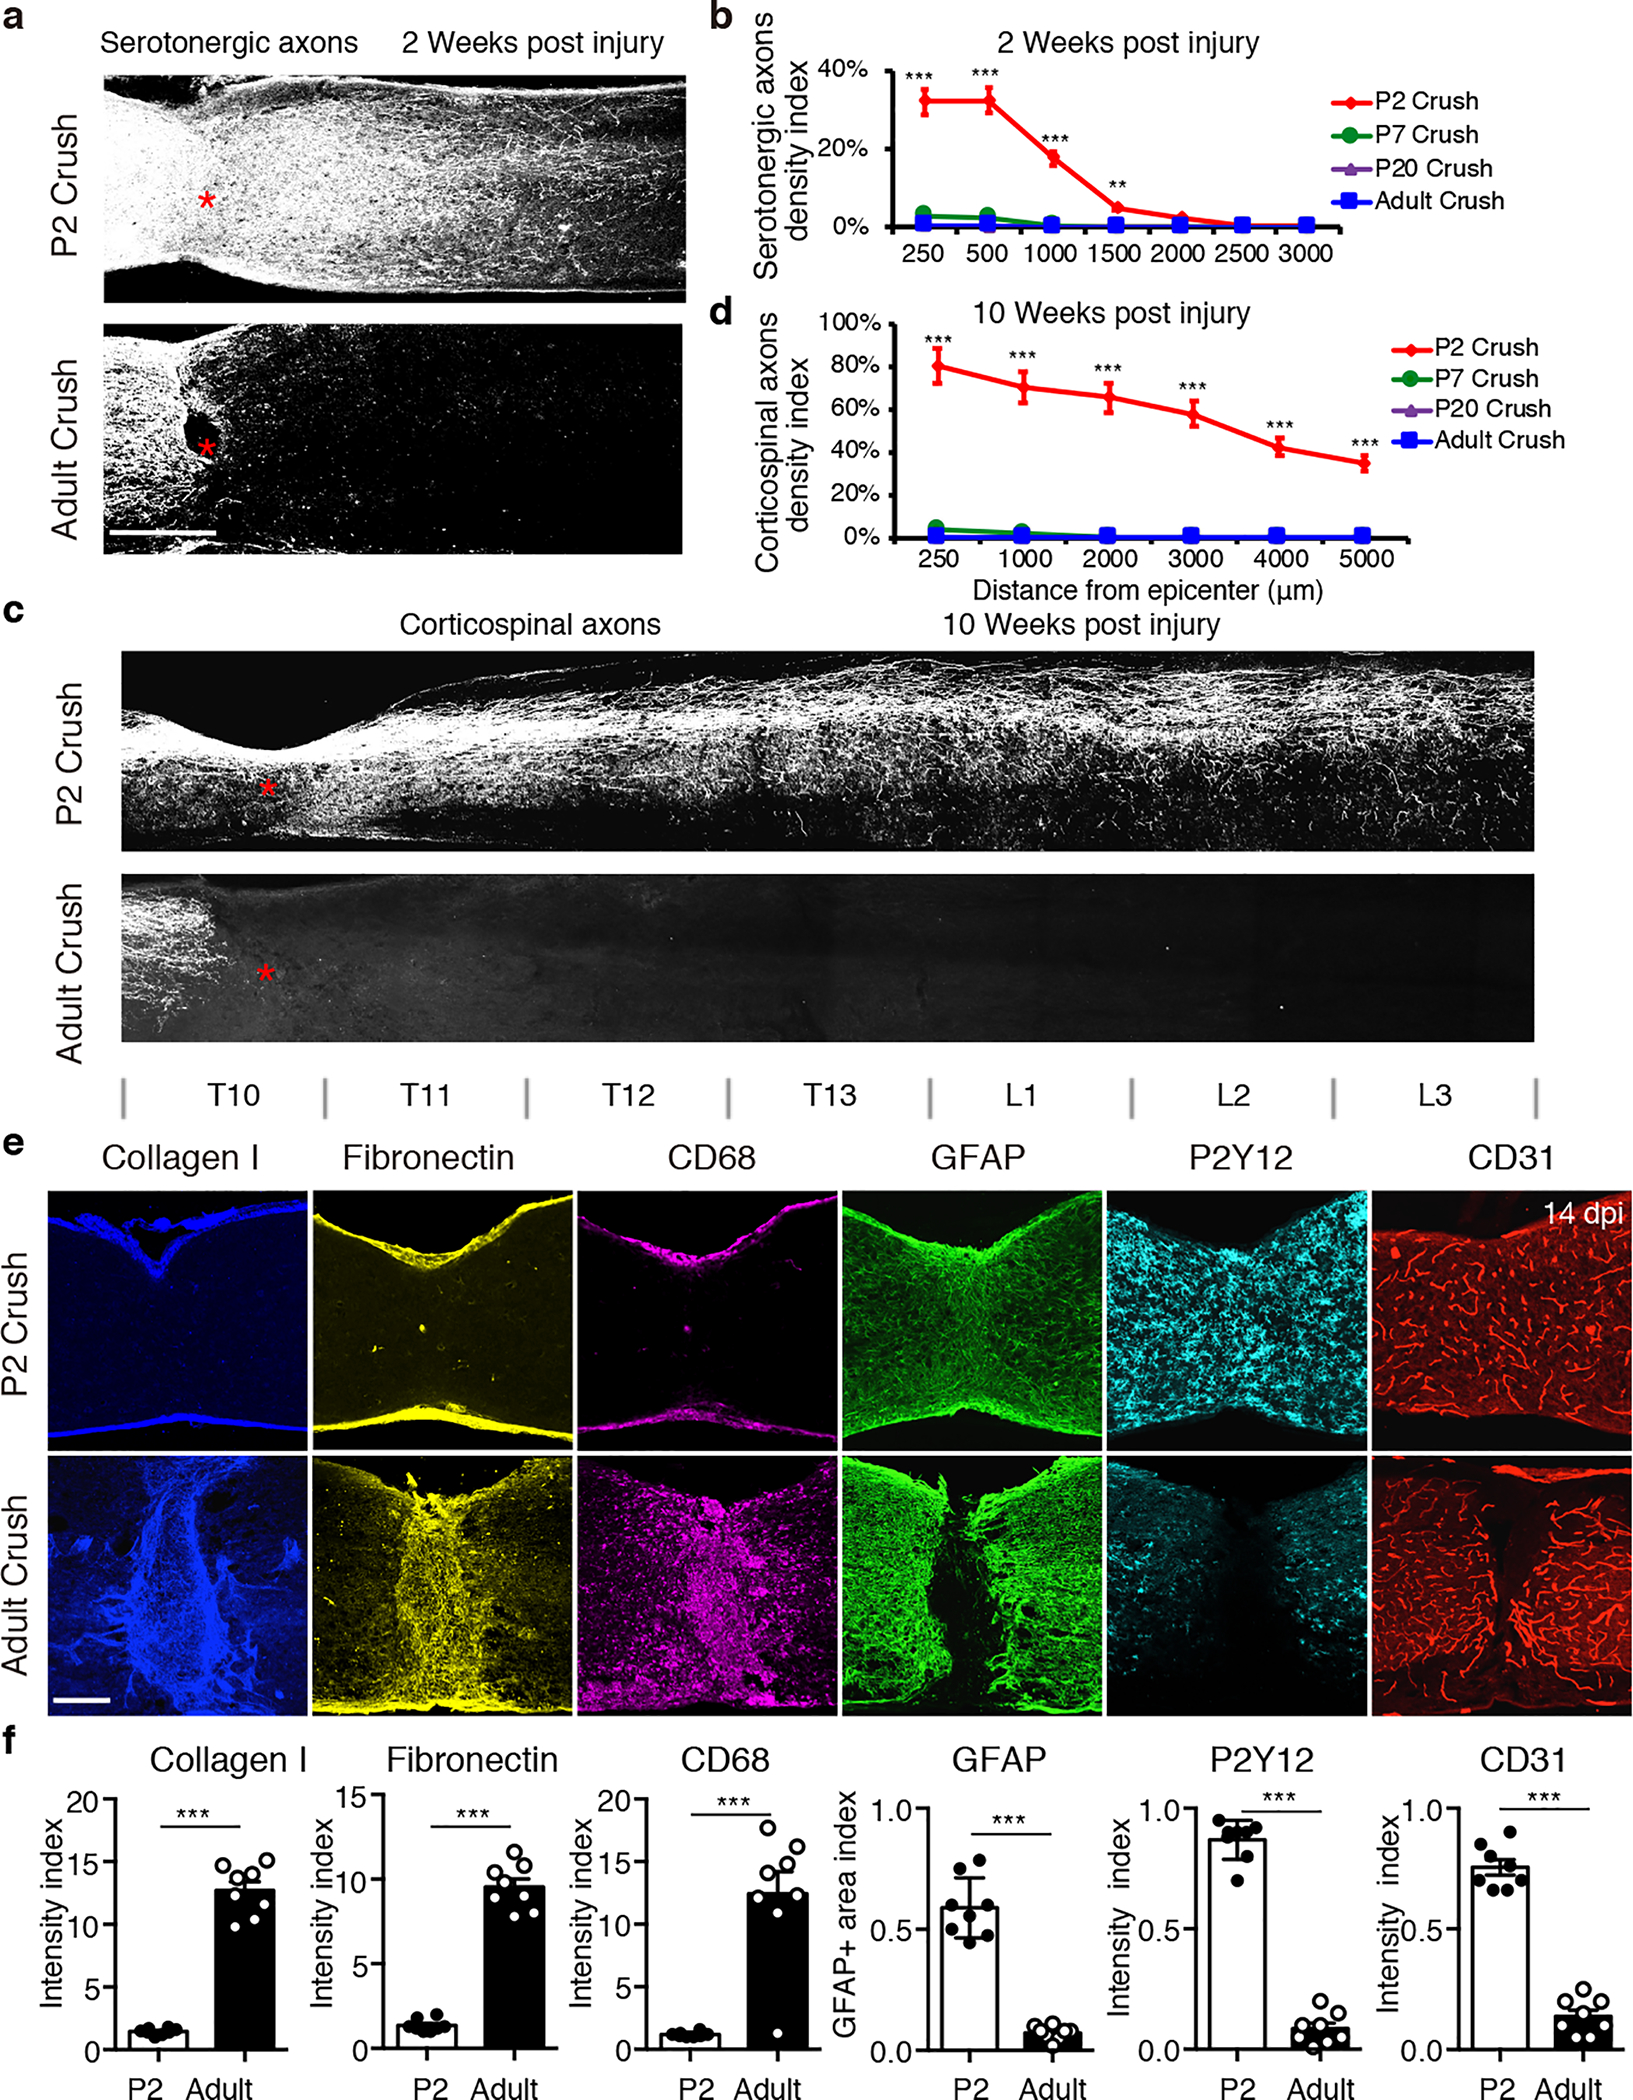
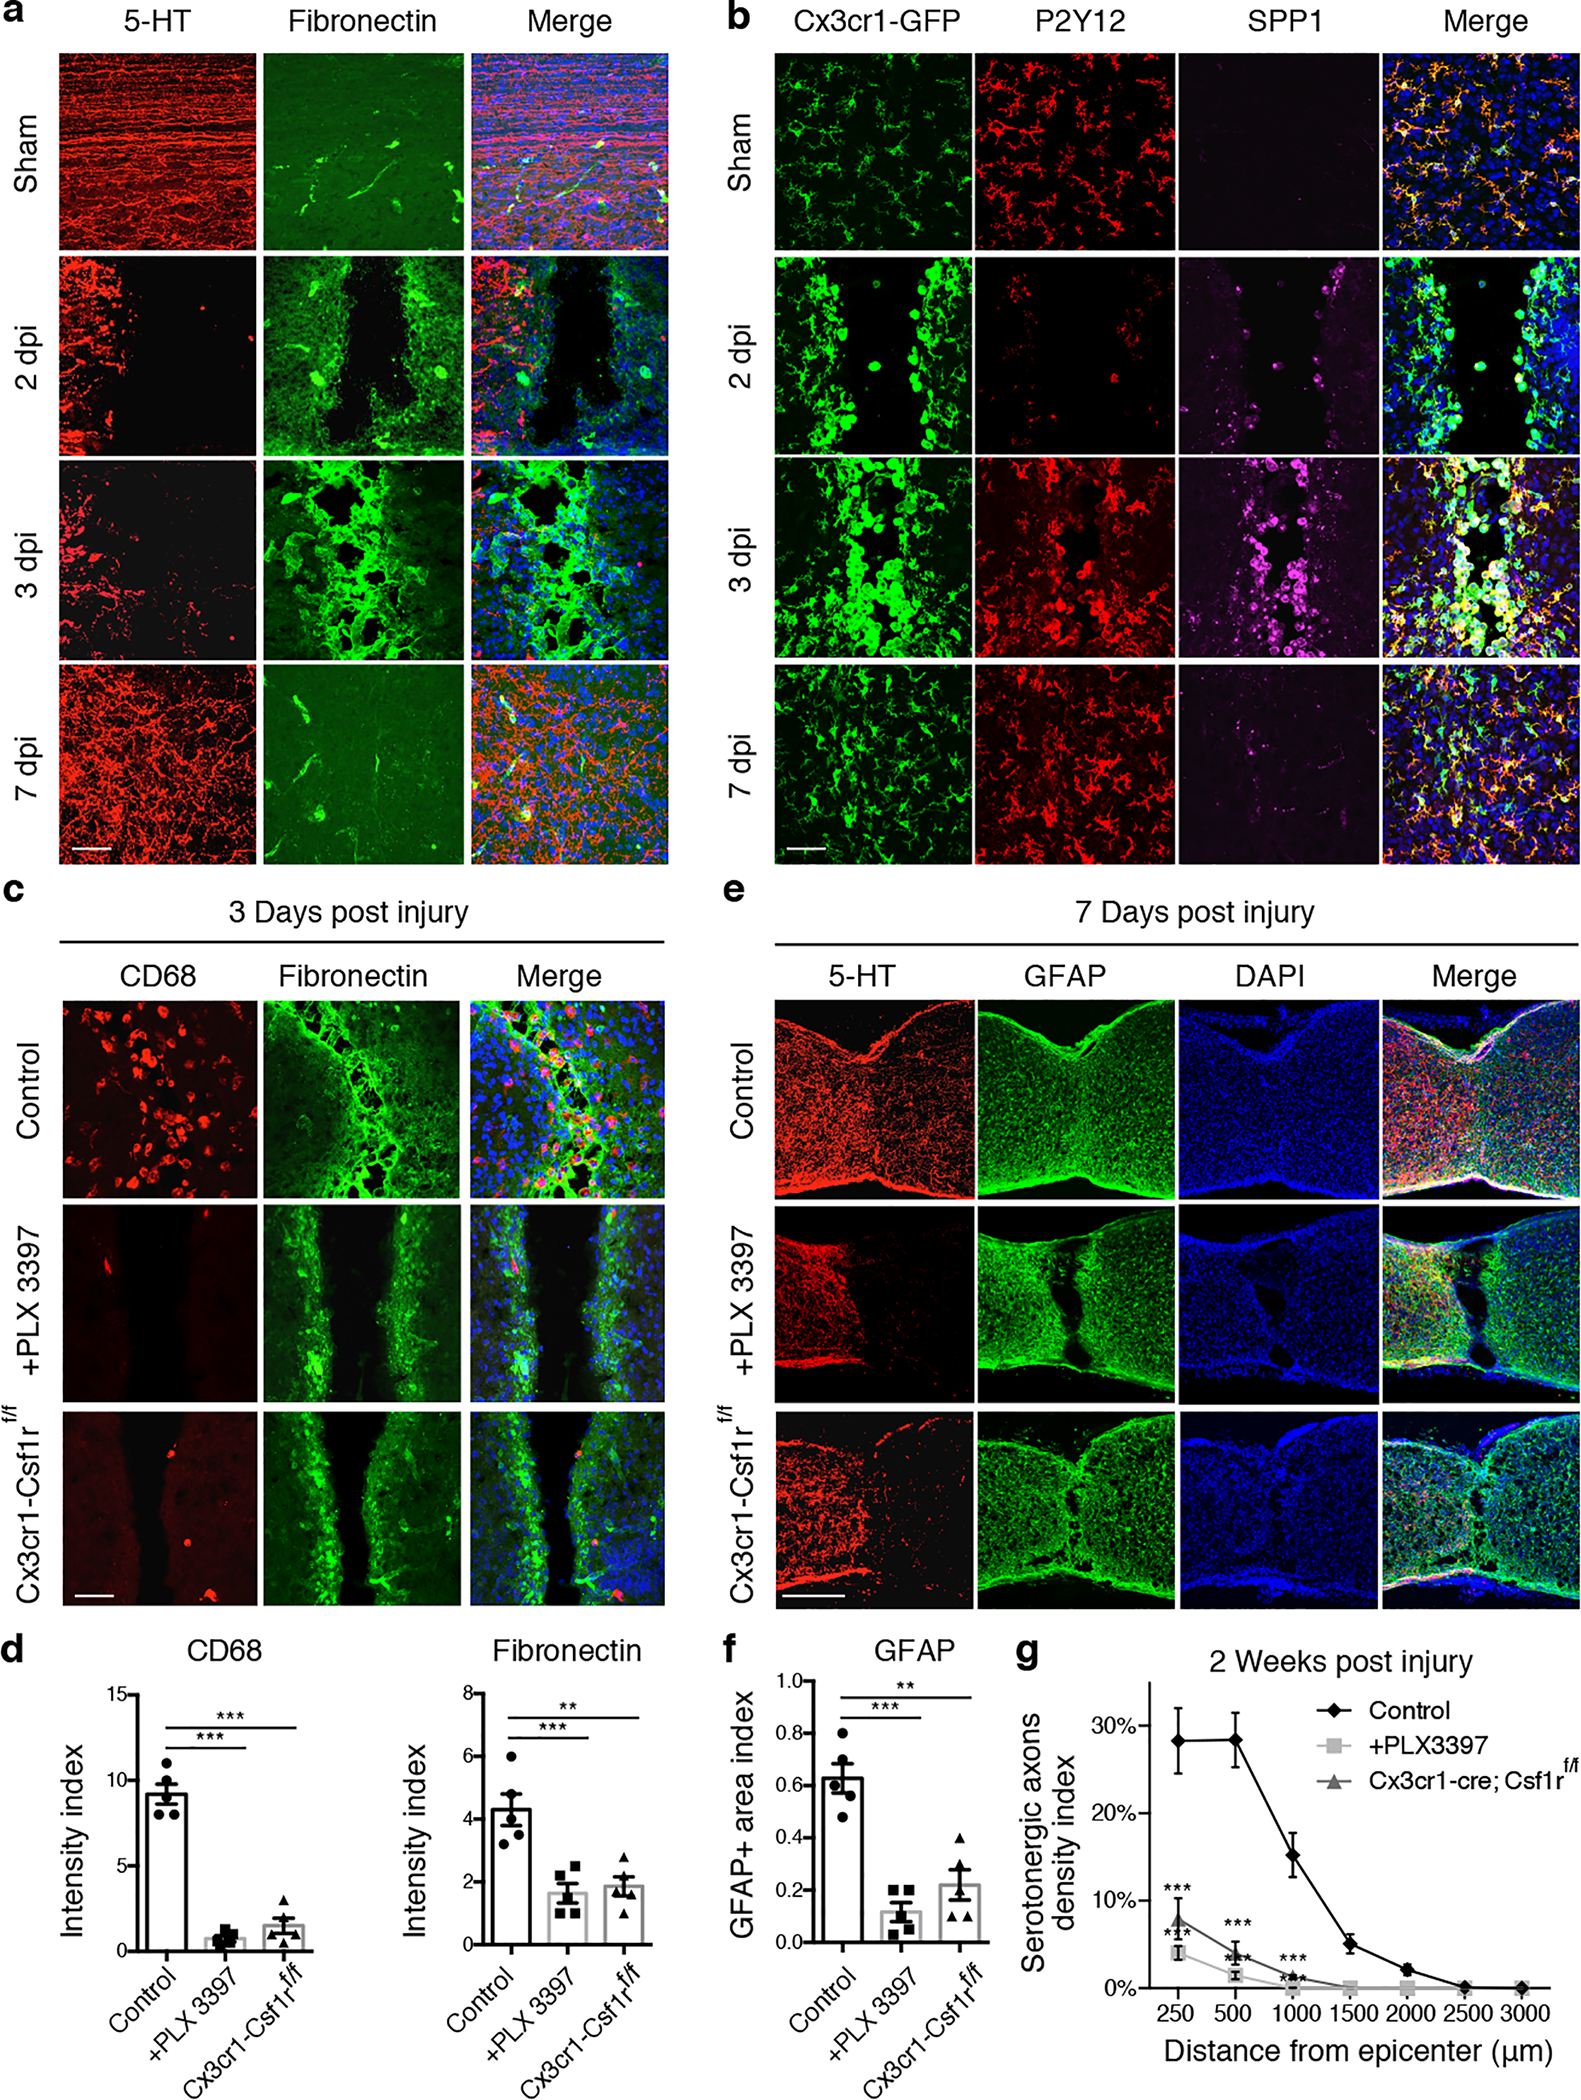
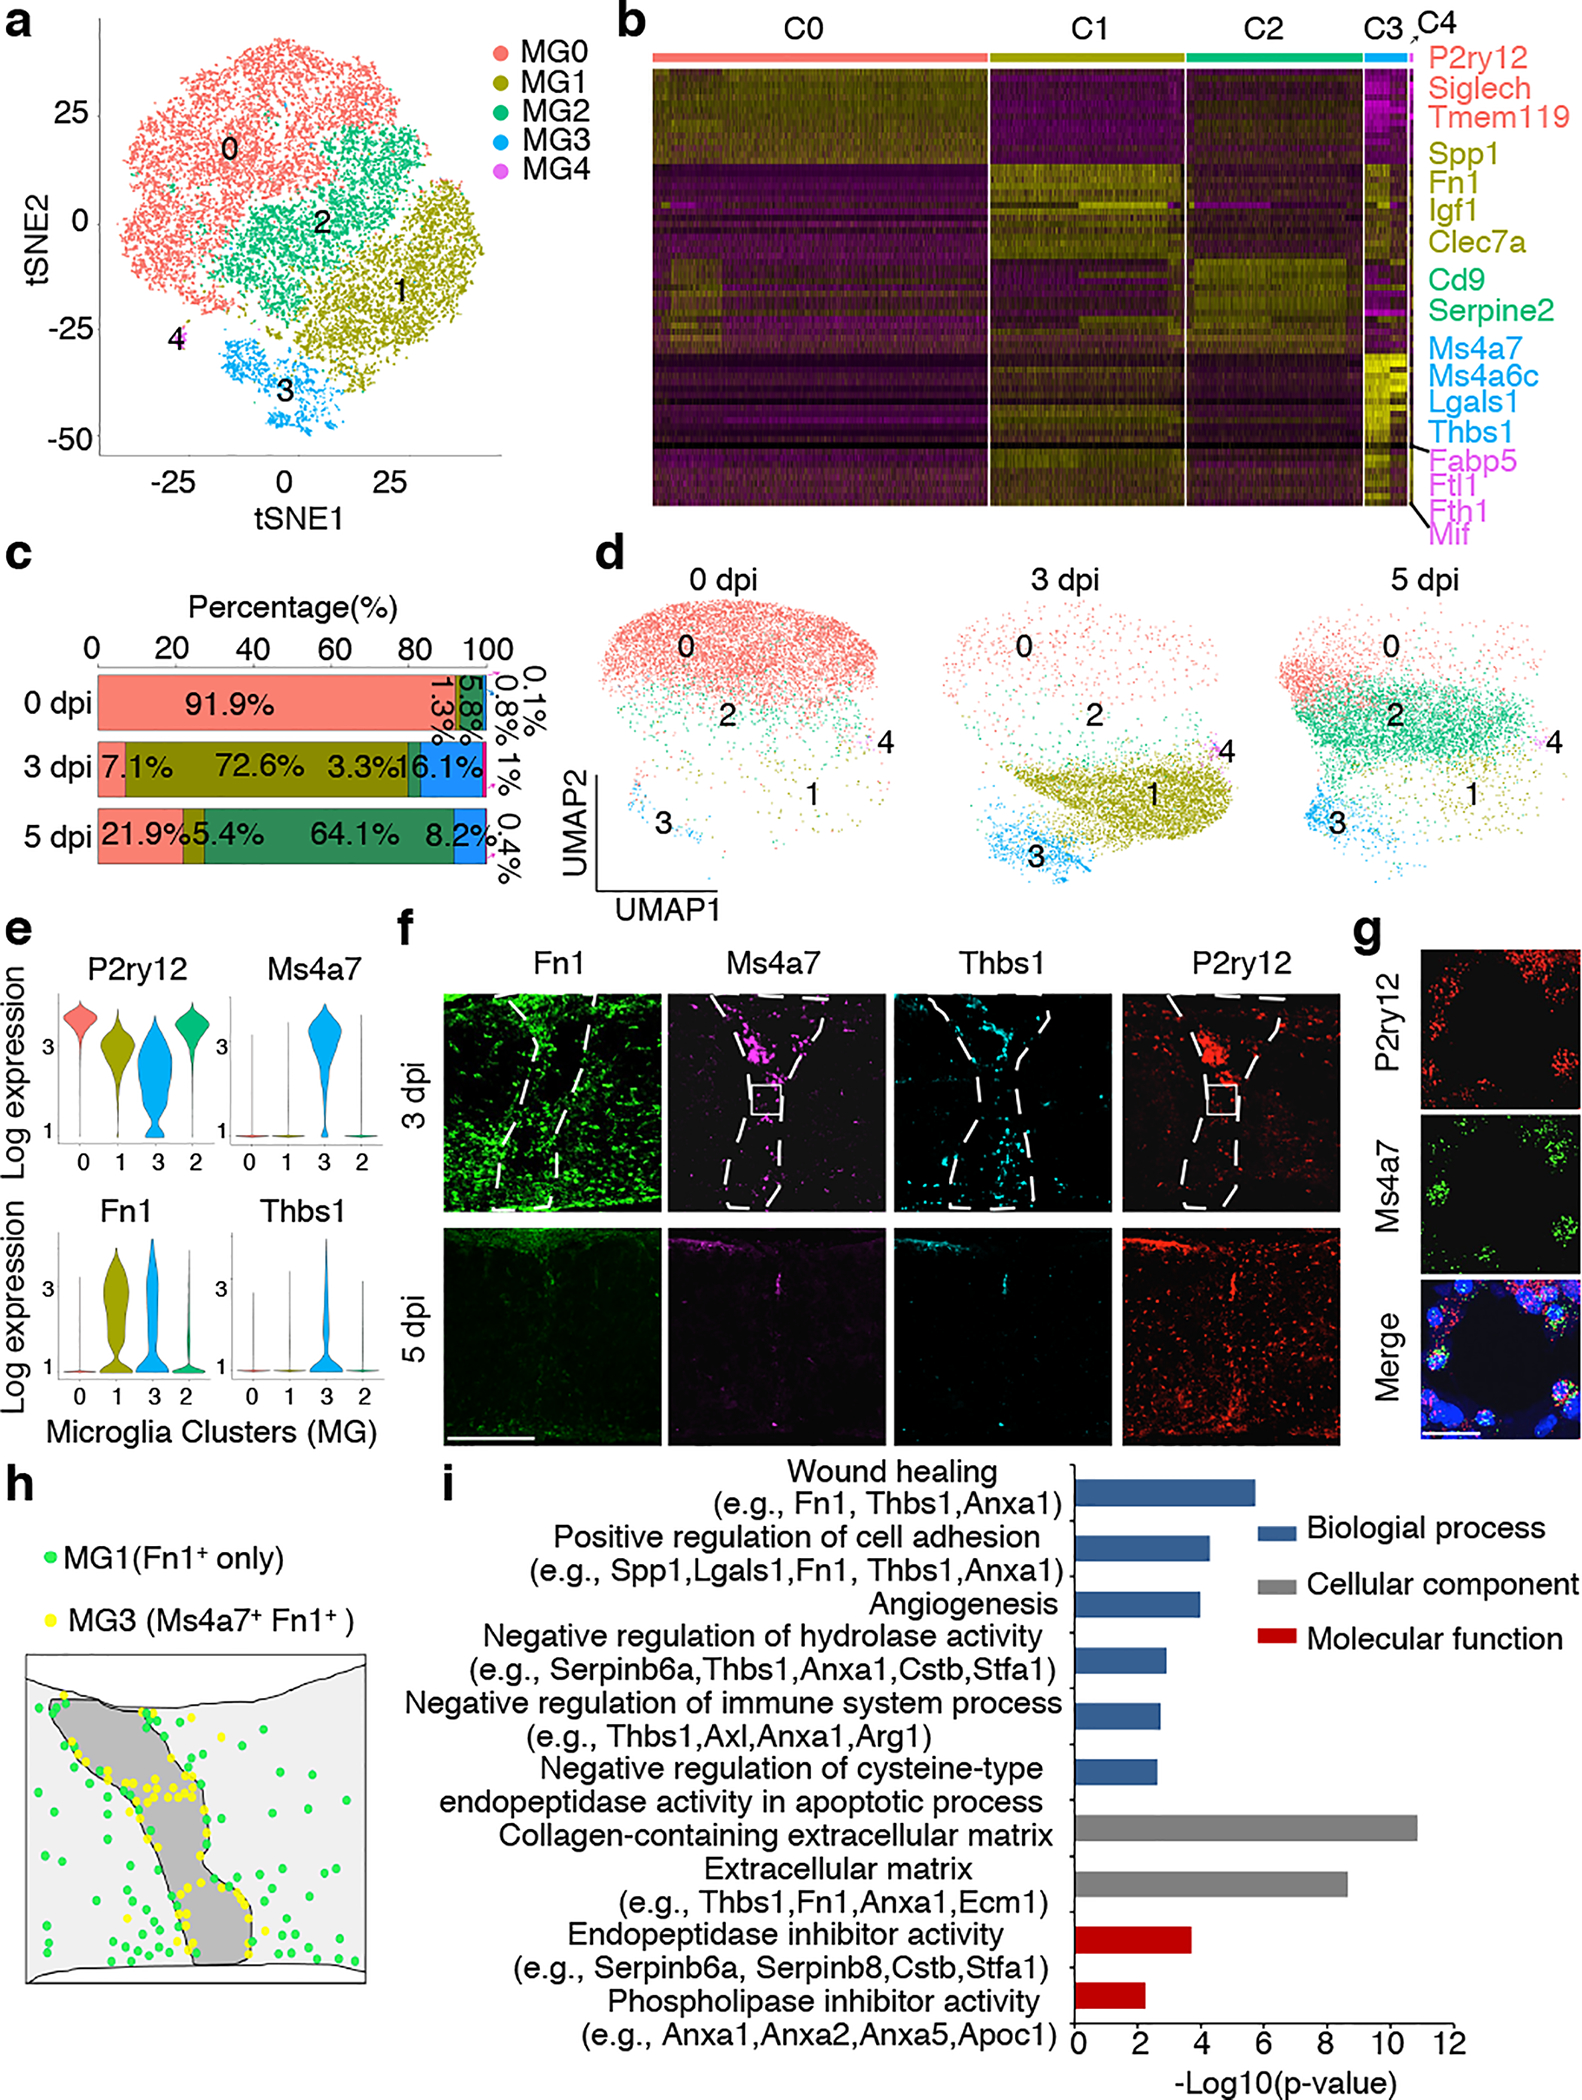
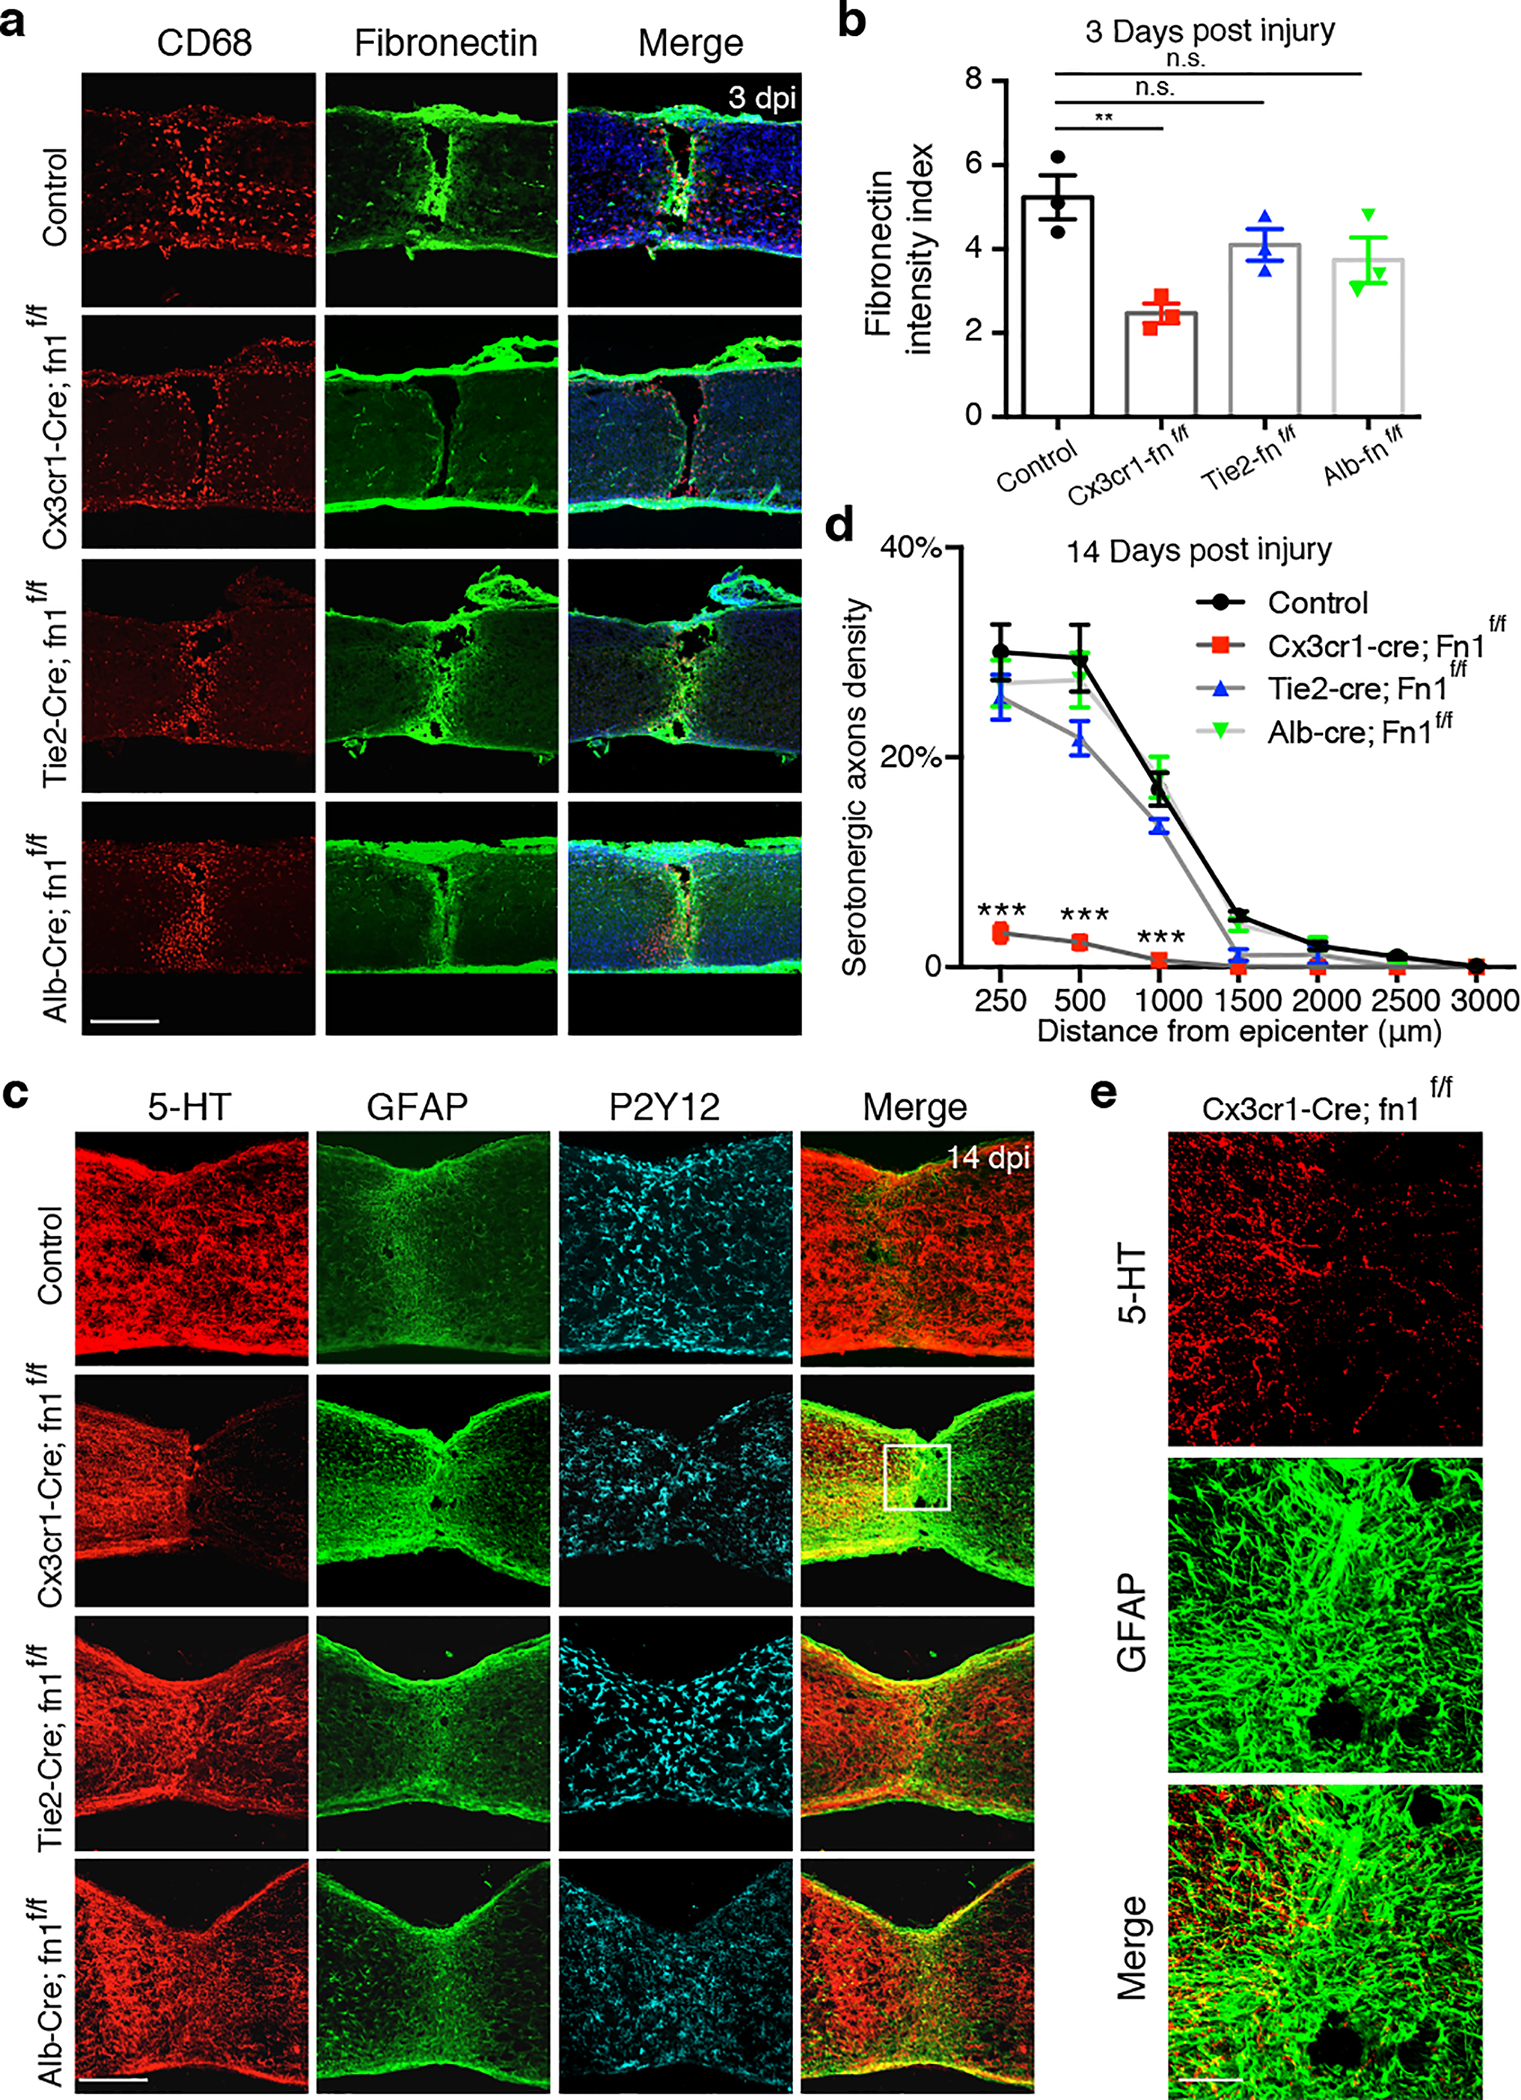
Spinal cord injury in mammals is thought to trigger scar formation with little regeneration of axons1-4. Here we show that a crush injury to the spinal cord in neonatal mice leads to scar-free healing that permits the growth of long projecting axons through the lesion. Depletion of microglia in neonatal mice disrupts this healing process and stalls the regrowth of axons, suggesting that microglia are critical for orchestrating the injury response. Using single-cell RNA sequencing and functional analyses, we find that neonatal microglia are transiently activated and have at least two key roles in scar-free healing. First, they transiently secrete fibronectin and its binding proteins to form bridges of extracellular matrix that ligate the severed ends of the spinal cord. Second, neonatal-but not adult-microglia express several extracellular and intracellular peptidase inhibitors, as well as other molecules that are involved in resolving inflammation. We transplanted either neonatal microglia or adult microglia treated with peptidase inhibitors into spinal cord lesions of adult mice, and found that both types of microglia significantly improved healing and axon regrowth. Together, our results reveal the cellular and molecular basis of the nearly complete recovery of neonatal mice after spinal cord injury, and suggest strategies that could be used to facilitate scar-free healing in the adult mammalian nervous system.


Conflict of interest statement

Competing Interests: Z.H. is an advisor of SpineX.

Figures

Extended Data Fig.1 |
Extended Data Fig.1 |. Age-dependent decline in serotonergic axon regrowth and wound healing.
a, Representative images of the spinal cord sagittal sections showing 5HT-labeled axons from sham, P7 or P20 mice at 2 weeks after crush. Scale bar: 500μm. b, Representative images of the spinal cord sections from sham, P7 or P20 mice at 2 weeks after crush stained with antibodies against Collagen I, CD68, P2Y12 or CD31. Scale bar: 250μm. c, Representative images of spinal sagittal sections at 4 weeks after Sham control or P2 crush stained with corticospinal axon tracing by AAV-ChR2-mCherry. Red stars indicate the lesion site. Scale bar: 500μm. d, Representative images of sagittal spinal cord sections at 2 weeks after crush stained with antibodies against Laminin, CSPG and GFAP, respectively. Scale bar: 250μm. e, Representative images of sagittal spinal cord sections at 2 weeks after P20 crush stained with antibodies against Laminin, CSPG and 5-HT, respectively. Scale bar: 250μm. All experiments shown in this figure were independently repeated 3 times with similar results.
Extended Data Fig.2 |
Extended Data Fig.2 |. Distinct microglia/macrophage responses after neonatal or adult spinal cord crush.
a, Images of spinal cord sections stained with antibodies against CD68 and P2Y12 mice at 3 dpi, 7 dpi or 14dpi. Higher magnification images showing P2Y12+ cells were co-labeled with CD68 at 3 dpi. Cells with highly ramified morphology at 7 dpi, and 14dpi, around lesion sites. Scale bar: 100μm. b, Higher magnification images from Figure 2a showing CD68+ cells and Fibronectin matrix form bridges between gap at 3 dpi. Scale bar: 50μm. c, Immunolabeling for CD68 and P2Y12 in adult mice at 3 dpi, 7 dpi or 14dpi showing CD68-positive cells lacking P2Y12 expression. Scale bar: 200μm. All experiments shown in this figure were independently repeated 3 times with similar results.
Extended Data Fig.3 |
Extended Data Fig.3 |. Histological assessments of bridges formed after neonatal spinal cord crush.
a, Higher magnification images of spinal sections of spinal cord bridges area stained with antibodies against Fibronectin, GFAP, P2Y12, Collagen I and DAPI (Blue) at 3 dpi in P2 injury. Scale bar: 50μm. b, Representative images of spinal sections of Cx3cr1-GFP mice immunolabeled with Caspase-3 showing cells around the lesion sites at 3 dpi in P2 injury. Scale bar: 200μm. All experiments shown in this figure were independently repeated 3 times with similar results.
Extended Data Fig.4 |
Extended Data Fig.4 |. Infiltrated CCR2+ monocytes/macrophages were eliminated after neonatal but not adult spinal cord injury.
a, b Representative images of sagittal sections of injured spinal cord of Ccr2-RFP mice at 3 or 14 dpi in a, P2 crush or b, adult crush. Sections were immunostained for CD68 and RFP (for Ccr2-RFP). Scale bar: 250μm. All experiments shown in this figure were independently repeated 3 times with similar results.
Extended Data Fig.5 |
Extended Data Fig.5 |. Microglia depletion impaired wound healing and axon regrowth after neonatal spinal cord injury.
a, Representative P2Y12-stained spinal cord images showing PLX3397-mediated depletion of microglia cells (left). Quantification of microglia depletion in the spinal cord treated with PLX3397 or vehicle at 0, 7 or 14 dpi (right). Student’s t test (two-tailed, unpaired). ***p < 0.0001. Scale bar: 250μm. n=3, 5 and 5 for 0dpi, 7dpi and 14dpi respectively, Data shown as mean ± s.e.m.. b, Representative images of P2Y12-stained spinal cord sections from control (Csf1rf/f) and Csf1r KO (Cx3cr1-Cre; Csf1rf/f) mice showing ~70% reduction of microglia throughout the spinal cord in the mutant mice. Student’s t test (two-tailed, unpaired). ***p = 0.0004. Scale bar: 250μm. n=5 per group. Data shown as mean ± s.e.m. c, Representative images of sagittal spinal sections taken at 14 days after P2 crush and immunostained with antibodies against 5-HT, GFAP, laminin, CSPG or CD31. Scale bar: 200μm. d, Higher magnification images from c, showing 5-HT axon and GFAP+ astrocytes in the lesion site. Scale bar: 50μm.
Extended Data Fig.6 |
Extended Data Fig.6 |. Isolation and scRNA-seq results of immune cells after neonatal spinal cord injury.
a, Plots of FACS showing selection of CD11b+, CD45+ cells from neonatal spinal cord dissociated cells. b, tSNE plot showing 14 clusters and population annotations. c, d, Relative proportions of microglia among total cells and dividing microglia among microglia cells. e, Table showing the percentage of each cluster and their signature genes (left). Heatmap depicting top 30 DE (differential expression) genes for each of the 14 clusters (right).
Extended Data Fig.7 |
Feature plots showing examples of differentially expressed genes in different clusters.
Extended Data Fig.8 |
Extended Data Fig.8 |. Comparison of gene expression changes in PAM, DAM and MG3.
Dot plots showing gene expression correlation between proliferative-region associated microglia (PAM) or disease associated microglia (DAM) (normalized to homeostatic microglia) with MG3 (normalized to MG0) showing different sets of up- and down-regulated genes. n=13755 and 14423 genes, for PAM and DAM, respectively.
Extended Data Fig.9 |
Extended Data Fig.9 |. Network analysis and further characterization of MG3 DE genes.
a, Diagram depicting correlated gene modules that underlie cluster identities of MG3 microglia. b-c, The expression of selected genes in microglia isolated at different time points after adult injury using bulk RNAseq. Expression of genes associated with endopeptidase inhibitor activity b, and extracellular matrix c, in adult microglia at 0, 3 and 5dpi. One-way ANOVA followed by post hoc Bonferroni correction. *p = 0.03 (lgals3), 0.04 (lgals1), 0.01 (ecm), 0.01(pf4); **p = 0.003 (fn1), 0.0013 (pf4). n.s., not significant. n=3 per group. Data shown as mean ± s.e.m.
Extended Data Fig. 10 |
Extended Data Fig. 10 |. Microglia isolation and transplantation.
a, Representative images (left) and quantification (right) of isolated microglia (P2Y12+) from neonatal or adult Cx3cr1-GFP mice, n=400 cells examined over 3 independent experiments. Data shown as mean ± s.e.m. Scale bar: 50μm. b, Representative images of spinal cord sections showing the activation of transplanted microglia in the adult lesion at 2 days after grafting. Scale bar: 250μm. All experiments shown in b, were independently repeated 3 times with similar results. c, Representative images of spinal cord sections showing the GFAP and CSPG in the adult lesion at 14 days after grafting, quantification results were shown in Figure 5d. Scale bar: 250μm.
Fig. 1 |
Fig. 1 |. Scar-free wound healing after neonatal spinal cord crush injury.
a, Images of spinal sections stained with anti-5HT antibody taken at 2 weeks after P2 (top) or adult (bottom) injury. Red stars indicate the lesion site. b, Quantification of serotonergic axon density (normalized to proximal of lesion) in spinal cord distal to the lesion site. n=8, 5, 5 and 8 for P2, P7, P20 and adult, respectively. **p = 0.0031; ***p < 0.0001. c, Images of spinal sections at 10 weeks post crush showing CST axons labeled by AAV-ChR2-mCherry. d, Quantification of CST axons distal to the lesion site at 10 weeks post crush (n=5). ***p < 0.0001. e, Images of spinal sections at 2 weeks after crush stained with indicated antibodies. f, Quantification of indicated immunoreactive intensity (normalized to the intact region) in the lesion site at 2 weeks after injury (n=8). ***p < 0.0001. b, d, Two-way ANOVA followed by post hoc Bonferroni correction. f, Student’s t test (two-tailed, unpaired). Data shown as mean ± s.e.m. Scale bar: 500μm (a), 1mm (b), 250μm (c, e).
Fig. 2 |
Fig. 2 |. Microglia are required for bridge formation and rapid healing after neonatal injury.
a, Images of spinal lesions after P2 crush stained with indicated antibodies or DAPI (blue). b, Images of spinal cord lesion at different time points after injury stained with antibodies against P2Y12, SPP1 and DAPI (blue) in Cx3cr1-GFP mice. c, Images of spinal sections at 3 dpi from different groups of mice stained with indicated antibodies or DAPI (Blue). d, Quantification of CD68 and Fibronectin immunoreactive intensity (normalized to the intact region) in the lesion site at 3 days after P2 crush (n=5). **p = 0.0014. ***p < 0.0001. e, Images of spinal sections at 7 dpi in different groups of P2 crushed mice stained with antibodies against 5-HT, GFAP and DAPI. f, Quantification of GFAP immunoreactive intensity in the lesion at 7 days after P2 crush (n=5). **p = 0.0003, ***p < 0.0001. g, Quantification of serotonergic axons density in spinal cord distal to the lesion site at 2 weeks after P2 crush (n=5). ***p < 0.0001. d, f, One-way ANOVA followed by post hoc Bonferroni correction. g, Two-way ANOVA followed by post hoc Bonferroni correction. Data shown as mean ± s.e.m. Scale bar: 50μm (a-c), 250μm (e).
Fig. 3 |
Fig. 3 |. scRNA-seq analysis of microglia isolated from lesion site after P2 injury.
a, tSNE plot showing 5 clusters of microglia isolated at different time points after P2 crush. b, Heatmap showing the top 15 markers for individual clusters. c, Bar plot or d, UMAP of different clusters of microglia at different time points after injury. e, Violin plots showing high-level expression of Ms4a7 and Thbs1 in MG3 and Fn1 in both MG1 and MG3. f, RNA in situ hybridization showing Ms4a7 and Thbs1 enrichment in the lesion epicenter and expression of Fn1 in and around the lesion site. g, Higher magnification images from f, showing co-expression of Ms4a7 and P2ry12 in microglia in the lesion site. All experiments shown in f, and g, were independently repeated 3 times with similar results. h, Schematic showing distribution of MG1 and MG3 microglia. i, Selected GO terms and associated genes enriched in cluster 3 microglia (MG3), two-sided statistical test in function enrichGO was used. Scale bar: 200μm (f), 20μm (g).
Fig. 4 |
Fig. 4 |. Deletion of fibronectin in microglia impairs wound healing and axon regrowth after P2 injury.
a, Images of spinal sections stained with indicated antibodies taken from 3 dpi of control (Fn1f/f) or different conditional knockout mice. b, Quantification of Fibronectin intensity in the lesion site (3 dpi in P2 injury) in different groups of mice (n=3). One-way ANOVA followed by post hoc Bonferroni correction. **p = 0.0063, n.s., not significant. c, Images of spinal sections stained with antibodies against 5-HT or GFAP, or P2Y12 taken in different groups of mice at 14dpi. d, Quantification of serotonergic axons density (normalized to proximal of lesion) in the spinal cord distal to the lesion (n=5). Two-way ANOVA followed by post hoc Bonferroni correction. ***p < 0.0001. e, Higher magnification images from c, showing 5-HT axon terminals and GFAP+ astrocytes in the lesion site. Data shown as mean ± s.e.m. Scale bar: 250μm (a, c), 50μm (e).
Fig. 5 |
Fig. 5 |. Transplanted neonatal or proteinase inhibitor-treated adult microglia improve wound healing and axon regeneration in adult mice.
a, b, Images of spinal cord sections taken 2 weeks after adult injury with or without transplantation of adult microglia treated with vehicle or E64/SerpinA (Combination), P1 microglia, and stained with respective antibodies. c, d, Quantification of the results from a, b and Extended data Fig. 10c. n=6. One-way ANOVA followed by post hoc Bonferroni correction. *p = 0.03 (CSPG), 0.0156 (GFAP), **p = 0.0077, ***p < 0.001. n.s., not significant. e, Images of spinal sections from different groups of mice at 4 weeks after adult crush stained with anti-5-HT. Red stars indicate the lesion site. f, Quantification of serotonergic axon density (normalized to proximal of lesion) in spinal cord distal to the lesion site at 4 weeks (n=7). Two-way ANOVA followed by post hoc Bonferroni correction. *p = 0.0192; ***p < 0.0001. Data shown as mean ± s.e.m. Scale bar: 250μm (a, b, e).

References

    1. O’Shea TM, Burda JE & Sofroniew MV Cell biology of spinal cord injury and repair. The Journal of clinical investigation 127, 3259–3270, doi:10.1172/JCI90608 (2017). - DOI - PMC - PubMed
    1. Tran AP, Warren PM & Silver J The Biology of Regeneration Failure and Success After Spinal Cord Injury. Physiological reviews 98, 881–917, doi:10.1152/physrev.00017.2017 (2018). - DOI - PMC - PubMed
    1. Hilton BJ & Bradke F Can injured adult CNS axons regenerate by recapitulating development? Development 144, 3417–3429, doi:10.1242/dev.148312 (2017). - DOI - PubMed
    1. Stenudd M, Sabelstrom H & Frisen J Role of endogenous neural stem cells in spinal cord injury and repair. JAMA Neurol 72, 235–237, doi:10.1001/jamaneurol.2014.2927 (2015). - DOI - PubMed
    1. Mokalled MH et al. Injury-induced ctgfa directs glial bridging and spinal cord regeneration in zebrafish. Science 354, 630–634, doi:10.1126/science.aaf2679 (2016). - DOI - PMC - PubMed

Publication types

MeSH terms