. 2020 Jul 30;16(Suppl-1):82-92.
doi: 10.2174/1745017902016010082. eCollection 2020.

The Factor Structure of the Mood Disorder Questionnaire in Tunisian Patients

Affiliations

The Factor Structure of the Mood Disorder Questionnaire in Tunisian Patients

Uta Ouali et al. Clin Pract Epidemiol Ment Health. .

Abstract

Background: The Mood Disorder Questionnaire (MDQ) is a frequently used screening tool for the early detection of Bipolar Disorder (BD), which is often unrecognized or misdiagnosed at its onset. In this study, data from Tunisia has been used to evaluate the psychometric properties of the Arabic MDQ.

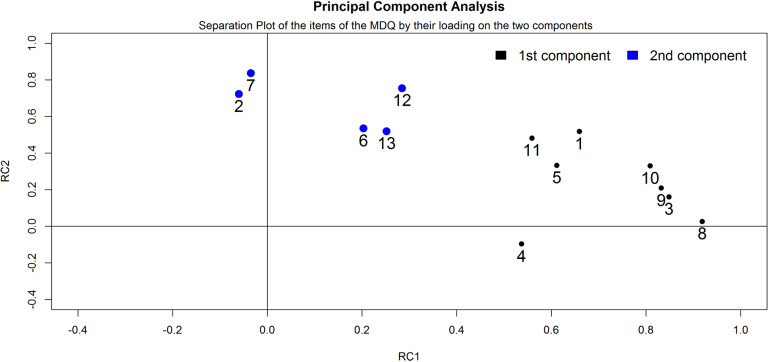
Methods: The sample included 151 patients with a current major depressive episode. The Arabic adapted version of the Structured Clinical Interview for DSM-IV-TR was used to formulate a diagnosis, yielding 62 patients with BD and 89 with unipolar Major Depressive Disorder (MDD). Principal component analysis with parallel analysis was used to establish the spontaneous distribution of the 13 core items of the MDQ. Confirmatory Factor Analysis (CFA) was used to check the available factor models. Receiver Operating Characteristic (ROC) analysis was used to assess the capacity of the MDQ to distinguish patients with BD from those with MDD.

Results: Cronbach's α in the sample was 0.80 (95%CI: 0.75 to 0.85). Ordinal α was 0.88. Parallel analysis suggested two main components, which explained 59% of variance in the data. CFA found a good fit for the existing unidimensional, the two-factor, and the three-factor models. ROC analysis showed that at a threshold of 7, the MDQ was able to distinguish patients with BD from those with MDD with extraordinary negative predictive value (0.92) and a positive diagnostic likelihood ratio of 3.8.

Conclusion: The Arabic version of the MDQ showed good measurement properties in terms of reliability, factorial validity and discriminative properties.

Keywords: Bipolar disorder; Confirmatory factor analysis; Early detection; Factorial validity; Hypomania/mania; Mood Disorder Questionnaire.


Figures

Fig. (1)
Fig. (1)
Profile plot of the distribution of the MDQ items’ scores by diagnosis. On the vertical axis (y-axis) it is reported the percentage of ‘yes’ endorsement of the item by diagnosis; on the horizontal axis (x-axis) there are the 13 items of the MDQ. Items for which a statistically significant difference at p<0.0001 was found on the Mann-Whitney U test were marked with an asterisk.
Fig. (2)
Fig. (2)
Parallel analysis applied to the items of the Mood Disorder Questionnaire (n = 13). Plot of the eigenvalues calculated on the basis of the actual data and of the simulated and resampled data. The number of dimensions to retain corresponds to the number of eigenvalues that have a higher value than the corresponding eigenvalues calculated on the basis of the simulated and resampled data. In this case, the number of dimensions to retain is 2 and is marked by a vertical dashed line.
Fig. (3)
Fig. (3)
Separation plot of the results of the principal component analysis applied to the items of the Mood Disorder Questionnaire (n = 13). Items are plotted on the basis of their loadings on the two extracted main dimensions. An item is as much “separated” along the two dimensions as much its loading differs across the two dimensions, i.e., it is very high on one dimension and very low on the other dimension.
Fig. (4)
Fig. (4)
Receiver operator characteristic (ROC) curve of the predictive capacity of the MDQ in differentiating patients with BD from patients with MDD. Sensitivity and specificity are reported as percentages, with a cross indicating on the curve the best compromise between them (corresponding to the cut-off). The area under the ROC curve (AUC) is reported alongside its 95% confidence interval.
Fig. (5)
Fig. (5)
Operating characteristics of the MDQ for various threshold scores among 151 Tunisian patients diagnosed with a current episode of major depressive disorder either in the course of a unipolar or bipolar mood disorder as diagnosed with the SCID.

References

    1. Merikangas K.R., Jin R., He J.P., Kessler R.C., Lee S., Sampson N.A., Viana M.C., Andrade L.H., Hu C., Karam e.g., Ladea M., Medina-Mora M.E., Ono Y., Posada-Villa J., Sagar R., Wells J.E., Zarkov Z. Prevalence and correlates of bipolar spectrum disorder in the world mental health survey initiative. Arch. Gen. Psychiatry. 2011;68(3):241–251. doi: 10.1001/archgenpsychiatry.2011.12. - DOI - PMC - PubMed
    1. Grande I., Berk M., Birmaher B., Vieta E. Bipolar disorder. Lancet. 2016;387(10027):1561–1572. doi: 10.1016/S0140-6736(15)00241-X. - DOI - PubMed
    1. Carta M.G., Angst J. Epidemiological and clinical aspects of bipolar disorders: controversies or a common need to redefine the aims and methodological aspects of surveys. Clin. Pract. Epidemiol. Ment. Health. 2005;1(1):4. doi: 10.1186/1745-0179-1-4. - DOI - PMC - PubMed
    1. Carta M.G., Angst J. Screening for bipolar disorders: A public health issue. J. Affect. Disord. 2016;205:139–143. doi: 10.1016/j.jad.2016.03.072. - DOI - PubMed
    1. Hoyle S., Elliott L., Comer L. Available screening tools for adults suffering from bipolar affective disorder in primary care: An integrative literature review. J. Am. Assoc. Nurse Pract. 2015;27(5):280–289. - PubMed