. 2020 Jul 18;5(1):bpaa014.
doi: 10.1093/biomethods/bpaa014. eCollection 2020.

Rapid and inexpensive whole-genome sequencing of SARS-CoV-2 using 1200 bp tiled amplicons and Oxford Nanopore Rapid Barcoding

Affiliations

Rapid and inexpensive whole-genome sequencing of SARS-CoV-2 using 1200 bp tiled amplicons and Oxford Nanopore Rapid Barcoding

Nikki E Freed et al. Biol Methods Protoc. .

Abstract

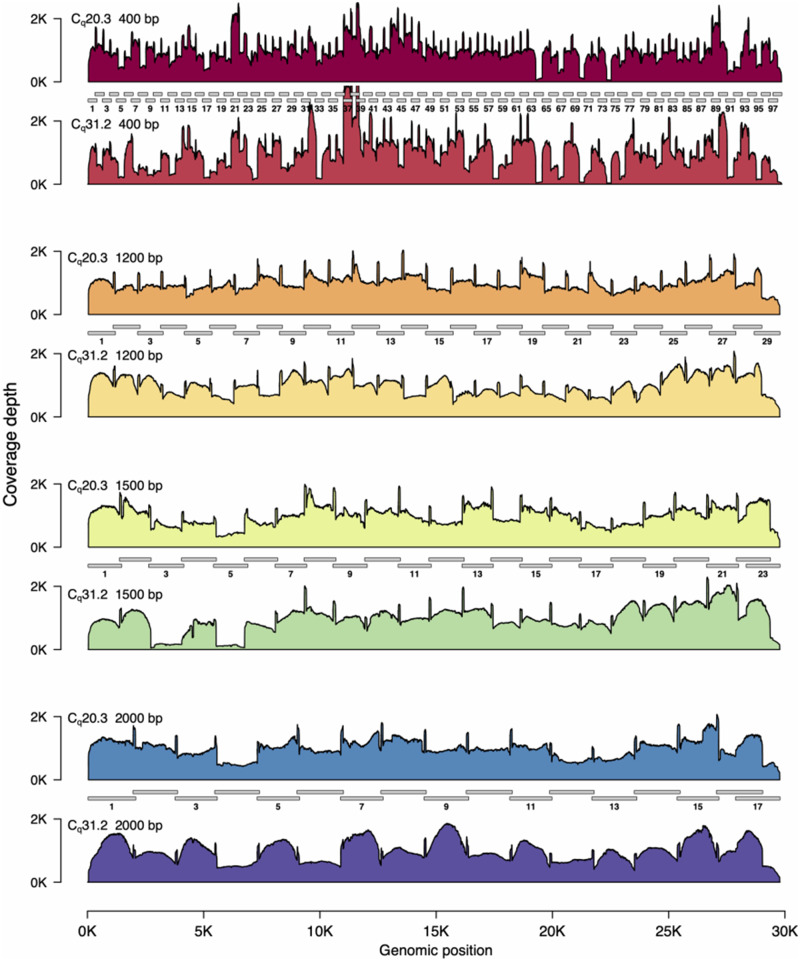
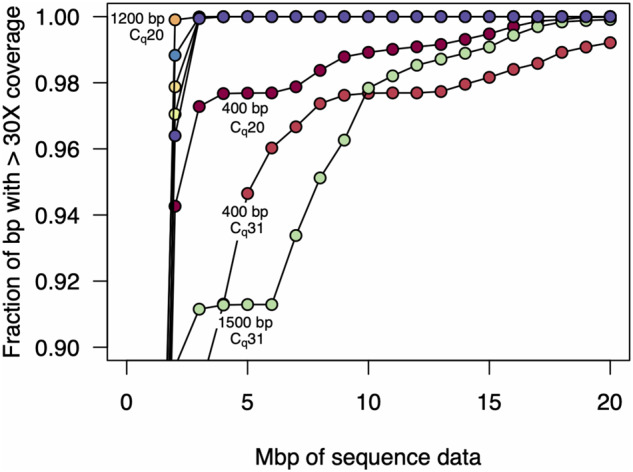
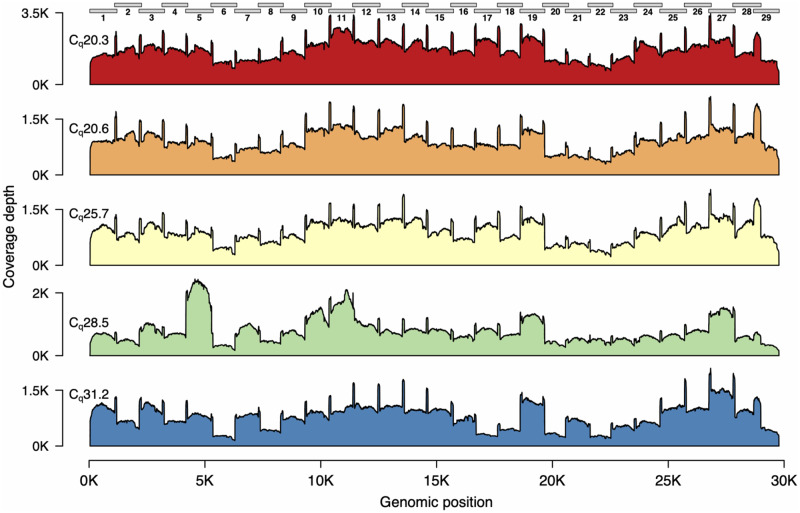
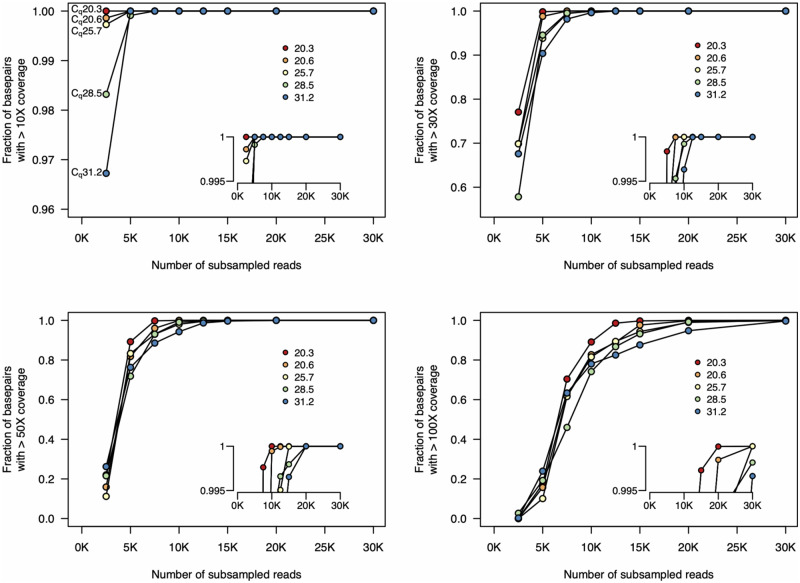
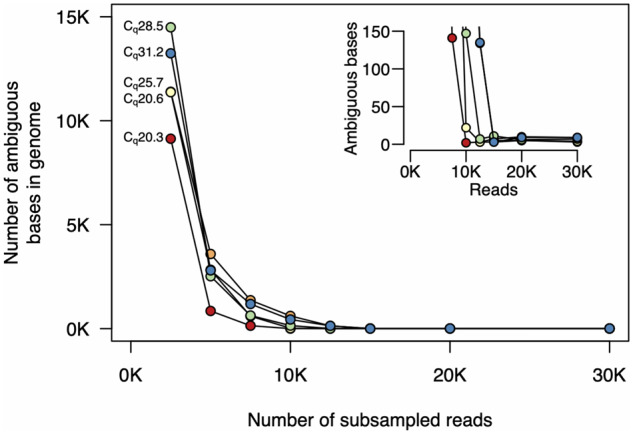
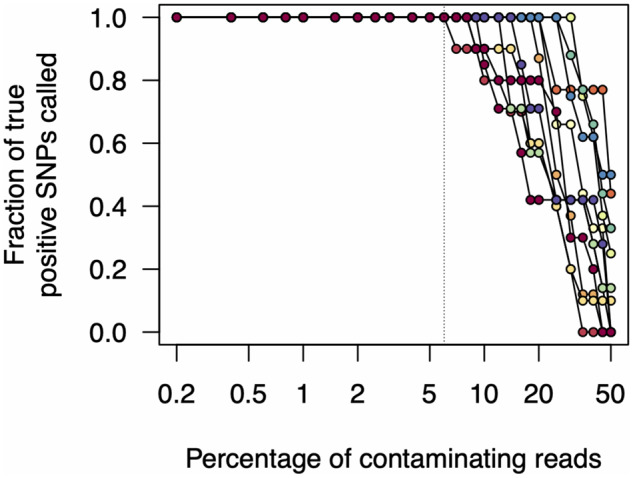
Rapid and cost-efficient whole-genome sequencing of severe acute respiratory syndrome coronavirus 2 (SARS-CoV-2), the virus that causes coronavirus disease 2019, is critical for understanding viral transmission dynamics. Here we show that using a new multiplexed set of primers in conjunction with the Oxford Nanopore Rapid Barcode library kit allows for faster, simpler, and less expensive SARS-CoV-2 genome sequencing. This primer set results in amplicons that exhibit lower levels of variation in coverage compared to other commonly used primer sets. Using five SARS-CoV-2 patient samples with Cq values between 20 and 31, we show that high-quality genomes can be generated with as few as 10 000 reads (∼5 Mbp of sequence data). We also show that mis-classification of barcodes, which may be more likely when using the Oxford Nanopore Rapid Barcode library prep, is unlikely to cause problems in variant calling. This method reduces the time from RNA to genome sequence by more than half compared to the more standard ligation-based Oxford Nanopore library preparation method at considerably lower costs.

Keywords: Nanopore; SARS-CoV-2; amplicon; genome.


Figures

Figure 1:
Figure 1:
SARS-CoV2 genome coverage plots for different amplicon sets.
Figure 2:
Figure 2:
Amount of sequence data required for 30-fold genome coverage. As more sequencing data are collected, a greater fraction of the genome is covered. Here, we plot the amount of data required for 30× coverage, which is similar to the minimum level required for accurate variant calling. For both the high and low Cq samples, the 1200 and 2000 bp amplicon sets achieved >99.9% genome coverage with only 3 Mbp of data, and in the low Cq sample, the 1200 bp amplicon set achieved 99.9% coverage with only 2 Mbp of data. In contrast, the 400 and 1500 bp amplicon sets were more variable in coverage, especially for the high Cq sample. In the case of the 400 bp amplicon set, 99% genome coverage at 30× required 19 Mbp of sequence data, and 99.9% was only achieved with 33 Mbp of sequence data.
Figure 3:
Figure 3:
Genome coverage plots for patient samples varying in Cq values. The plots indicate the genome coverage for the 1200 bp amplicon set for samples with Cq values ranging from 20.3 to 31.2. For all samples, minimum coverage exceeds 50 at all genomic positions (excluding the 5′- and 3′-UTR). Note that the scale of the y-axes varies between plots. The locations of the amplicons are indicated above the first plot.
Figure 4:
Figure 4:
Fraction of genome covered at different sequencing depths. We subsampled from the complete set of unfiltered reads and mapped these reads to the reference sequence. For all five samples, 30× coverage of all genomic positions is achieved with only 12.5 K reads. And 50× coverage at all genomic positions is achieved with <20 K reads. Insets show genome coverage levels at the top end of the y-axis (range from 0.995 to 1). Each line indicates the coverage for one sample. Insets show higher resolution at the upper limit of the y-axis. The colours of each sample on these plots are the same as those in Fig. 3. Note that the scale of the y-axis in the top left plot differs from the others.
Figure 5:
Figure 5:
Numbers of ambiguous bases at different sequencing depths. We subsampled reads and used the filtering and assembly steps of the ARTIC Network bioinformatics pipeline. For all samples, <10 ambiguous bases remain after subsampling to 15 000 reads. For samples with lower Cq, only 10 000 reads are required. The inset plot shows higher resolution at the lower end of the y-axis. The colours of each sample on these plots are the same as those in Figs 3 and 4.
Figure 6:
Figure 6:
Effects of read contamination on SNP call rate. We simulated read contamination by mixing reads between all pairwise combinations of samples (see main text). We then calculated the fraction of true positive SNP calls from these contaminated read sets. Note that the x-axis is on a log scale.

References

    1. Manning JE, Bohl JA, Lay S. et al. Rapid metagenomic characterization of a case of imported COVID-19 in Cambodia. bioRxiv 2020:2020.03.02.968818.
    1. Gohl DM, Garbe J, Grady P. et al. A Rapid, Cost-Effective Tailed Amplicon Method for Sequencing SARS-CoV-2. bioRxiv2020, doi: 10.1101/2020.05.11.088724. - PMC - PubMed
    1. Moore SC, Penrice-Randal R, Alruwaili M. et al. Amplicon based MinION sequencing of SARS-CoV-2 and metagenomic characterisation of nasopharyngeal swabs from patients with COVID-19. medRxiv2020, doi: 10.1101/2020.03.05.20032011. - PMC - PubMed
    1. Itokawa K, Sekizuka T, Hashino M. et al. A proposal of alternative primers for the ARTIC Network’s multiplex PCR to improve coverage of SARS-CoV-2 genome sequencing. BioRxiv2020, doi: 10.1101/2020.03.10.985150.
    1. Resende PC, Motta FC, Roy S. et al. SARS-CoV-2 genomes recovered by long amplicon tiling multiplex approach using nanopore sequencing and applicable to other sequencing platforms. bioRxiv2020, doi: 10.1101/2020.04.30.069039.