. 2021 Aug 1;105(8):1825-1839.
doi: 10.1097/TP.0000000000003478.

FOXP3 mRNA Profile Prognostic of Acute T Cell-mediated Rejection and Human Kidney Allograft Survival

Affiliations

FOXP3 mRNA Profile Prognostic of Acute T Cell-mediated Rejection and Human Kidney Allograft Survival

Danny Luan et al. Transplantation. .

Abstract

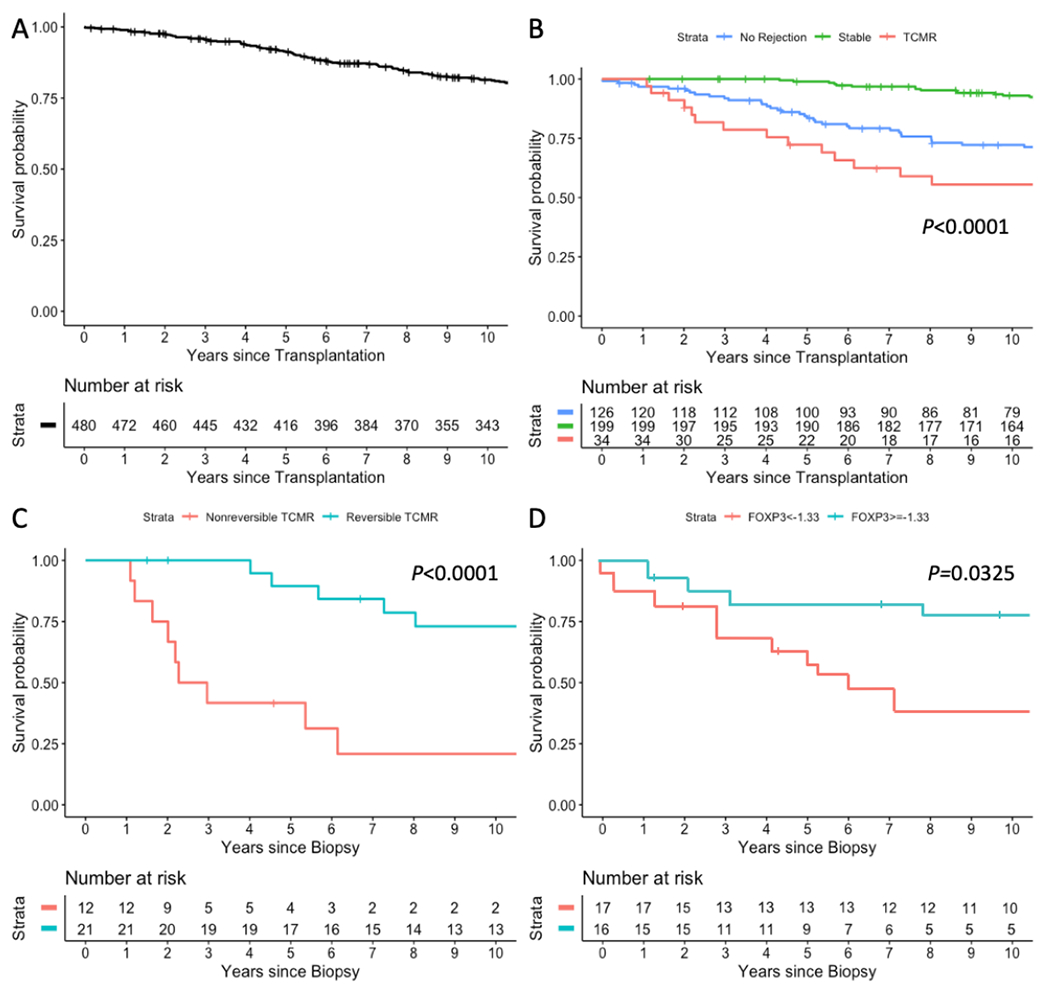
Background: T cell-mediated rejection (TCMR) is the most frequent type of acute rejection and is associated with kidney allograft failure. Almost 40% of TCMR episodes are nonresponsive to therapy, and molecular mechanisms for the nonresponsiveness are unknown. Our single-center study identified that urinary cell FOXP3 mRNA abundance predicts TCMR reversibility and allograft survival.

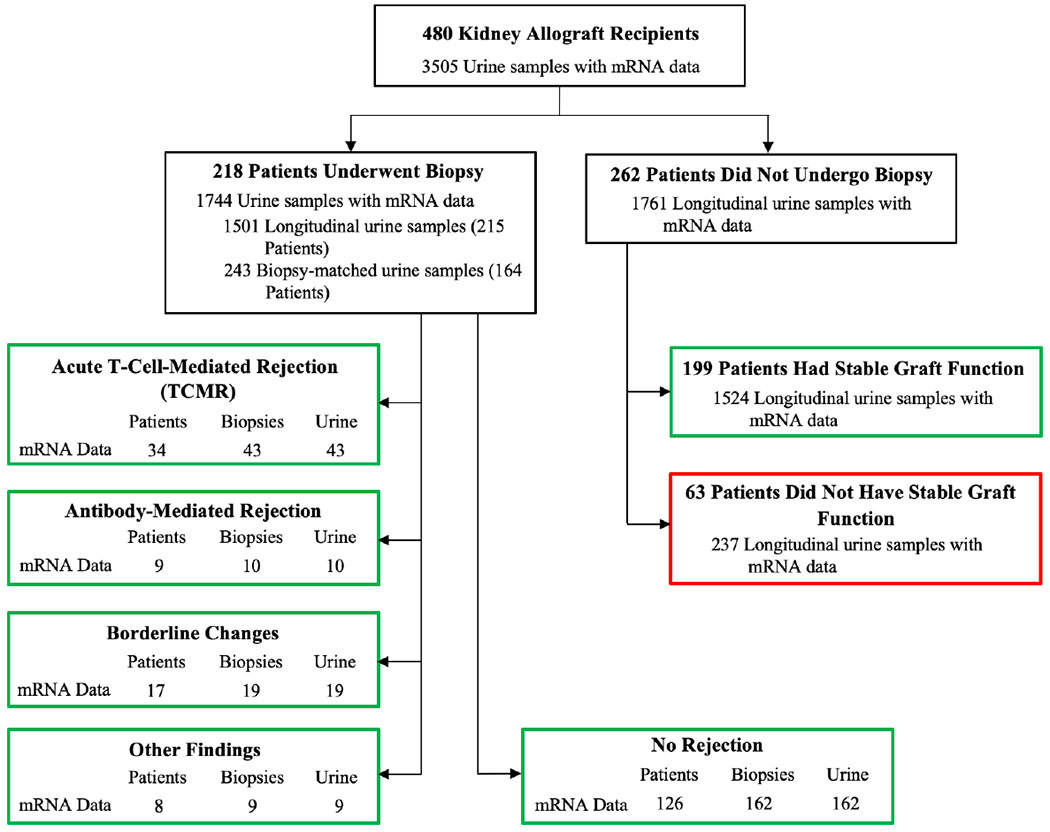
Methods: We developed PCR assays and measured absolute copy numbers of transcripts for FOXP3, CD25, CD3E, perforin, and 18S rRNA in 3559 urines from 480 kidney allograft recipients prospectively enrolled in the multicenter Clinical Trials in Organ Transplantation-04. In this replication study, we investigated the association between mRNA profile and TCMR diagnosis, TCMR reversibility, and allograft survival.

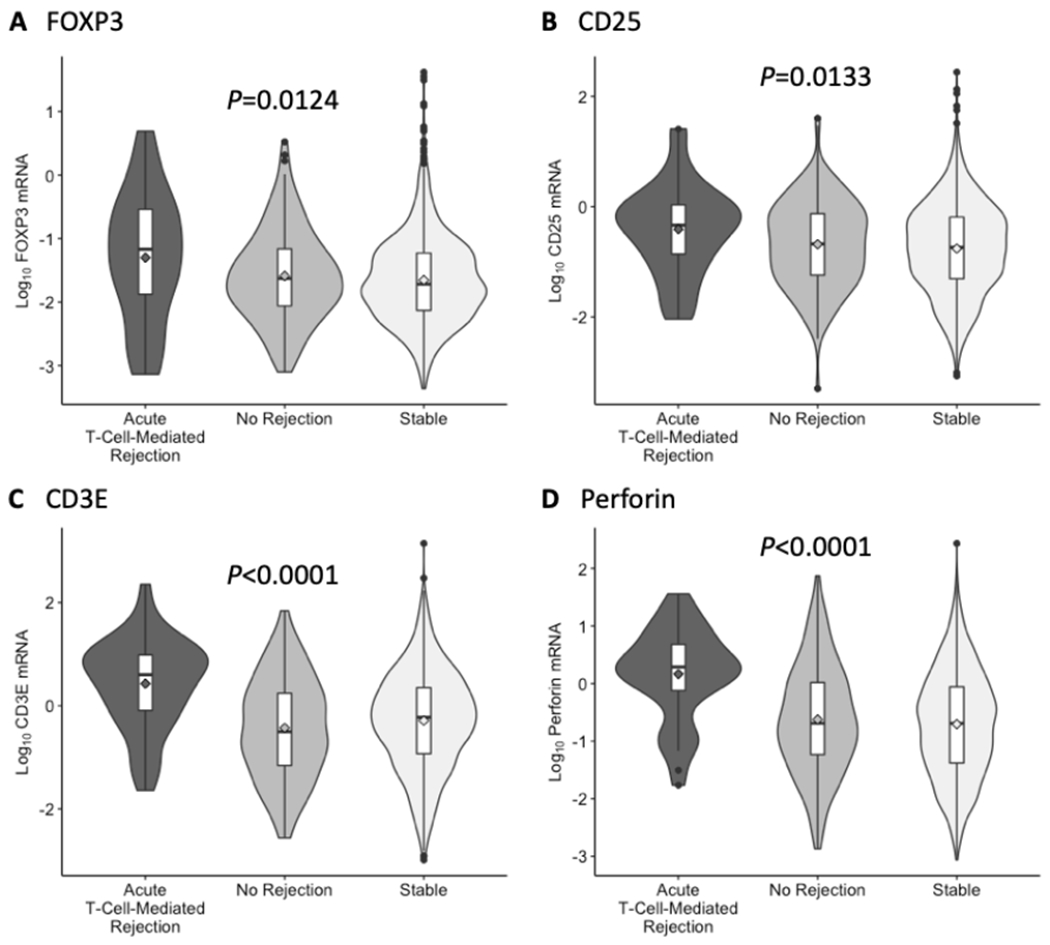
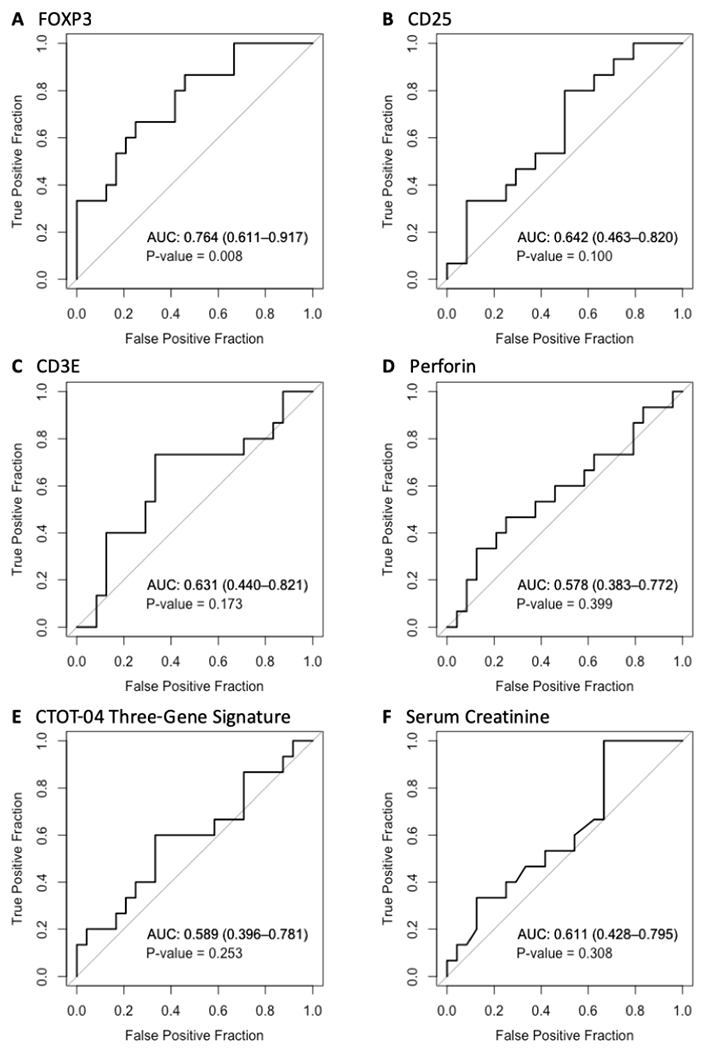
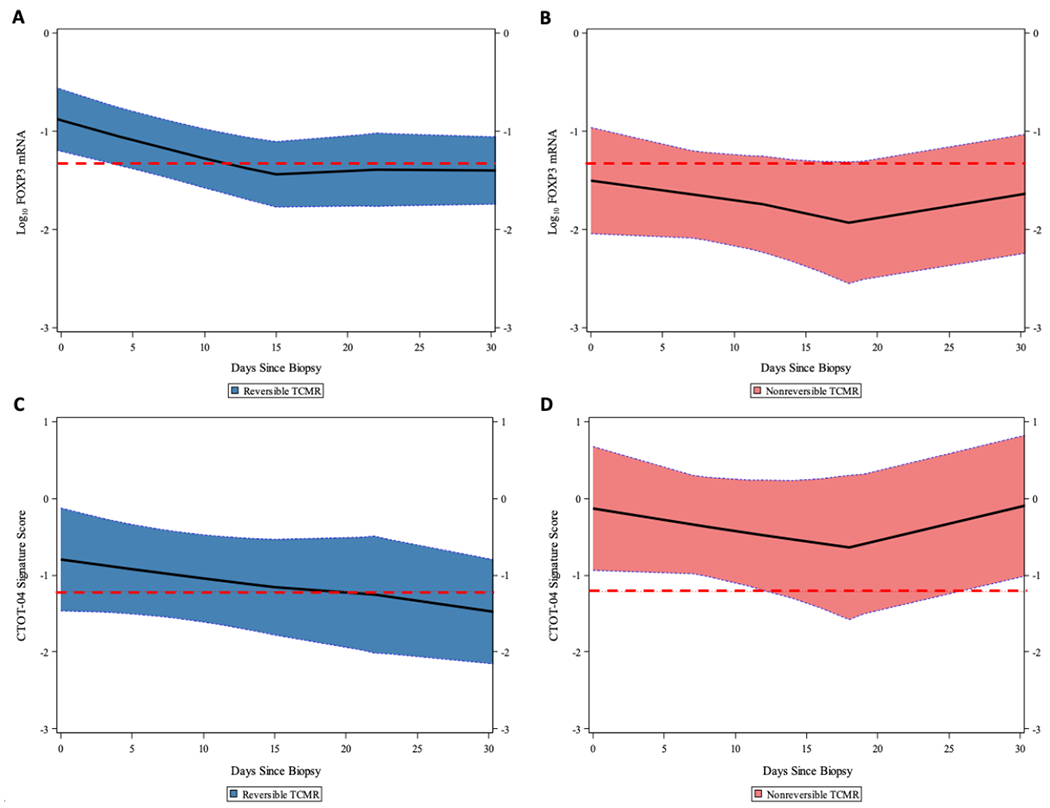
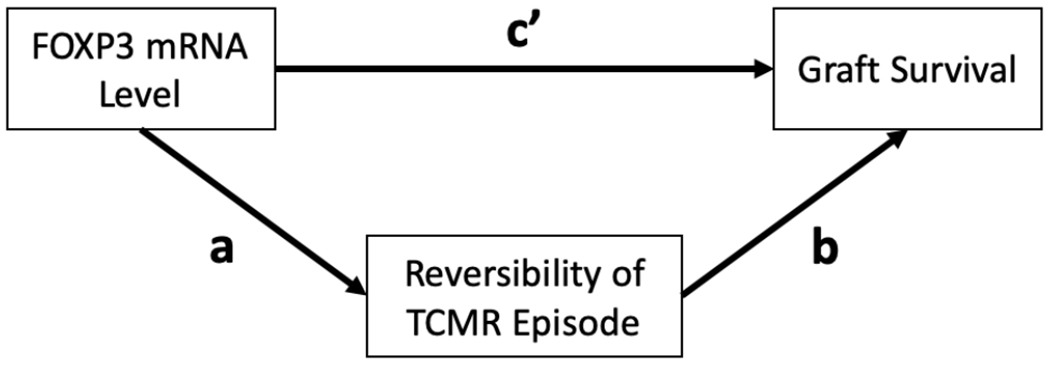
Results: 18S rRNA normalized levels of mRNA for FOXP3 (P = 0.01, Kruskal-Wallis test), CD25 (P = 0.01), CD3E (P < 0.0001), and perforin (P < 0.0001) were diagnostic of TCMR, but only FOXP3 mRNA level predicted TCMR reversibility (ROC AUC = 0.764; 95% confidence interval, 0.611-0.917; P = 0.008). Multivariable logistic regression analyses showed that urinary cell FOXP3 mRNA level predicted reversal, independent of clinical variables. A composite model of clinical variables and FOXP3 mRNA (AUC = 0.889; 95% CI, 0.781-0.997; P < 0.001) outperformed FOXP3 mRNA or clinical variables in predicting TCMR reversibility (P = 0.01, likelihood ratio test). Multivariable Cox proportional hazards regression analyses showed that FOXP3 mRNA level predicts kidney allograft survival (P = 0.047) but not after controlling for TCMR reversal (P = 0.477).

Conclusions: Urinary cell level of FOXP3 mRNA is diagnostic of TCMR, predicts TCMR reversibility, and is prognostic of kidney allograft survival via a mechanism involving TCMR reversal.


Conflict of interest statement

M.S. has a Consultancy Agreement with CareDx, Inc., Brisbane, CA, and with Sparks Therapeutics, Philadelphia, PA. The other authors of this manuscript declare no conflicts of interest.

Figures

Figure 1.
Figure 1.
Patients, biopsy results, and urine samples. The distribution of 3505 urine samples from 480 kidney allograft recipients enrolled in the CTOT-04 study is shown. The number of patients with biopsy-matched urine samples (urine collected from 3 days before to 1 day after biopsy) are shown for patients with Banff TCMR grade 1A or higher, AMR, Borderline Changes, Other Findings, and those without any rejection features in their biopsies (No Rejection). Among patients who did not undergo a biopsy, 199 patients met criteria for stable graft function based on (i) average of recorded serum creatinine values at 6, 9, and 12 months ≤ 2.0 mg/dl, (ii) no graft loss or death, (iii) no treatment for acute rejection, and (iv) no evidence of cytomegalovirus or polyomavirus type BK infection during the first 12 months posttransplantation and contributed 1524 urine samples. Sixty-three patients failed to meet criteria for stable graft function and contributed 237 urine specimens. Green boxes represent samples included in this study, whereas the red box represents samples not included in the data analysis.
Figure 2.
Figure 2.
Levels of mRNA in urinary cells. Violin plots with in-laid box-and-whisker plots show the distribution of log10-transformed ratios of mRNA copies to 18S ribosomal RNA (rRNA) copies (x10−6) for FOXP3, CD25, CD3E, and perforin in 43 urine samples matched to 43 biopsy specimens (from 34 subjects) diagnosed as acute T-cell–mediated rejection, 162 urine samples matched to 162 biopsy specimens (from 126 subjects) without any rejection features in the biopsy (No Rejection), and 1524 urine samples collected longitudinally from 199 subjects with stable graft function who did not undergo biopsy (Stable). The in-laid box-and-whisker plots display the 25th, 50th, and 75th percentile values via the bottom, middle, and top lines in the box, respectively, and the 10th and 90th percentile values via the ends of the bottom and top whiskers, respectively; the diamonds represent the mean and circles indicate outliers. The violin plots display the distribution and spread of observations in each diagnostic group. The P-value from the Kruskal-Wallis test of the null hypothesis of no group differences in the distributions is presented above each set of violin plots.
Figure 3.
Figure 3.
Receiver-operating-characteristic (ROC) curve analyses for TCMR reversal. ROC curves for (A) 18S ribosomal RNA (rRNA) normalized FOXP3 mRNA; (B) 18S rRNA normalized CD25 mRNA; (C) 18S rRNA normalized CD3E mRNA; (D) 18S rRNA normalized perforin mRNA; (E) the CTOT-04 3-gene TCMR diagnostic signature (calculated from 18S rRNA normalized CD3E and IP-10 mRNAs and 18S rRNA); and (F) serum creatinine level measured at time of TCMR biopsy. In addition to the ROC curve (a plot of the fraction of true positive results [sensitivity] and the fraction of false positive results [1- specificity] for discriminating reversal versus nonreversal of an episode of TCMR using different thresholds of a predictor), each panel gives the area under the receiver operating characteristic curve (AUC) with its 95% confidence interval and the P-value for the test of the null hypothesis that the AUC=0.5. An AUC value of 0.5 is no better than that expected by chance (the null hypothesis) whereas a value of 1.0 reflects a perfect discriminator. P-values are obtained from Wald tests from logistic regression analyses predicting reversible status from the measure of interest. Among the variables tested, only urinary cell FOXP3 mRNA level, measured at the time of biopsy, predicted TCMR reversal (ROC AUC: 0.764, 95%CI, 0.611 to 0.917, P=0.008).
Figure 4.
Figure 4.
Prospective trajectories of 18S rRNA normalized FOXP3 mRNA level and CTOT-04 3-gene TCMR diagnostic signature score as a function of time since TCMR biopsy. The loess-smoothed average within-person trajectories and 95% confidence bands of the urinary cell log10-transformed, 18S rRNA normalized FOXP3 mRNA level and the median score of CTOT-04 3-gene TCMR diagnostic signature are shown for the reversible TCMR group (A, C) and the nonreversible TCMR group (B, D). Levels of mRNA in 81 urines from 21 patients with reversible TCMR and 43 urines from 12 patients with nonreversible TCMR were used to generate the prospective trajectories. (A) The median level of urinary cell FOXP3 mRNA at the time of TCMR biopsy was significantly higher in patients with reversible TCMR than in patients with nonreversible TCMR. The prospective trajectory in the reversible TCMR group started above the −1.33 threshold (for discriminating reversible from nonreversible TCMR) at time of TCMR biopsy and remained close to the threshold throughout the 30 days after the biopsy. (B) The prospective trajectory in patients with nonreversible TCMR started below the threshold at time of TCMR biopsy and remained well below the threshold through 30 days after the biopsy. (C) The prospective trajectory of the CTOT-04 3-gene TCMR diagnostic signature at time of TCMR biopsy did not differ significantly between those with reversible TCMR or nonreversible TCMR. Among the patients with reversible TCMR, the average score decreased from time of TCMR biopsy and crossed the diagnostic threshold of −1.213 within 15 days of initiation of antirejection therapy. (D) The CTOT-04 3-gene TCMR diagnostic signature prospective trajectory remained consistently above the threshold among the patients with nonreversible TCMR.
Figure 5.
Figure 5.
Kaplan-Meier kidney allograft survival curves. (A) Survival curve, from time of transplantation, for the entire cohort of 480 kidney allograft recipients (patients); (B) Survival curves, from time of transplantation, for the 199 patients with stable graft function (Stable), for the 126 patients with 162 biopsies showing no rejection features in their biopsies (No Rejection) and for the 34 patients with 43 biopsies classified as TCMR Banff grade IA or higher (TCMR); (C) Survival curves of 33 patients, from time of TCMR biopsy, stratified by TCMR reversibility status. One patient with BKVN diagnosis in close proximity to TCMR could not be classified as reversible or nonreversible TCMR and is excluded in this analysis; (D) Survival curves for the 33 patients, from the time of biopsy, stratified by log10-transformed 18S rRNA normalized FOXP3 mRNA threshold of −1.33 for TCMR reversal. The patient with BKVN diagnosis in close proximity to TCMR is excluded in this analysis. Time to event was calculated from date of TCMR biopsy (or the date of last TCMR biopsy for the 3 patients with multiple episodes) until graft failure or last follow-up date. Subjects were censored if they experienced death prior to graft failure or were lost to follow-up. P-values are based on log-rank tests. At-risk tables are shown in each plot, just above the X-axis.
Figure 6.
Figure 6.
Proposed mechanism for the association between urinary cell FOXP3 mRNA abundance and kidney allograft outcome. FOXP3 mRNA level may impact graft outcome via TCMR reversal (path a), through a direct effect that is independent of its effect on TCMR reversal (path c’) or both. Data analysis showing that: i) after adjustment for covariates, FOXP3 mRNA level is significantly associated with TCMR reversibility (a-path; OR=3.88; 95% CI, 1.28 −11.8, P=0.0168); (ii) TCMR reversible status is significantly associated with graft survival after adjustment for FOXP3 mRNA level and covariates (path b; HR=0.21; 95% CI, 0.06-0.73; P=0.0139) and (iii) the association between FOXP3 mRNA level and graft survival is negligible after adjustment for TCMR reversibility (path cȲ; HR=0.78; 95% CI, 0.39-1.56; P=0.4771) support the hypothesis that the association of FOXP3 mRNA level with graft outcome is primarily mediated through TCMR reversal.

Comment in

References

    1. Opelz G, Döhler B; Collaborative Transplant Study Report. Influence of time of rejection on long-term graft survival in renal transplantation. Transplantation. 2008;85(5):661–666. doi:10.1097/TP.0b013e3181661695 - DOI - PubMed
    1. El Ters M, Grande JP, Keddis MT, et al. Kidney allograft survival after acute rejection, the value of follow-up biopsies. Am J Transplant. 2013;13(9):2334–2341. doi:10.1111/ajt.12370 - DOI - PubMed
    1. Hricik DE, Nickerson P, Formica RN, et al. Multicenter validation of urinary CXCL9 as a risk-stratifying biomarker for kidney transplant injury. Am J Transplant. 2013;13(10):2634–2644. doi:10.1111/ajt.12426 - DOI - PMC - PubMed
    1. Suthanthiran M, Schwartz JE, Ding R, et al. Urinary-cell mRNA profile and acute cellular rejection in kidney allografts. N Engl J Med. 2013;369(1):20–31. doi:10.1056/NEJMoa1215555 - DOI - PMC - PubMed
    1. Bouatou Y, Viglietti D, Pievani D, et al. Response to treatment and long-term outcomes in kidney transplant recipients with acute T cell-mediated rejection. Am J Transplant. 2019;19:1972–1988. doi:10.1111/ajt.15299 - DOI - PubMed

Publication types

MeSH terms