. 2020 Oct 8;18(10):e3000859.
doi: 10.1371/journal.pbio.3000859. eCollection 2020 Oct.

Network analysis of transcriptomic diversity amongst resident tissue macrophages and dendritic cells in the mouse mononuclear phagocyte system

Affiliations

Network analysis of transcriptomic diversity amongst resident tissue macrophages and dendritic cells in the mouse mononuclear phagocyte system

Kim M Summers et al. PLoS Biol. .

Abstract

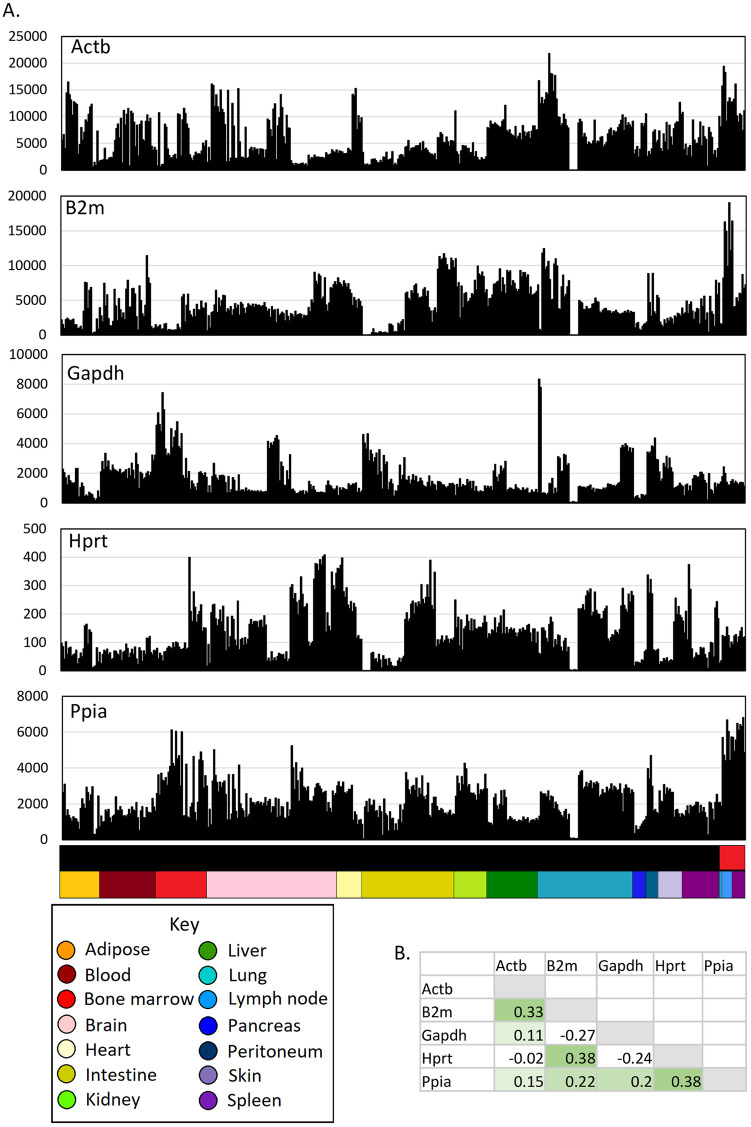
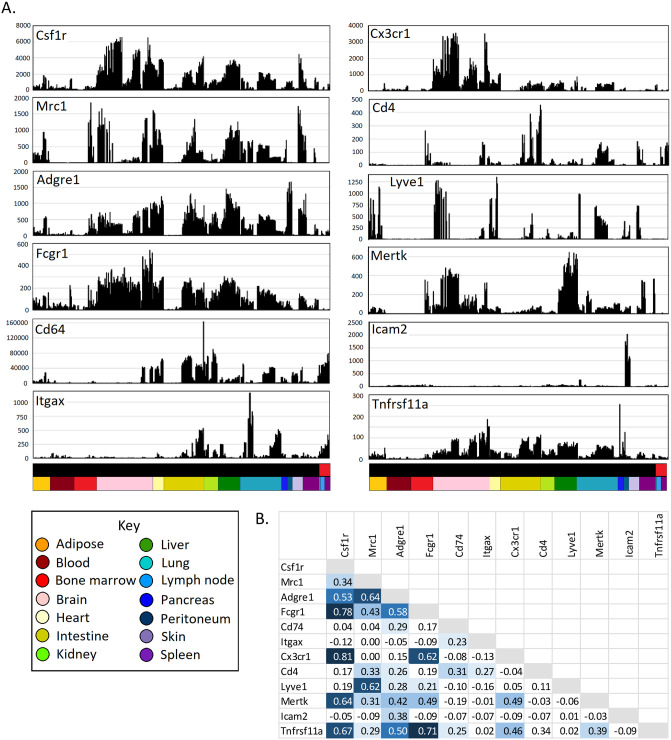
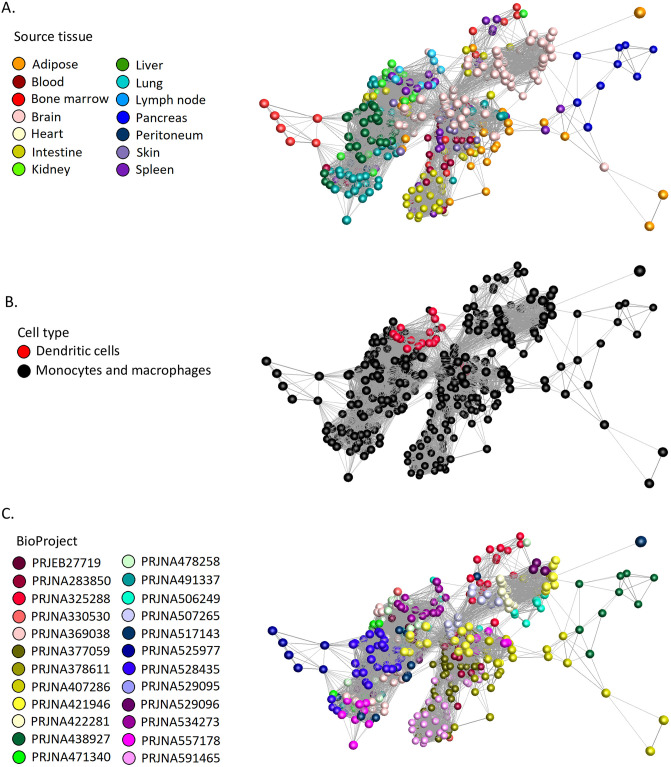
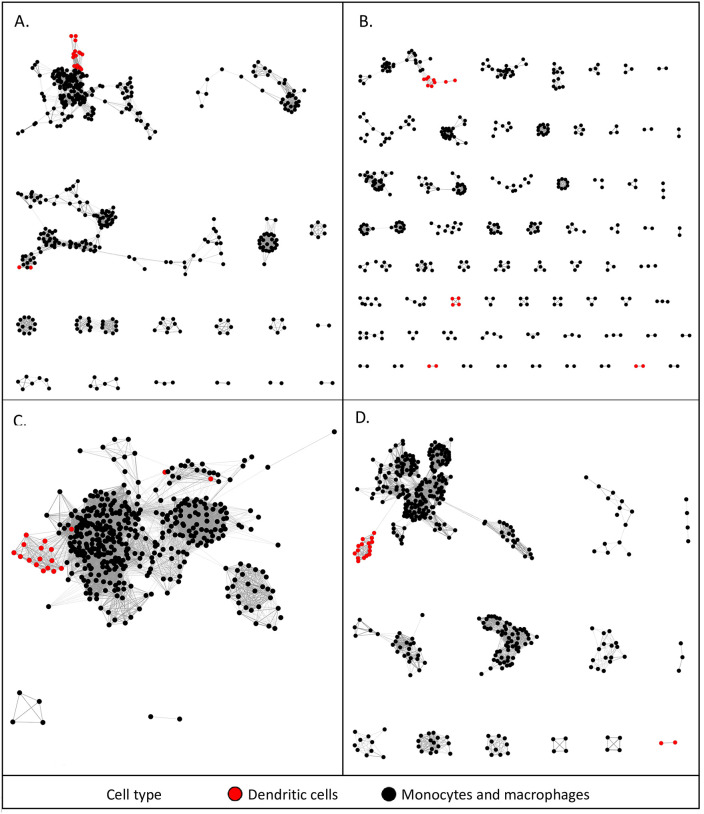
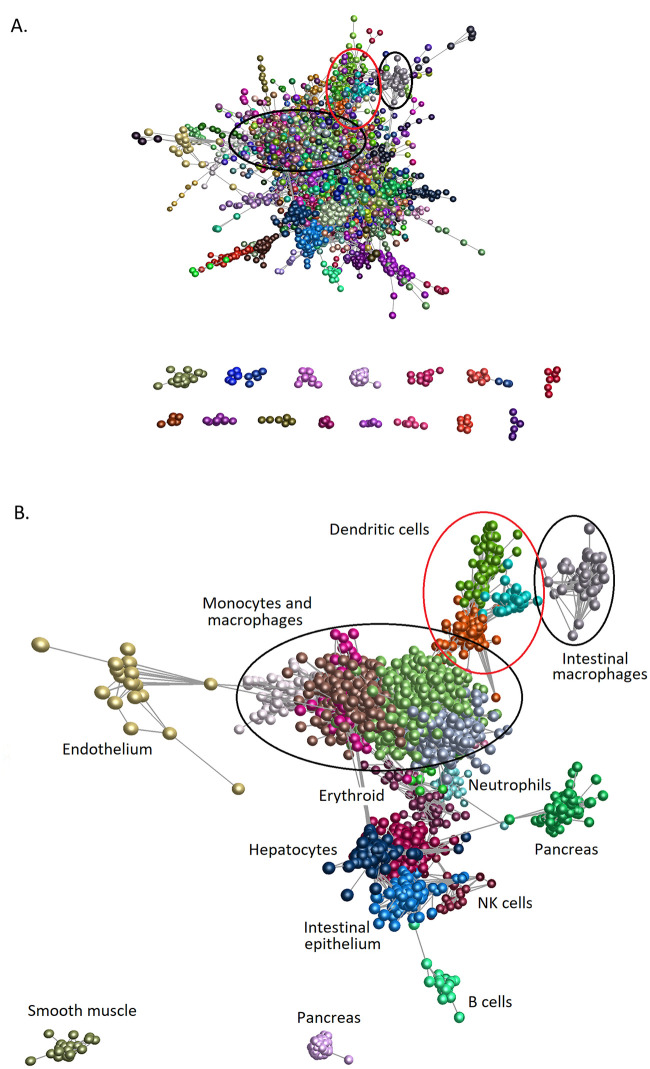
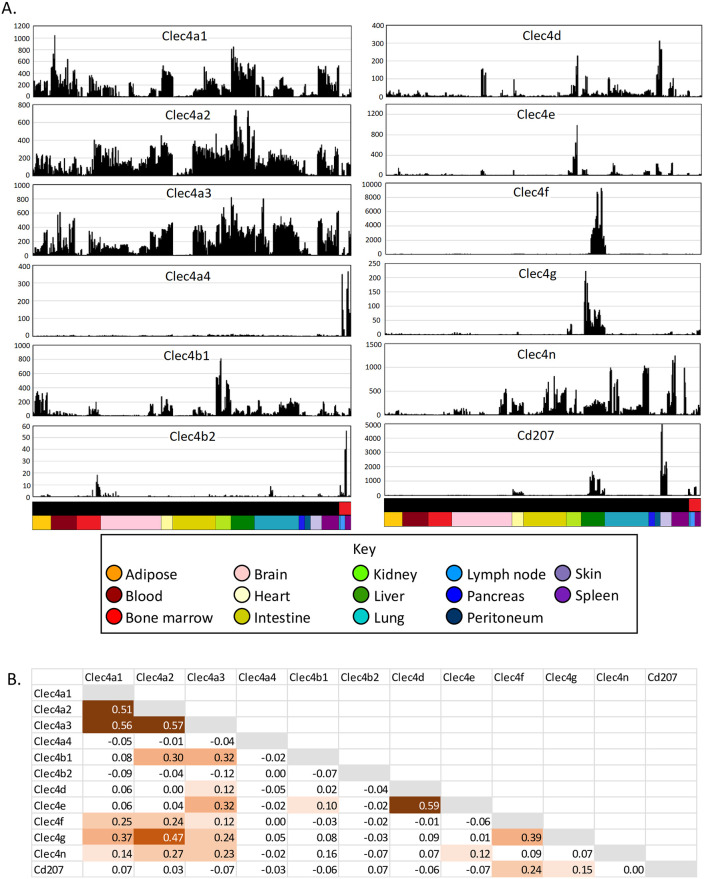
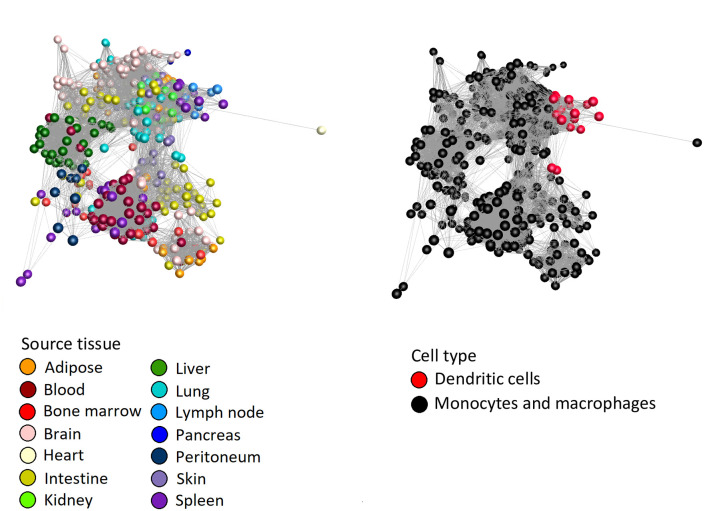
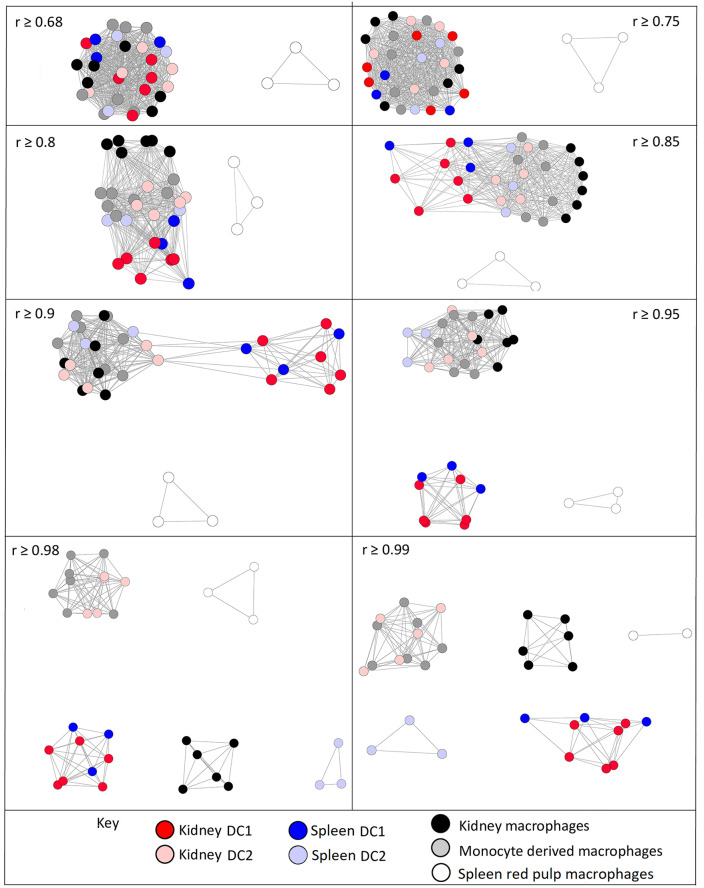
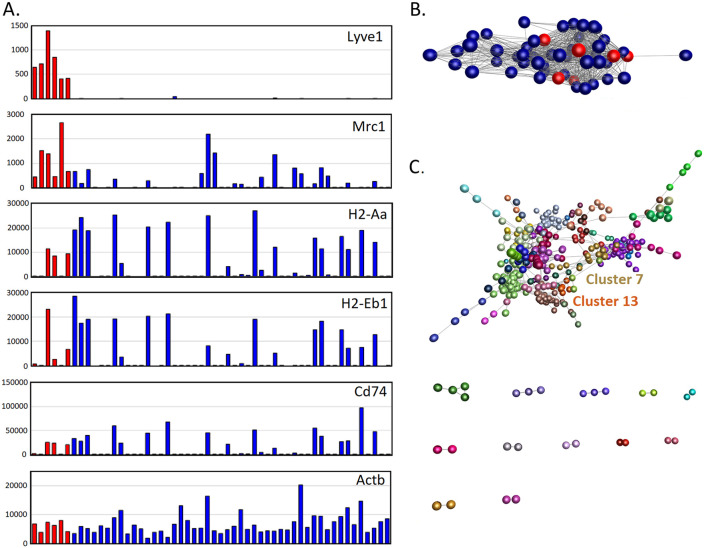
The mononuclear phagocyte system (MPS) is a family of cells including progenitors, circulating blood monocytes, resident tissue macrophages, and dendritic cells (DCs) present in every tissue in the body. To test the relationships between markers and transcriptomic diversity in the MPS, we collected from National Center for Biotechnology Information Gene Expression Omnibus (NCBI-GEO) a total of 466 quality RNA sequencing (RNA-seq) data sets generated from mouse MPS cells isolated from bone marrow, blood, and multiple tissues. The primary data were randomly downsized to a depth of 10 million reads and requantified. The resulting data set was clustered using the network analysis tool BioLayout. A sample-to-sample matrix revealed that MPS populations could be separated based upon tissue of origin. Cells identified as classical DC subsets, cDC1s and cDC2s, and lacking Fcgr1 (encoding the protein CD64) were contained within the MPS cluster, no more distinct than other MPS cells. A gene-to-gene correlation matrix identified large generic coexpression clusters associated with MPS maturation and innate immune function. Smaller coexpression gene clusters, including the transcription factors that drive them, showed higher expression within defined isolated cells, including monocytes, macrophages, and DCs isolated from specific tissues. They include a cluster containing Lyve1 that implies a function in endothelial cell (EC) homeostasis, a cluster of transcripts enriched in intestinal macrophages, and a generic lymphoid tissue cDC cluster associated with Ccr7. However, transcripts encoding Adgre1, Itgax, Itgam, Clec9a, Cd163, Mertk, Mrc1, Retnla, and H2-a/e (encoding class II major histocompatibility complex [MHC] proteins) and many other proposed macrophage subset and DC lineage markers each had idiosyncratic expression profiles. Coexpression of immediate early genes (for example, Egr1, Fos, Dusp1) and inflammatory cytokines and chemokines (tumour necrosis factor [Tnf], Il1b, Ccl3/4) indicated that all tissue disaggregation and separation protocols activate MPS cells. Tissue-specific expression clusters indicated that all cell isolation procedures also co-purify other unrelated cell types that may interact with MPS cells in vivo. Comparative analysis of RNA-seq and single-cell RNA-seq (scRNA-seq) data from the same lung cell populations indicated that MPS heterogeneity implied by global cluster analysis may be even greater at a single-cell level. This analysis highlights the power of large data sets to identify the diversity of MPS cellular phenotypes and the limited predictive value of surface markers to define lineages, functions, or subpopulations.


Conflict of interest statement

The authors have declared that no competing interests exist.

Figures

Fig 1
Fig 1. Expression of housekeeping genes across MPS cell populations.
The data underlying this Figure can be found in S1 Data. (A) Expression patterns across cells from different tissues. Each column represents a sample. Upper bar along the X axis shows the cell type (black—monocytes and macrophages; red—DCs). Lower bar shows the tissue, coloured as shown in the key. Y axis shows expression level in TPM, calculated using Kallisto. (B) Correlations (Pearson correlation coefficient) between expression patterns of different housekeeping genes. DC, dendritic cell; MPS, mononuclear phagocyte system; TPM, transcripts per million.
Fig 2
Fig 2. Expression of cell surface marker genes across MPS populations.
The data underlying this Figure can be found in S1 Data. (A) Expression patterns across cells from different tissues. Each column represents a sample. Upper bar along the X axis shows the cell type (black—monocytes and macrophages; red—DCs). Lower bar shows the tissue, coloured as shown in the key. Y axis shows expression level in TPM, calculated using Kallisto. (B) Correlations (Pearson correlation coefficient) between expression patterns of different MPS genes. DC, dendritic cell; MPS, mononuclear phagocyte system; TPM, transcripts per million.
Fig 3
Fig 3. Sample-to-sample network analysis of gene expression in MPS cell populations.
Each sphere (node) represents a sample, and lines between them (edges) show Pearson correlations between them of ≥0.68 (the maximum value that included all 466 samples). (A) Samples coloured by tissue of origin. (B) Samples coloured by cell type. (C) Samples coloured by BioProject. MPS, mononuclear phagocyte system.
Fig 4
Fig 4. Sample-to-sample 2D network analysis of gene expression in monocyte, macrophage, and DC populations.
Each sphere (node) represents a sample, and lines between them (edges) show Pearson correlations between them. (A) Network laid out at Pearson correlation coefficient of ≥0.85. The network includes 458 samples. (B) Network laid out at Pearson correlation coefficient of ≥0.95. The network includes 418 samples. (C) Network laid out at Spearman correlation coefficient of ≥0.85. The network includes 443 samples. (D) Network laid out at Spearman correlation coefficient of ≥0.9. The network includes 427 samples. The networks with nodes coloured by tissue and BioProject are shown in S2–S5 Figs. DC, dendritic cell.
Fig 5
Fig 5. GCN analysis of gene expression in MPS cell populations.
Each sphere (node) represents a gene, and lines between them (edges) show Pearson correlations between them of ≥0.75. Nodes were grouped into clusters with related expression patterns using the MCL algorithm with an inflation value of 1.7. Lists of genes and expression profiles of clusters are presented in S2 Data. (A) The network generated by the BioLayout analysis. Elements with ≥5 nodes are shown. Nodes are coloured by MCL cluster. Lists of genes and average expression profiles for all clusters are presented in S2 Data. Monocyte and macrophage genes (black ovals), DC genes (red oval). (B) Network showing only major clusters of monocyte and macrophage genes (black ovals), DC genes (red oval), and other cell types. DC, dendritic cell; GCN, gene coexpression network; MCL, Markov clustering algorithm; MPS, mononuclear phagocyte system; NK cell, natural killer cell.
Fig 6
Fig 6. Expression of members of the DCIR (CLEC4) family across MPS cell populations.
(A) Expression patterns across cells from different tissues. Each column represents a sample. Upper bar along the X axis shows the cell type (black—monocytes and macrophages; red—DCs). Lower bar shows the tissue, coloured as shown in the key. Y axis shows expression level in TPM, calculated using Kallisto. (B) Correlations (Pearson correlation coefficient) between expression patterns of different Clec4 genes. DC, dendritic cell; DCIR, DC immunoreceptor; MPS, mononuclear phagocyte system; TPM, transcripts per million.
Fig 7
Fig 7. Network analysis of transcription factor gene expression in MPS cell populations.
The sample-to-sample network was generated by BioLayout analysis at r ≥ 0.66, which included all 466 samples. Nodes representing samples are coloured by source tissue (left) and cell type (right). Lists of genes and expression profiles of clusters at different r values are presented in S3 Data. MPS, mononuclear phagocyte system.
Fig 8
Fig 8. Sample-to-sample 2D network analysis of gene expression in macrophage and DC subpopulations from kidney and spleen.
The sample-to-sample network was generated by BioLayout analysis at the indicated Pearson r values, which all included all 33 samples up to r ≥ 0.98. Above r ≥ 0.98, 1 red pulp macrophage sample was lost. Red, kidney DC1; pink, kidney DC2; dark blue, spleen DC1; light blue, spleen DC2; black, kidney macrophages; grey, monocyte-derived macrophages; white, spleen red pulp macrophages. Lists of genes and expression profiles of clusters are presented in S4 Data. DC, dendritic cell.
Fig 9
Fig 9. Network analysis of scRNA-seq data.
The reprocessed data and the bulk RNA-seq data for the lung macrophage subpopulations from the same study are available in S5 Data. (A) Expression profiles in single cells for selected genes. Each column represents RNA from a single cell. Y axis shows expression in TPM, calculated using Kallisto. Only the first 6 cells expressed Lyve1 (coloured red). (B) The sample-to-sample network was generated by BioLayout analysis at r ≥ 0.53, which included all 54 single-cell samples. Nodes represent samples; red nodes show the samples with high expression of Lyve1. (C) Gene-to-gene network (r ≥ 0.5), clustered at MCL inflation value of 1.7. Cluster lists and expression profiles are available in S6 Data. MCL, Markov clustering algorithm; RNA-seq, RNA sequencing; scRNA-seq, single-cell RNA-seq; TPM, transcripts per million.

References

    1. van Furth R, Cohn ZA, Hirsch JG, Humphrey JH, Spector WG, Langevoort HL. The mononuclear phagocyte system: a new classification of macrophages, monocytes, and their precursor cells. Bull World Health Organ. 1972;46(6):845–52. - PMC - PubMed
    1. Amit I, Winter DR, Jung S. The role of the local environment and epigenetics in shaping macrophage identity and their effect on tissue homeostasis. Nat Immunol. 2016;17(1):18–25. 10.1038/ni.3325 - DOI - PubMed
    1. Hoeffel G, Ginhoux F. Fetal monocytes and the origins of tissue-resident macrophages. Cell Immunol. 2018;330:5–15. 10.1016/j.cellimm.2018.01.001 - DOI - PubMed
    1. Hoeksema MA, Glass CK. Nature and nurture of tissue-specific macrophage phenotypes. Atherosclerosis. 2019;281:159–67. 10.1016/j.atherosclerosis.2018.10.005 - DOI - PMC - PubMed
    1. Hume DA, Irvine KM, Pridans C. The Mononuclear Phagocyte System: The Relationship between Monocytes and Macrophages. Trends Immunol. 2018;40, 98–112 10.1016/j.it.2018.11.007 - DOI - PubMed

Publication types

MeSH terms