. 2020 Oct 29;183(3):605-619.e22.
doi: 10.1016/j.cell.2020.09.023. Epub 2020 Oct 7.

An Amygdala Circuit Mediates Experience-Dependent Momentary Arrests during Exploration

Affiliations

An Amygdala Circuit Mediates Experience-Dependent Momentary Arrests during Exploration

Paolo Botta et al. Cell. .

Abstract

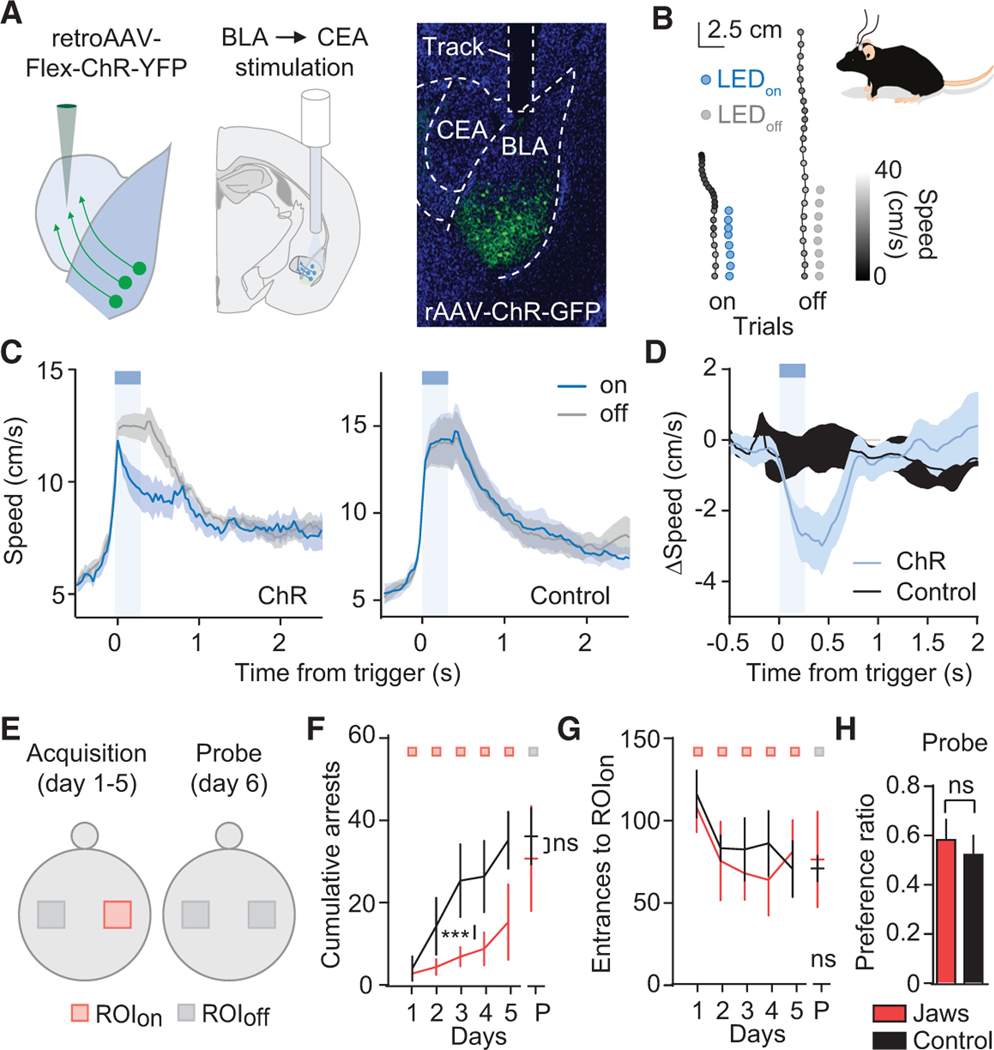
Exploration of novel environments ensures survival and evolutionary fitness. It is expressed through exploratory bouts and arrests that change dynamically based on experience. Neural circuits mediating exploratory behavior should therefore integrate experience and use it to select the proper behavioral output. Using a spatial exploration assay, we uncovered an experience-dependent increase in momentary arrests in locations where animals arrested previously. Calcium imaging in freely exploring mice revealed a genetically and projection-defined neuronal ensemble in the basolateral amygdala that is active during self-paced behavioral arrests. This ensemble was recruited in an experience-dependent manner, and closed-loop optogenetic manipulation of these neurons revealed that they are sufficient and necessary to drive experience-dependent arrests during exploration. Projection-specific imaging and optogenetic experiments revealed that these arrests are effected by basolateral amygdala neurons projecting to the central amygdala, uncovering an amygdala circuit that mediates momentary arrests in familiar places but not avoidance or anxiety/fear-like behaviors.

Keywords: amygdala; experience; exploration; familiarity; latent learning; momentary arrest; movement; novelty.


Conflict of interest statement

Declaration of Interests The authors declare no competing interests.

Figures

Figure 1.
Figure 1.. A BLA Neuronal Ensemble Encodes Self-Paced Behavioral Arrests
(A) Top: behavioral protocol. Bottom: schematic of the dimensionality emergence assay. (B) Daily area explored (percent) divided into quartiles, considering even portions of exploratory time. (C) Left: brain section showing the unilateral AAV1-CAG-FLEX-Tdtomato injection into the BLA of the NL189-cre mouse line. Lines denote the injection site and amygdala borders. The central amygdala (CEA) is shown divided into the lateral (l) and medial (m) part. Right: heatmap of BLA soma density, defined as the number of cells within a 300-μm-diameter sphere. (D) Top: scheme of the mini-endoscope mounted on top of the mouse’s head. Bottom: CNMF-E-processed video of the neurons located in the BLA, with neuronal calcium activity normalized by the max. (E) Top: time course of the activity of single neurons recorded simultaneously in one animal during exploration of the large arena. Center: average population activity of the same animal. Bottom: movement speed during exploration. (F) Time course of the cross-correlation (CC) for the entire neuronal population at different lags (range, −20 to 20 s). (G) Pie chart showing the proportion of CC, anti-CC, and non-CC neurons (for all neurons/all animals; CC, n = 204; anti-CC, n = 670; non-CC, n = 561; total neurons, n = 1,435). (H) Top: average speed of the arrest trials aligned to onset. Bottom: time course of the speed in all arrest trials for all the animals aligned to arrest onset. Time to arrest (0 s) is indicated by a dashed gray line and the purple dot. (I) Top: average raw calcium trace of the entire neuronal NL189BLA population imaged (n = 1,435) at the time of arrest (in arbitrary units, a.u.). Bottom:, Z-score of all NL189BLA single-neuron activities at the time of arrest. (J) Representative trace of a ROC-sorted arrest neuron showing average (top, black line) and single-arrest events (bottom, gray). (K) Top: pie chart of Z-scored and ROC-sorted neurons; positive (+), negative (−), and non-modulated (ns). Bottom: time course of the peak neural activity versus time to arrest. Latency 0 s represents the time to arrest. Data are presented as mean ± SEM.
Figure 2.
Figure 2.. Transient NL189BLA Neuron Activation Decreases Movement and Promotes Arrest
(A) Top left: schematic of patch-clamping in slice to test NL189BLA neurons expressing ChR and YFP. Top right and bottom: differential interference contrast (DIC), fluorescence, and merged image showing patching of a single NL189BLA neuron in slice. (B) Top: 5× stimulation protocol. Bottom: effect of five 10-ms pulses at 20 Hz on neuronal firing (five trials) of a representative NL189BLA neuron. B’: the reliability to elicit firing with one, two, and five pulses at 20 Hz. Scale bars, 10 mV, 40 ms. (C) Schematic injection of a conditional AAV virus expressing ChR2-YFP (top) followed by optical fiber implantation (bottom). (D) Representative coronal section of a mouse injected bilaterally in the BLA with the conditional virus expressing ChR2-YFP and implanted with 200-μm optical fibers. Dashed lines show the fiber track. (E) Acceleration-based closed-loop optogenetic activation protocol. The different colors denote that the animal has to be moving to trigger the trials. (F) Top left: scheme of a mouse with bilateral optical fiber implantation attached to patch cords. Right: two-speed color-coded trajectories for the same time window in light on (left) and off (right, no light pulses) closed-loop trials (5× protocol). Aligned dots (blue for the on trials and gray for the off trials) show triggering of the LED for the 5× protocol (only on trials). (G) Speed in closed-loop trials of two representative animals during light on (on, light blue) or off (off, gray) for the ChR (top) and control (bottom) groups. Scale bar, 4 cm/s. (H–J) Speed in closed-loop trials using three stimulation protocols (1×, H; 2×, I; and 5×, J; n = 7 [ChR group] and n = 5 [control group]); two-way ANOVA repeated measures using the normalized speed. Multiple comparisons show that the start of the effect (on versus off) is well before 1 s with the 5× protocol (560 ms; black arrows show the statistical effect). Stimulation 2× caused a similar decrease in speed (from 500 ms to 1 s), whereas a 10-ms pulse caused a lesser but still significant effect on speed around 400 ms from the start of the stimulation. (K) Left: Δspeed amplitude (on-off trial speed) elicited by the 5× stimulation protocol. Binning, 500 ms. Right: Δspeed amplitude (on-off trial speed during 2 s from starting the stimulation) elicited by the three stimulation protocols. The ChR group is shown in blue, whereas the control group is shown in black. *p < 0.05 and **p < 0.01 by unpaired t test for three different stimulation protocols (ChR versus control group). (L) Binned raw speed in ChR and control animals during the 5× stimulation protocol. (M) Left to right: cumulative arrests after 1×, 2×, and 5× stimulation in the ChR and control groups. The p values were calculated with unpaired two-tailed t test from 0–4 s. (N) Optogenetic stimulation during movement using different pulse numbers at 20 Hz (n = 7 animals for 1×–5× pulses; n = 5 for 10×–40× pulses). The bottom x axis refers to the duration of stimulation. The top x axis shows the number of pulses of light (10-ms length) that were delivered. The inter-stimulation interval was about 60 s. Data are presented as mean ± SEM.
Figure 3.
Figure 3.. Inhibition of NL189BLA Neurons Facilitates Movements
(A) Top: 5× magnification of a slice in the patch-clamp chamber, held by a platinum anchor (black bar), showing expression of Jaws and Tdtomato in the BA. Bottom: 40× magnification showing the recording from a single NL189BLA neuron in slice. Blue lines show the patch pipette. (B) Top: raster plot of firing elicited by a step of current in a NL189BLA neuron with 2 s of 630-nm light. Center: single firing trace from the raster plot. Bottom: average firing rate in 500-ms bins of light-induced inhibition (n = 6 neurons). (C) Top inset: schematic of a mouse mounted with an nVoke mini-microscope to simultaneously image neuronal activity and elicit red-shifted opsin activation with 5 s of light and 15-s inter-trial interval (ITI). Center: representative neuronal calcium activity trials before, during, and after light inhibition in vivo. Scale bar, 1 Z-score. Bottom” area under the ROC (auROC) activity time course as shown in (B) but for in vivo imaging (n = 5 neurons). (D) Representative coronal slice using a conditional AAV virus expressing Jaws and Tdtomato. (E) Two-speed color-coded trajectories in on (top) and off (bottom) closed-loop trials. LEDon is shown in red circles. As shown in Figure 2, triggering of the light is caused by a moment of 100-ms acceleration (when animals are moving), with a variable ITI of ~15 s. (F) Closed loop as for Figure 2 but triggering 2 s of 630-nm light for Jaws (n = 5) and control (n = 4). (G) Change in speed between on (pink, F) and off trials (gray, F) for the Jaws (red) and control groups (gray). *p < 0.05, **p < 0.01 by two-way ANOVA with Sidak’s multiple comparison test between Jaws (red) and control (black). (H) Speed profile for silencing NL189BLA neurons during arrest. Arrests with 500-ms duration trigger red LEDon for 2 s (λ = 630 nm; pink bar with red line) in the Jaws (n = 6) and control groups (n = 7). Time 0 represents the start of silencing. (I) Total effect on speed under Jaws (n = 6) versus control conditions (n = 7; **p < 0.0016 by unpaired t test). (J) Arrest fraction versus arrest duration in the control and Jaws groups. Data are presented as mean ± SEM.
Figure 4.
Figure 4.. NL189BLA Neurons Encoding Self-Paced Arrest Are Recruited in an Experience-Dependent Manner in Familiar Locations
(A) Representative aerial view of a mouse’s trajectory super-imposed to arrests (purple circles) for all days. (B) Same as (A) but for days 1 and 5. (C) Arrest count in the small (left) and big (right) arena for each day. (D) 4-Dimensional plot showing the arrest fraction of a representative animal for the 5 days. An ROIexample delineated by a dashed line was used in (E) and (F). (E) Proportion of arrests at different distances. Inset: ROIexample showing the distribution of arrests (fraction). (F) ROIexample showing the increase in proportion of arrests across days (from days 1–4). (G) Probability of arrest (Parrest) at an ROI where animals arrest in relation to the number of visits to that ROI (black) and shuffled condition (gray). (H) Inter-entrance interval (IEI; seconds) to ROIarrest (areas where mice arrested) or ROINon-Arrest (areas where mice did not arrest) in relation to the number of visits to those places. (I) Top: representative animal trajectory in an early and late visit. A purple dot represents the arrest. Bottom: heatmap of calcium activity of a single neuron recorded from the same animal. (J) Magnitude of neuronal activity of significant NL189BLA neurons (neurons in which the activity was positively modulated during arrest and inversely cross-correlated with speed) in relation to the number of visits to arrest areas. Early (1–5) and late (16–20) spatial experiences are compared. (k) Heatmap of neuronal activity of significant NL189BLA neurons during early versus late arrests. (L) Magnitude of neuronal calcium activity of significant NL189BLA neurons (auROC) during early (light purple) versus late arrests (dark purple). (M) Magnitude of neuronal calcium activity of significant NL189BLA neurons during early versus late arrest. ****p < 0.0001 by paired t test. (N) Fraction of significant NL189BLA neurons increases with spatial experience. ****p < 0.001 by paired t test, early versus late. (O) Fraction of significant NL189BLA neurons in early (left) or late visits to ROIs (right) during arrest (arrest, light violet bar graph) or movement (move, white bar graph). *p < 0.01 by paired t test. Data are presented as mean ± SEM.
Figure 5.
Figure 5.. Amygdala Silencing Impairs the Emergence of Experience-Dependent Exploratory Arrests
(A) Location-based closed+--loop optogenetic silencing behavioral protocol at the entrance of ROIon. Upon entrance to ROIon, the LED is triggered for 2 s of 630-nm light delivery, followed by 4 s of refractory time. (B) Schematic of ROI locations. Shown is the optogenetic protocol executed for the days of acquisition (days 1–5, inhibition in ROIon) and during the P (day 6, no inhibition). Control ROIoff is used to monitor the avoidance or preference to the ROIon. (C) Cumulative arrests count from days 1–5 for the control (black; n = 7) and Jaws (red; n = 6) groups, followed by a probe test (P; no light) on day 6. *p < 0.05 and **p < 0.01 by unpaired t test between the two groups for all 5 days. Running a two-way ANOVA with repeated measures, we found an effect of time (for each time bin in the control but not in the Jaws group; F(5,50) = 2.811; p < 0.0001) and an interaction between time and treatment group (Jaws versus control) (interaction; F(5,50) = 7.644; p = 0.0259). (D) Number of entrances to ROIon from days 1–5 followed by the probe test (P). (E) Cumulative arrest number versus number of visits to ROIon during days 1–5. (F) Preference ratio between ROIon and ROIoff of the number of entrances on day 6. ns, p > 0.05 by unpaired t test. Data are presented as mean ± SEM.
Figure 6.
Figure 6.. NL189BLA Neurons Encode Self-Paced Arrest
(A) Top left: injection of a retroconditional AAV virus expressing a floxed version of GCamp6f and Tdtomato. Bottom left: lens implantation scheme. Top right: CNMF-E-processed video of the neurons located in the BLA, with normalized neuronal calcium activity by the max. Bottom right: representative anatomical location of CEA-projecting NL189BLA neurons (BLA-CEA neurons) and lens implant. (B) Calcium activity (Z-score) of all NL189BLA-CEA neurons imaged from one representative animal before and after arrest onset. A purple circle shows the arrest onset time (0 s). (C) Sorted BLA-CEA neurons during arrest onset (+, active during arrest; −, inhibited during arrest). Data are presented as mean ± SEM.
Figure 7.
Figure 7.. Moment-to-Moment Arrest Is Mediated by CEA-Projecting NL189BLA Neurons
(A) Left: injection of a retroconditional AAV virus expressing a floxed version of ChR and YFP. Center: fiber implantation scheme. Right: anatomical location of CEA-projecting NL189BLA neurons and optical fiber implant. (B) Two-speed color-coded trajectories in on (left) and off (right) closed-loop trials. The entire stimulation duration (5×) is denoted by blue circles (centroid of the animal during stimulation with the 5× protocol). Scale bar, 2.5 cm. (C) Speed during the closed-loop stimulation protocol upon crossing the acceleration threshold for the ChR (left; n = 7) and control (right; n = 6) groups during light-on and -off trials. (D) Change in speed between the ChR (light blue) and control (dark) groups in triggering trials. (E) Closed-loop location-locked optogenetic inhibition behavioral protocol in acquisition (days 1–5, inhibition in ROIon) and during the P (day 6, no inhibition). (F) Cumulative arrest count from days 1–5 for the control (black; n = 6) and Jaws (red; n = 9) groups, followed by day 6 (probe test [P]). ***p < 0.001 by unpaired t test between the two groups for all 5 days. Two-way ANOVA with repeated measures: time (F(4,48) = 12.09; p < 0.0001), interaction (F(4,48) = 3.333; p < 0.0173). (G) Number of entrances to ROIon from days 1–5, followed by the probe test (P). (H) Preference ratio between the entrances to ROIon and ROIoff on day 6. ns, p > 0.05 by unpaired t test. Data are presented as mean ± SEM.

Comment in

  • Moments of exploration.
    Yates D. Yates D. Nat Rev Neurosci. 2020 Dec;21(12):666-667. doi: 10.1038/s41583-020-00403-x. Nat Rev Neurosci. 2020. PMID: 33110223 No abstract available.

References

    1. Benjamini Y, Lipkind D, Horev G, Fonio E, Kafkafi N, and Golani I. (2010). Ten ways to improve the quality of descriptions of whole-animal movement. Neurosci. Biobehav. Rev 34, 1351–1365. - PubMed
    1. Benjamini Y, Fonio E, Galili T, Havkin GZ, and Golani I. (2011). Quantifying the buildup in extent and complexity of free exploration in mice. Proc. Natl. Acad. Sci. USA 108, 15580–15587. - PMC - PubMed
    1. Beyeler A, Namburi P, Glober GF, Simonnet C, Calhoon GG, Conyers GF, Luck R, Wildes CP, and Tye KM (2016). Divergent Routing of Positive and Negative Information from the Amygdala during Memory Retrieval. Neuron 90, 348–361. - PMC - PubMed
    1. Beyeler A, Chang CJ, Silvestre M, Lévêque C, Namburi P, Wildes CP, and Tye KM (2018). Organization of Valence-Encoding and Projection-Defined Neurons in the Basolateral Amygdala. Cell Rep. 22, 905–918. - PMC - PubMed
    1. Botta P, Demmou L, Kasugai Y, Markovic M, Xu C, Fadok JP, Lu T, Poe MM, Xu L, Cook JM, et al. (2015). Regulating anxiety with extrasynaptic inhibition. Nat. Neurosci 18, 1493–1500. - PMC - PubMed

Publication types

LinkOut - more resources