. 2020 Nov 12;183(4):1070-1085.e12.
doi: 10.1016/j.cell.2020.09.050. Epub 2020 Sep 23.

A Mouse-Adapted SARS-CoV-2 Induces Acute Lung Injury and Mortality in Standard Laboratory Mice

Affiliations

A Mouse-Adapted SARS-CoV-2 Induces Acute Lung Injury and Mortality in Standard Laboratory Mice

Sarah R Leist et al. Cell. .

Abstract

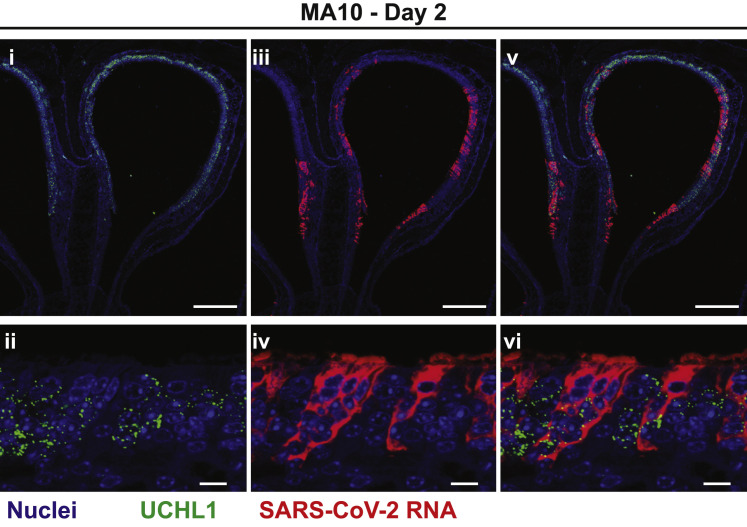
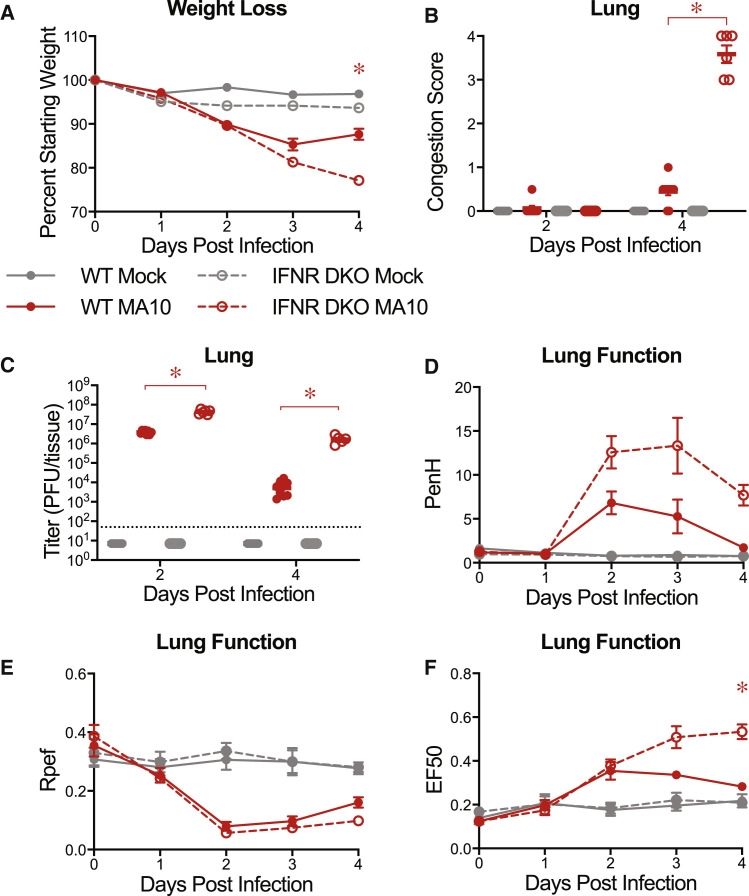
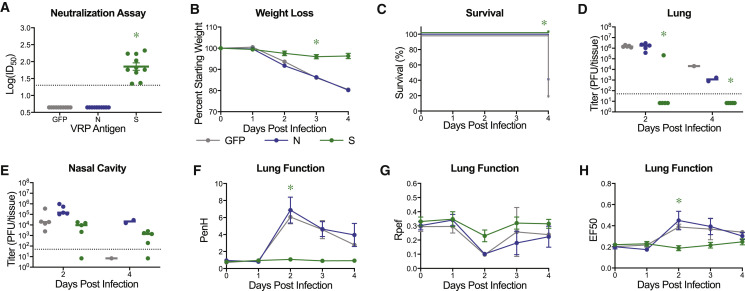
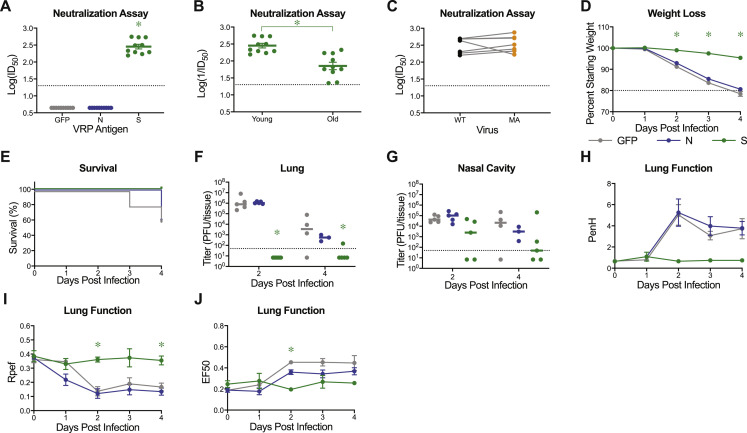
The SARS-CoV-2 pandemic has caused extreme human suffering and economic harm. We generated and characterized a new mouse-adapted SARS-CoV-2 virus that captures multiple aspects of severe COVID-19 disease in standard laboratory mice. This SARS-CoV-2 model exhibits the spectrum of morbidity and mortality of COVID-19 disease as well as aspects of host genetics, age, cellular tropisms, elevated Th1 cytokines, and loss of surfactant expression and pulmonary function linked to pathological features of acute lung injury (ALI) and acute respiratory distress syndrome (ARDS). This model can rapidly access existing mouse resources to elucidate the role of host genetics, underlying molecular mechanisms governing SARS-CoV-2 pathogenesis, and the protective or pathogenic immune responses related to disease severity. The model promises to provide a robust platform for studies of ALI and ARDS to evaluate vaccine and antiviral drug performance, including in the most vulnerable populations (i.e., the aged) using standard laboratory mice.

Keywords: COVID-19; SARS-CoV-2; acute lung injury; acute respiratory distress syndrome; animal models; interferon; mouse-adaptation; vaccines.


Conflict of interest statement

Competing Interests The authors declare no competing interests.

Figures

None
Graphical abstract
Figure 1
Figure 1
SARS-CoV-2 MA Increases in Pathogenicity following Serial In Vivo Passaging in Mice (A) Percent starting weight at 2 dpi of mice throughout serial passage of SARS-CoV-2 MA10 in 10- to 12-week-old BALB/c mice infected with 105 PFU SARS-CoV-2 MA at passage 1, or blind titer for passages 2–10. (B) 10-week-old BALB/c mice were mock-infected with PBS or infected with 105 PFU of plaque-purified virus from passage 10 in (A), SARS-CoV-2 MA10, and monitored for weight loss. Data analyzed by mixed effects analysis followed by Sidak’s multiple comparisons. (C) Table of mouse adaptations present in plaque purified SARS-CoV-2 MA10 relative to parental SARS-CoV-2 MA. WT, wild type; nsp, nonstructural protein; ORF, open reading frame. (D) Schematic of SARS-CoV-2 genome with locations of mouse adaptations from (C) shown. (E and F) Single step growth curve of SARS-CoV-2 WT and SARS-CoV-2 MA10 in Vero E6 cells (E) or differentiated primary human bronchiolar airway epithelial cells (HBE) (F). n = 3 for each group, sampled serially. Dotted line represents limit of detection. Log transformed data were analyzed by 2-factor ANOVA followed by Sidak’s multiple corrections. Error bars represent SEM about the mean for (A) and (B) and SD about the mean for (E) and (F). p < 0.05. See also Table S1.
Figure 2
Figure 2
SARS-CoV-2 MA10 Causes Acute Lung Injury in Young Adult BALB/c Mice (A) 10-week-old female BALB/c mice (n = 5 per group) were mock-infected, infected with 105 PFU SARS-CoV-2 MA, or 102, 103, 104, and 105 PFU SARS-CoV-2 MA10. (B–L) 10-week-old female BALB/c mice were mock-infected (n = 47) or infected with 104 PFU SARS-CoV-2 MA10 (n = 59). (B) Percent starting weight. Data analyzed by mixed effects analysis followed by Sidak’s multiple comparisons. (C) Survival rate. (D) Gross lung congestion score. Data analyzed by 2-factor ANOVA followed by Sidak’s multiple comparisons. (E) Viral lung titer (mock-infected: 1 dpi: n = 6, 2 dpi: n = 7, 3 dpi: n = 6, 4 dpi: n = 7, 5 dpi: n = 6, 6 dpi: n = 6, 7 dpi: n = 9; SARS-CoV-2 MA10-infected: 1 dpi: n = 7, 2 dpi: n = 10, 3 dpi: n = 7, 4 dpi: n = 10, 5 dpi: n = 7, 6 dpi: n = 7, 7 dpi: n = 9). Dotted line represents limit of detection. Undetected samples are plotted at half the limit of detection. Log transformed data analyzed as in (D). (F) Viral nasal cavity titer. Dotted line represents limit of detection. Undetected samples are plotted at half the limit of detection. (G–I) Whole body plethysmography analysis of lung function parameters (10 mice per group at 0 dpi): PenH (G), Rpef (H), and EF50 (I). Data analyzed as in (B). (J and K) Blinded histopathological evaluation of lung damage using DAD scoring (J) and ATS ALI scoring (K) systems on days 2, 4, and 7 after mock or SARS-CoV-2 MA10 infection. Data analyzed as in (D). (L) Representative 200× images of lungs from mock and SARS-CoV-2 MA10-infected mice from (J) and (K). H&E shown in the top panels. Bottom panels show immunohistochemistry (IHC) labeling against SARS-CoV-2 nucleocapsid, counterstained with hematoxylin. Scale bars represent 200 μm. All error bars represent SEM about the mean. p < 0.05.
Figure 3
Figure 3
SARS-CoV-2 MA10 Disease Is Severely Exacerbated in Old Mice (A) 1-year old female BALB/c mice (n = 5 per group) were mock-infected (gray), infected with 105 PFU SARS-CoV-2 MA, or 102, 103, 104, and 105 PFU SARS-CoV-2 MA10. Dotted line represents 70% starting body weight. (B–L) 1-year old female BALB/c mice were mock-infected (n = 51) or infected with 104 PFU SARS-CoV-2 MA10 (n = 65). (B) Percent starting weight. Dotted line represents 70% starting body weight. Data analyzed by mixed effects analysis followed by Sidak’s multiple comparisons. (C) Survival rate. Analyzed by log-rank test. (D) Gross lung congestion score. Data analyzed by 2-factor ANOVA followed by Sidak’s multiple comparisons. (E) Lung viral titer (mock-infected: 1 dpi: n = 6, 2 dpi, n = 7; 3 dpi, n = 6; 4 dpi, n = 7; 5 dpi, n = 6; 6 dpi, n = 6; 7 dpi,: n = 13; SARS-CoV-2 MA10-infected: 1 dpi, n = 6; 2 dpi, n = 10; 3 dpi, n = 7; 4 dpi, n = 8; 5 dpi, n = 1; 6 dpi, n = 2; 7 dpi, n = 3.) Dotted line represents limit of detection. Undetected samples are plotted at half the limit of detection. Log transformed data analyzed as in (D). (F) Viral nasal cavity titer. Dotted line represents limit of detection. Undetected samples are plotted at half the limit of detection. (G–I) Whole body plethysmography analysis of lung function parameters (10 mice per group at 0 dpi): PenH (G), Rpef (H), and EF50 (I). Data analyzed as in (B). (J and K) Blinded histopathological evaluation of lung damage using DAD scoring (J) and ATS ALI scoring (K) systems on days 2, 4, and 7 after mock or SARS-CoV-2 MA10 infection. Data analyzed as in (D). (L) Representative 200× images of lungs from mock and SARS-CoV-2 MA10-infected mice from (J) and (K). H&E is shown in the top panels. Bottom panels show immunohistochemistry (IHC) labeling against SARS-CoV-2 nucleocapsid, counterstained with hematoxylin. Scale bars represent 200 μm. (M) Representative in situ hybridization images of viral RNA in nasal cavity from SARS-CoV-2 MA10-infected mice. Scale bar represents 100 μm. All error bars represent SEM about the mean. p < 0.05.
Figure S1
Figure S1
SARS-CoV-2 MA10 Does Not Replicate in Non-Respiratory Tract Tissues, Related to Figure 3 Analysis of non-respiratory tract tissues of SARS-CoV-2 MA10 infected 1-year-old female BALB/c mice at 2dpi from Figure 3. (A) Viral titer in serum, heart, and brain. Dotted line represents limit of detection. Undetected samples are plotted at half the limit of detection. (B-F) Representative hematoxylin & eosin (left) and IHC for viral nucleocapsid (right) images of heart (B), liver (C), small intestine (D), kidney (E), and spleen (F). Faint non-specific IHC staining in spleen is result of red blood cell metabolism in macrophages, not viral protein staining. (A, B, E, F) shown at 100X with scale bar representing 500 μm. (D) shown at 200X with scale bar representing 200 μm.
Figure S2
Figure S2
SARS-CoV-2 MA10 Induces Local and Systemic Cytokine and Chemokine Responses, Related to Figure 3 (A-B) Cytokine and chemokine analysis of mock or SARS-CoV-2 MA10 infected 1-year-old BALB/c mice from Figure 3. Serum and lung homogenate were assayed for 23 cytokines and chemokines at 2dpi (A) and 4dpi (B). n = 4 mock and 5 MA10 mice at each time point. Data analyzed by 2-factor ANOVA followed by Sidak’s multiple comparisons. Asterisks represent p < 0.05.
Figure 4
Figure 4
C57BL/6J Mice Display Less Severe Disease following SARS-CoV-2 MA10 Infection (A) 10-week-old female C57BL/6J mice (n = 5 per group) were mock-infected, infected with 105 PFU SARS-CoV-2 MA, or 102, 103, 104, and 105 PFU SARS-CoV-2 MA10. (B–L) 10-week-old female BALB/c mice were mock-infected (n = 46) or infected with 104 PFU SARS-CoV-2 MA10 (n = 57). (B) Percent starting weight. Data analyzed by mixed effects analysis followed by Sidak’s multiple comparisons. (C) Survival rate. (D) Gross lung congestion score. Data analyzed by 2-factor ANOVA followed by Sidak’s multiple comparisons. (E) Viral lung titer of mice from (B) (mock-infected: 1 dpi, n = 6; 2 dpi, n = 7; 3 dpi, n = 5; 4 dpi, n = 7; 5 dpi, n = 6; 6 dpi, n = 6; 7 dpi, n = 8; SARS-CoV-2 MA10-infected: 1 dpi, n = 7; 2 dpi, n = 8; 3 dpi, n = 7; 4 dpi, n = 10; 5 dpi, n = 4; 6 dpi, n = 7; 7 dpi, n = 11). Dotted line represents limit of detection. Undetected samples are plotted at half the limit of detection. Log transformed data analyzed as in (D). (F) Viral nasal cavity titer. Dotted line represents limit of detection. Undetected samples are plotted at half the limit of detection. Log transformed data analyzed as in (D). (G–I) Whole body plethysmography analysis of lung function parameters (10 mice per group at 0 dpi): PenH (G), Rpef (H), and EF50 (I). Data analyzed as in (B). (J and K) Blinded histopathological evaluation of lung damage using DAD scoring (J) and ATS ALI scoring (K) systems on days 2, 4, and 7 after mock or SARS-CoV-2 MA10 infection. Data analyzed as in (B). (L) Representative 200× images of lungs from mock and SARS-CoV-2 MA10-infected mice from (J) and (K). H&E shown in the top panels. Bottom panels show immunohistochemistry (IHC) labeling against SARS-CoV-2 nucleocapsid, counterstained with hematoxylin. Scale bars represent 200 μm. Error bars represent SEM about the mean. p < 0.05.
Figure 5
Figure 5
SARS-CoV-2 MA10 Infects Secretory Club Cells of the Lower Respiratory Tract and Type II Pneumocytes SARS-CoV-2 MA10 cellular tropism in the lung was assessed by RNA in situ hybridization (ISH) or immunohistochemistry (IHC) in mock or infected female 1-year-old BALB/c mice from Figure 3 at 2 dpi. (A) ISH of lower airway epithelium. Scgb1a1 is a marker of secretory club cells. Foxj1 is a marker of ciliated cells. (Aii–Aiii) are same inset field with or without SARS-CoV-2 RNA channel. (B) ISH of terminal bronchiole epithelium. (Bii–Biii) are same field with or without SARS-CoV-2 RNA channel. (C) IHC of terminal bronchiole epithelium. CCSP is a marker of secretory club cells. (Cii–Civ) are the same inset field as single color channels or merged (Civ). (D and E) ISH of alveoli. Ager is a marker of type I pneumocytes. Sftpc and Sftpb are markers of type II pneumocytes. (E) IHC of alveoli. LAMP3 is a marker of type II pneumocytes. (Eii–Eiv) are the same inset field as single color channels or merged (Eiv). Scale bars represent 200 μm.
Figure S3
Figure S3
SARS-CoV-2 MA10 Infects the Nasal Olfactory Epithelium but Not Olfactory Sensory Neurons, Related to Figure 3 SARS-CoV-2 MA10 cellular tropism in the nasal cavity was assessed by RNA in situ hybridization (ISH) infected female 1-year-old BALB/c mice from Figure 3 at 2dpi. Uchl1 is a marker of olfactory sensory neurons (OSNs). (i & iii and ii and iv) are single color channels shown merged in (v and vi). Scale bars represent 200 μm (i, iii, v) or 10 μm (ii, iv, vi).
Figure 6
Figure 6
Interferon Signaling Deficient Mice Are More Susceptible to SARS-CoV-2 MA10 10-week-old male and female type I and II interferon receptor double knockout (IFNR DKO; n = 12 mock, n = 19 MA10) and wild-type (WT; n = 11 mock, n = 13 MA10) control mice were mock-infected or infected with 104 PFU SARS-CoV-2 MA10. (A) Percent starting weight. Data analyzed by mixed effects analysis followed by Sidak’s multiple comparisons. Statistical comparisons shown between MA10-infected WT and MA10-infected IFNR DKO mice. (B) Gross lung congestion score of mice from (A). Data analyzed by 2-factor ANOVA followed by Tukey’s multiple comparisons. (C) Viral lung titer of mice from (A) (mock-infected: 2 dpi, n = 6 WT and 5 IFNR DKO; 4 dpi, n = 6 WT and 6 IFNR DKO: SARS-CoV-2 MA10-infected: 2 dpi, n = 8 WT and 6 IFNR DKO; 4 dpi, n = 10 WT and 6 IFNR DKO). Dotted line represents limit of detection. Undetected samples are plotted at half the limit of detection. Log transformed data analyzed via 2-factor ANOVA followed by Tukey’s multiple comparisons. (D–F) Whole body plethysmography analysis of lung function parameters (6 mice per group at 0 dpi): PenH (D), Rpef (E), and EF50 (F). Data analyzed using 2-factor ANOVA followed by Sidak’s multiple comparisons. Error bars represent SEM about the mean. p < 0.05.
Figure 7
Figure 7
Virus Replicon Particle Delivered Spike Vaccination Protects Old Mice from SARS-CoV-2 MA10 Challenge 1-year-old female BALB/c mice were vaccinated with 103 virus replicon particles (VRPs) expressing SARS-CoV-2 wild-type spike (S, n = 10), nucleocapsid (N, n = 10), or GFP (n = 10). Mice received a boost 3 weeks after prime immunization, and submandibular blood samples were taken to be analyzed via neutralization assays. All mice were challenged 4 weeks after the boost immunization. (A) Neutralization of SARS-CoV-2 WT by sera from vaccinated mice 3 weeks post boost. ID50, inhibitory concentration necessary to achieve 50% virus neutralization. Dotted line represents limit of detection. Undetected samples are plotted at half the limit of detection. Log transformed data analyzed via 1-factor ANOVA followed by Holm-Sidak’s multiple comparisons. (B) Percent starting weight. Data analyzed by mixed effects analysis followed by Sidak’s multiple comparisons. (C) Survival rate. (D and E) Viral lung (D) and nasal cavity (E) titer of mice from (B). n = 5 for each group at each time point. Dotted line represents limit of detection. Undetected samples are plotted at half the limit of detection. Log transformed data analyzed via 2-factor ANOVA followed by Dunnett’s multiple comparisons. (F–H) Whole body plethysmography analysis of lung function parameters (n = 5 mice per group at 0dpi): PenH (F), Rpef (G), and EF50 (H). Data analyzed as in (B). Error bars represent SEM about the mean. p < 0.05.
Figure S4
Figure S4
Virus Replicon Particle Delivered Spike Vaccination Protects Young Mice from SARS-CoV-2 MA10 Challenge, Related to Figure 6 10-week-old female BALB/c mice were vaccinated with 103 virus replicon particles (VRPs) expressing SARS-CoV-2 wild-type spike (S, n = 10), nucleocapsid (N, n = 10), or GFP (n = 10). Mice received a boost 3 weeks after prime immunization and submandibular blood samples were taken to be analyzed via neutralization assays. All mice were challenged 4 weeks after the boost immunization. (A) Neutralization of SARS-CoV-2 WT by sera from vaccinated mice 3 weeks post boost. ID50: inhibitory concentration necessary to achieve 50% virus neutralization. Dotted line represents limit of detection. Undetected samples are plotted at half the limit of detection. Log transformed data analyzed via 1-factor ANOVA followed by Holm-Sidak’s multiple comparisons. (B) Comparison of serum IC50 values from 10-week and 1-year-old spike vaccinated mice from Figure 6A. Dotted line represents limit of detection. Data analyzed by unpaired, two-tailed Student’s t test. (C) Comparison of serum IC50 values from 10-week-old spike vaccinated mice to neutralize SARS-CoV-2 WT versus SARS-CoV-2 MA. Data analyzed by Wilcoxon matched-pairs signed rank test. Data not statistically significant. (D) Percent starting weight. Data analyzed by mixed effects analysis followed by Sidak’s multiple comparisons. (E) Survival rate of mice from (D). (F-G) Viral lung (F) and nasal cavity (G) titer. n = 5 for each group at each time point. Dotted line represents limit of detection. Undetected samples are plotted at half the limit of detection. Log transformed data analyzed via 2-factor ANOVA followed by Dunnett’s multiple comparisons. (G-I) Whole body plethysmography analysis of lung function parameters (n = 5 mice per group at 0dpi): PenH (G), Rpef (H), and EF50 (I). Data analyzed using 2-factor ANOVA followed by Dunnett’s multiple comparisons. Error bars represent standard error of the mean about the mean. Asterisks represent p < 0.05.

References

    1. Ackermann M., Verleden S.E., Kuehnel M., Haverich A., Welte T., Laenger F., Vanstapel A., Werlein C., Stark H., Tzankov A., et al. Pulmonary Vascular Endothelialitis, Thrombosis, and Angiogenesis in Covid-19. N. Engl. J. Med. 2020;383:120–128. - PMC - PubMed
    1. Agnihothram S., Menachery V.D., Yount B.L., Jr., Lindesmith L.C., Scobey T., Whitmore A., Schäfer A., Heise M.T., Baric R.S. Development of a Broadly Accessible Venezuelan Equine Encephalitis Virus Replicon Particle Vaccine Platform. J. Virol. 2018;92:e00027-18. - PMC - PubMed
    1. Bao L., Deng W., Huang B., Gao H., Liu J., Ren L., Wei Q., Yu P., Xu Y., Qi F., et al. The pathogenicity of SARS-CoV-2 in hACE2 transgenic mice. Nature. 2020;583:830–833. - PubMed
    1. Bolles M., Deming D., Long K., Agnihothram S., Whitmore A., Ferris M., Funkhouser W., Gralinski L., Totura A., Heise M., Baric R.S. A double-inactivated severe acute respiratory syndrome coronavirus vaccine provides incomplete protection in mice and induces increased eosinophilic proinflammatory pulmonary response upon challenge. J. Virol. 2011;85:12201–12215. - PMC - PubMed
    1. Bradley B.T., Maioli H., Johnston R., Chaudhry I., Fink S.L., Xu H., Najafian B., Deutsch G., Lacy J.M., Williams T., et al. Histopathology and ultrastructural findings of fatal COVID-19 infections in Washington State: a case series. Lancet. 2020;396:320–332. - PMC - PubMed

Publication types

MeSH terms