. 2020 Oct 29;183(3):636-649.e18.
doi: 10.1016/j.cell.2020.09.020. Epub 2020 Oct 7.

TDP-43 Triggers Mitochondrial DNA Release via mPTP to Activate cGAS/STING in ALS

Affiliations

TDP-43 Triggers Mitochondrial DNA Release via mPTP to Activate cGAS/STING in ALS

Chien-Hsiung Yu et al. Cell. .

Abstract

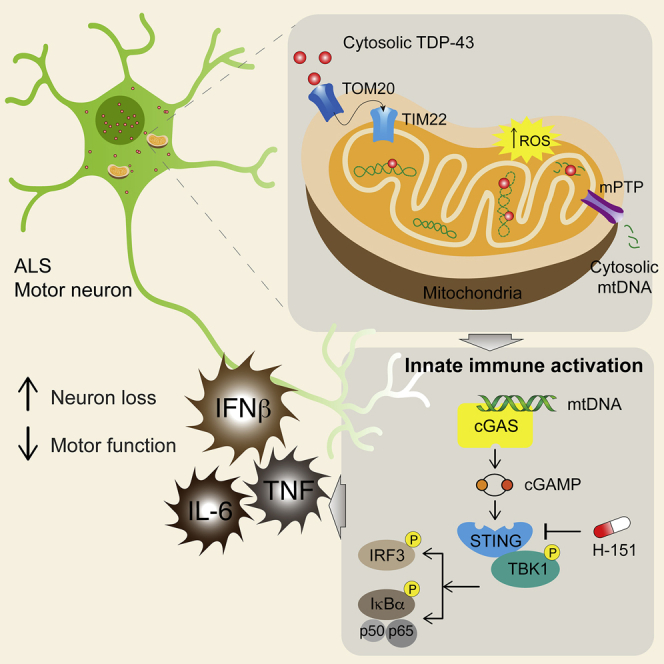
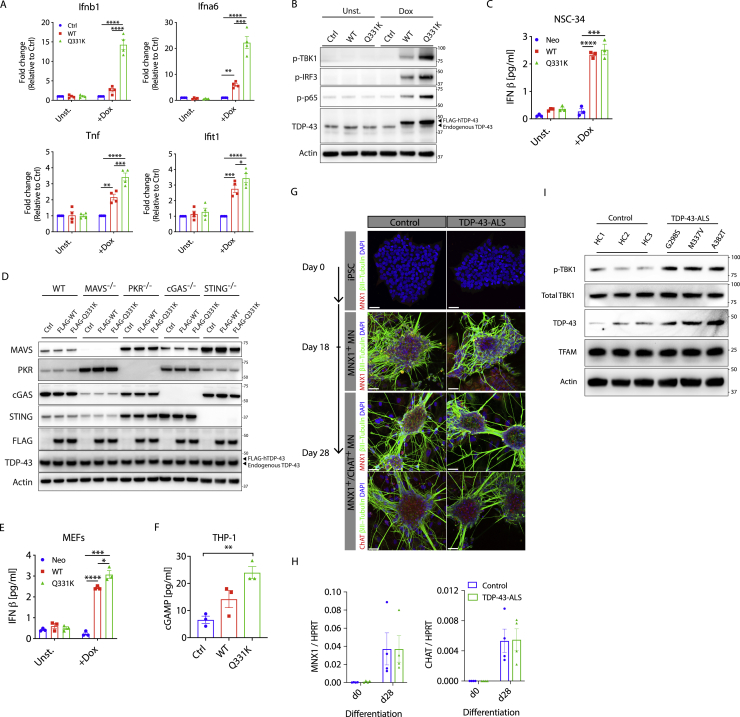
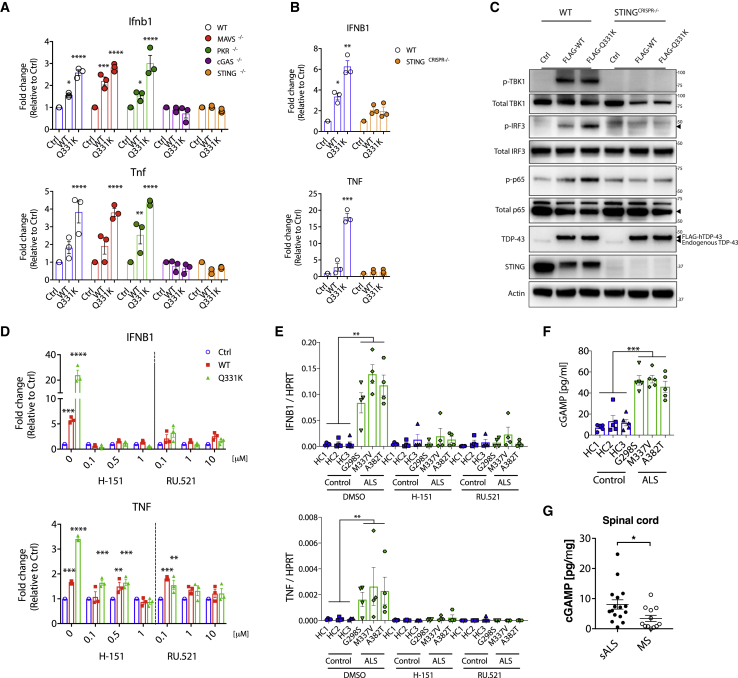
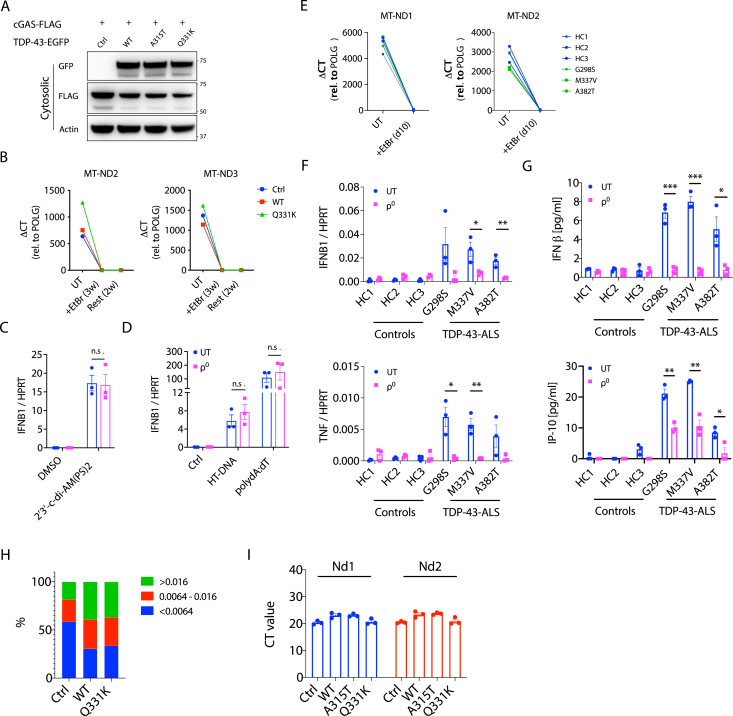
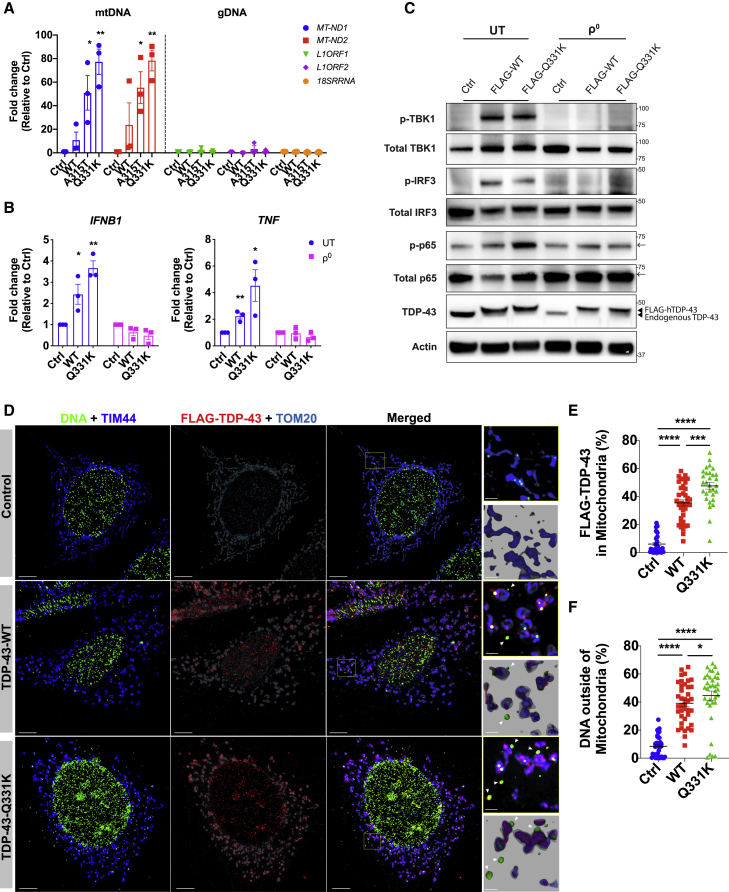
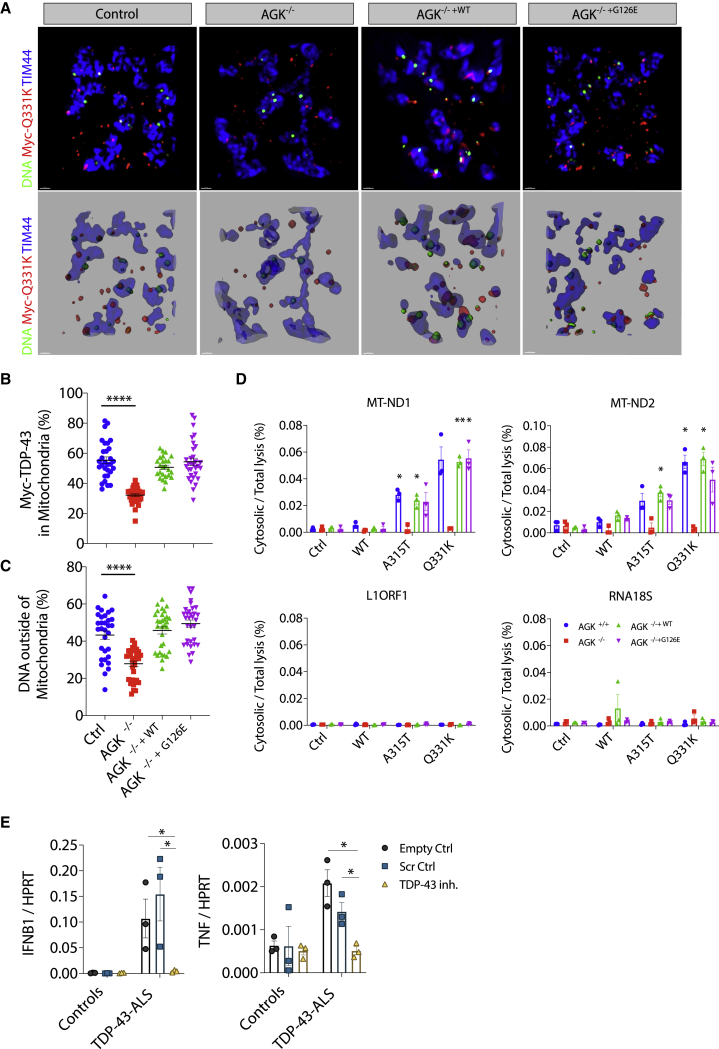
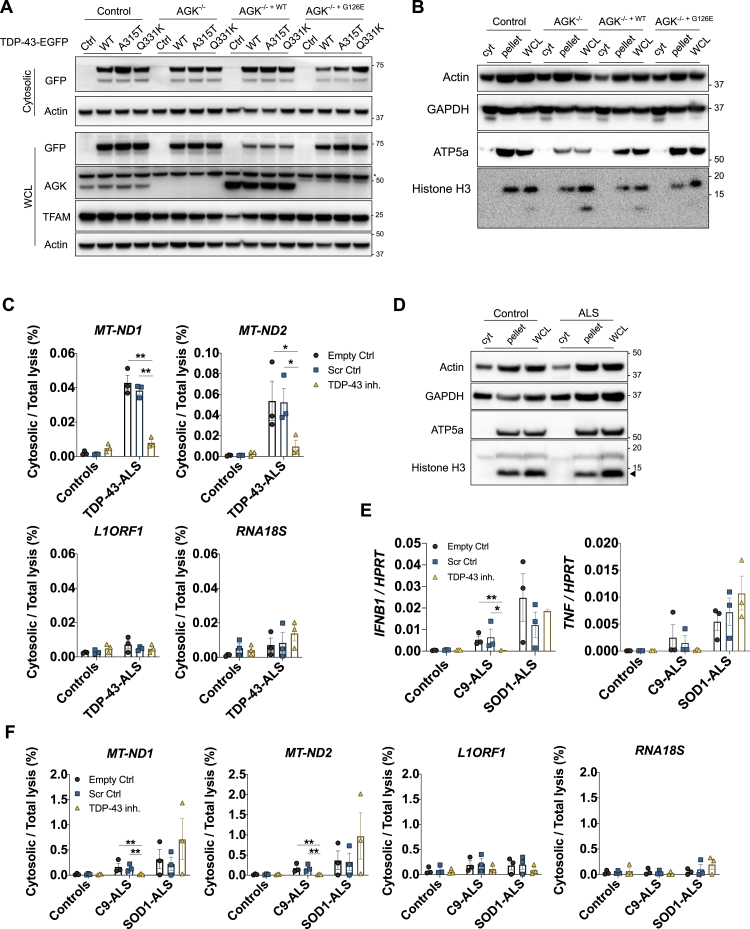
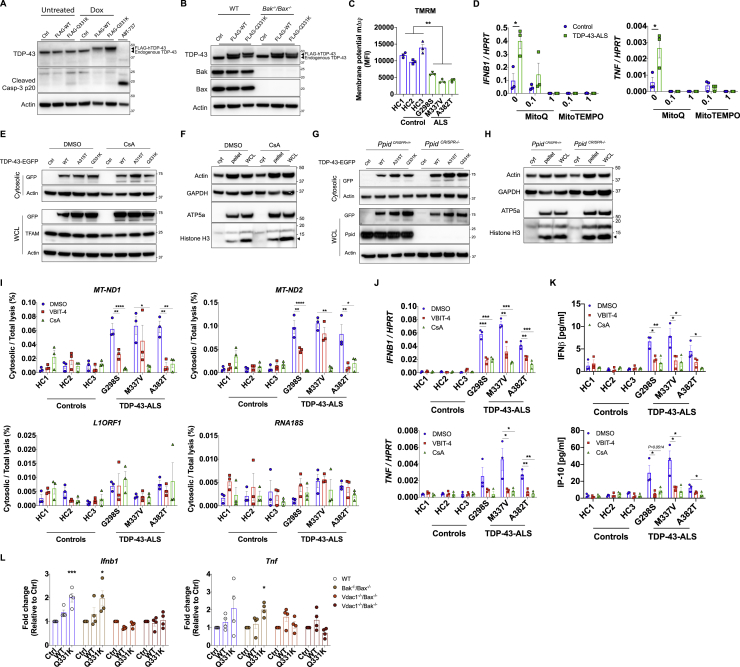
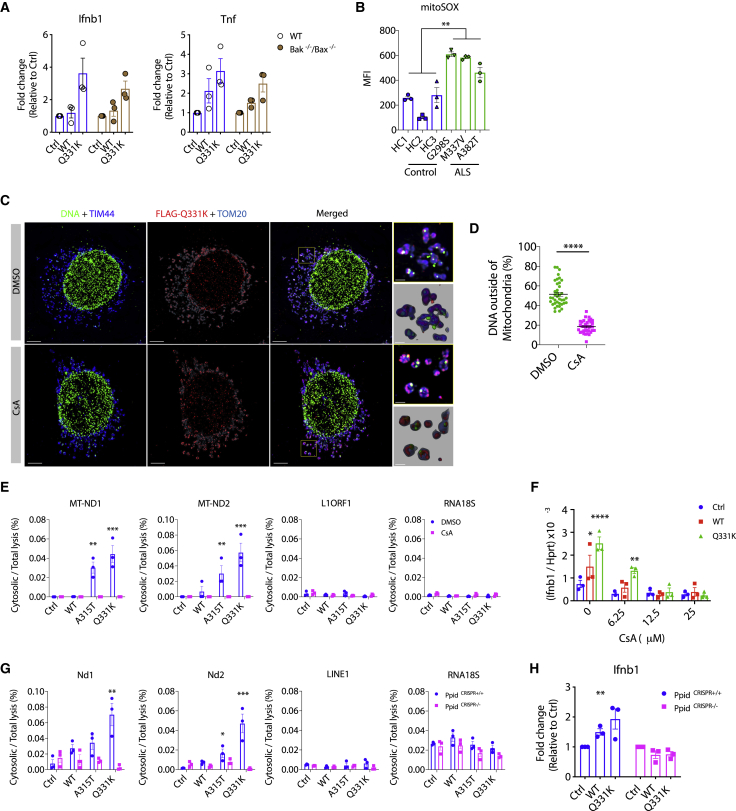
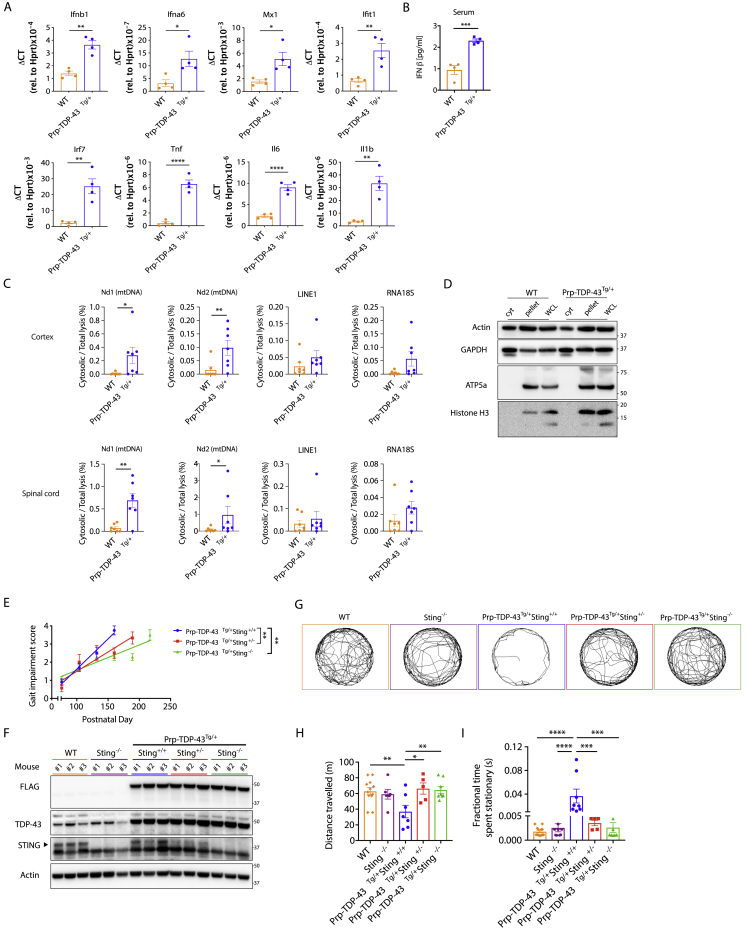
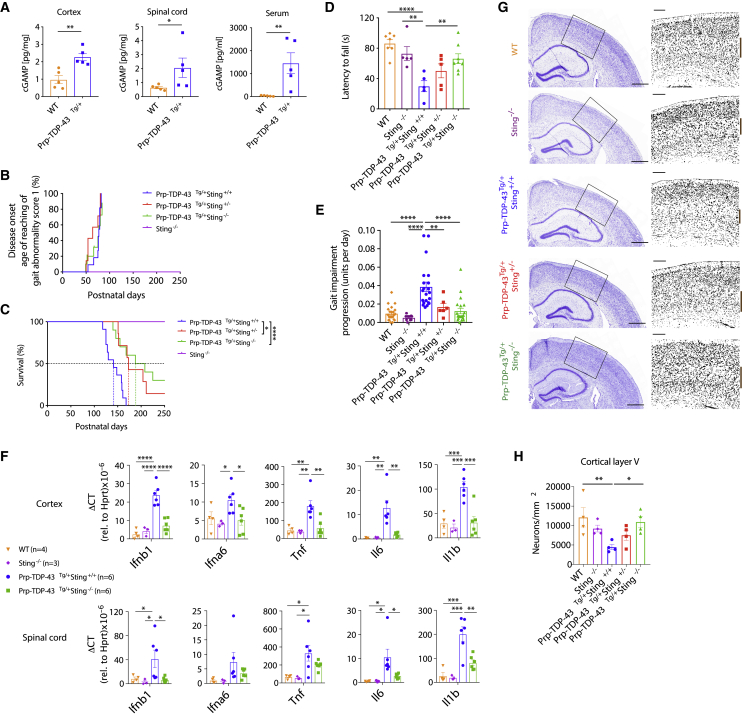
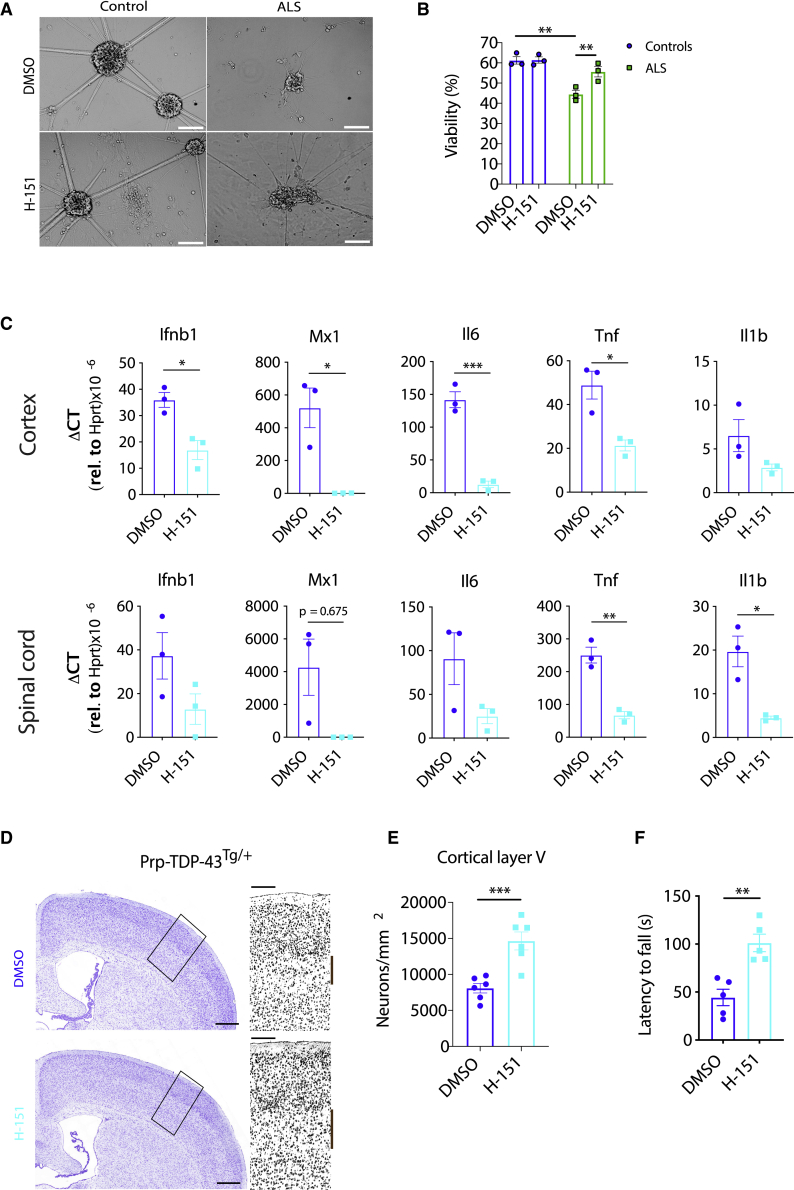
Cytoplasmic accumulation of TDP-43 is a disease hallmark for many cases of amyotrophic lateral sclerosis (ALS), associated with a neuroinflammatory cytokine profile related to upregulation of nuclear factor κB (NF-κB) and type I interferon (IFN) pathways. Here we show that this inflammation is driven by the cytoplasmic DNA sensor cyclic guanosine monophosphate (GMP)-AMP synthase (cGAS) when TDP-43 invades mitochondria and releases DNA via the permeability transition pore. Pharmacologic inhibition or genetic deletion of cGAS and its downstream signaling partner STING prevents upregulation of NF-κB and type I IFN induced by TDP-43 in induced pluripotent stem cell (iPSC)-derived motor neurons and in TDP-43 mutant mice. Finally, we document elevated levels of the specific cGAS signaling metabolite cGAMP in spinal cord samples from patients, which may be a biomarker of mtDNA release and cGAS/STING activation in ALS. Our results identify mtDNA release and cGAS/STING activation as critical determinants of TDP-43-associated pathology and demonstrate the potential for targeting this pathway in ALS.

Keywords: ALS; IFN; NF-κB; STING; TDP-43; cGAMP; cGAS; mPTP; mitochondria; neurodegeneration.


Conflict of interest statement

Declaration of Interests S.L.M. declares consultancy with IFM Therapeutics and Quench Bio and received funding from GlaxoSmithKline. S.L.M. and C.-H.Y. are named inventors on International Patent Application No. PCT/AU2019051201. All other authors declare no competing interests.

Figures

None
Graphical abstract
Figure S1
Figure S1
Elevated NF-κB and Type I IFN Signaling Because of TDP-43 In Vitro, Related to Figure 1 (A) Doxycycline (Dox inducible wild-type (WT) or ALS mutant (Q331K) TDP-43 was stably transduced into the mouse neuronal cell line NSC-34. 72 hr after TDP-43 induction, RNA was collected for qPCR of Ifnb1, Ifna6, Ifit1 and Tnf or (B) cells were lysed for western blot of p-TBK1, p-IRF3, p-p65, TDP-43 and actin as control. Blots are representative of three independent experiments. (C) IFNβ ELISA was performed on the supernatant from cells in (A). (D) Representative western blot of MAVS, PKR, cGAS, STING, FLAG, TDP-43 and Actin from cells in Figure. 1A. (E) IFNβ ELISA was performed on the supernatant from MEFs after 72hrs induction of WT and Q331K TDP-43. (F) cGAMP ELISA was performed on the lysates of human THP-1 cells overexpressing TDP-43 (WT or Q331K) after 72hrs induction. (G) Images of healthy control and TDP-43-ALS patient iPSC during differentiation into premature MNX1+ motor neurons (day 18) and further into mature MNX1+/ChAT+ motor neurons (day 28). (red - MNX1 or ChAT, green – β3-tubulin and blue - DAPI). (scale: 40 μm). (H) MNX1 and CHAT expression, measured by qPCR in undifferentiated (day 0) and differentiated iPSC-derived MNs (day 28). (I) Representative western blot of p-TBK1, total TBK1, TDP-43, TFAM and Actin for cells in (G) (lysed in 1% NP-40). Data are mean ± SEM from 3-4 independent experiments. P values were calculated using one-way or two-way ANOVA. p < 0.05, ∗∗p < 0.01, ∗∗∗p < 0.001, ∗∗∗∗p < 0.0001.
Figure 1
Figure 1
Inflammatory Signaling from TDP-43 Is Dependent on cGAS/STING (A) Vector alone (Ctrl) or plasmids encoding FLAG-tagged wild-type (WT) TDP-43 and the ALS mutation (Q331K) were transiently overexpressed in mouse embryonic fibroblasts (MEFs) genetically deficient for different innate immune sensors. Expression of Ifnb1 and Tnf was measured by qPCR after 72 h and was ablated only when cGAS or STING were genetically deficient. (B) Inducible TDP-43 constructs (WT or Q331K) were transduced into WT or STING CRISPR knockout (KO) THP-1 cells. 72 h after Dox induction, qPCR for IFNB1 and TNF was performed. (C) TDP-43-overexpressing THP-1 cells as in (B) were subjected to western blot analysis of inflammatory signaling pathways related to type I IFN and NF-κB. (D and E) The cGAS inhibitor RU.521 and STING inhibitor H-151 prevent IFNB1 and TNF induction from TDP-43-overexpressing THP-1 cells used in (B) and (E) iPSC-derived motor neurons from ALS patients compared with healthy controls (RU.521, 10 μM; H-151, 1 μM). DMSO was used as a solvent control (0). (F and G) Quantification of cGAMP by ELISA from (F) cell lysates of iPSC-derived motor neurons from healthy controls and ALS patients and from (G) post-mortem spinal cord samples of patients with sporadic ALS (n = 16) or MS (n = 12). Data are mean ± SEM, pooled from 3–5 independent experiments ([A], [B], and [D]–[F]) or representative of 3 independent experiments (C). The p values were calculated using two-way ANOVA to Ctrl in (A), (B), and (D) or unpaired t test between healthy control and ALS patient iPSC-MN lines (G298S, M337V, and A382T) in (E)–(G). p < 0.05, ∗∗p < 0.01, ∗∗∗p < 0.001, ∗∗∗∗p < 0.0001. See also Figure S1 and Table S1.
Figure S2
Figure S2
mtDNA Is a DAMP that Activates cGAS/STING Signaling, Related to Figure 2 (A) Representative western blot of FLAG-cGAS immunoprecipitation from Figure 2A. (B) Representative qPCR analysis of mitochondrial DNA (mtDNA) depletion from THP-1 cells over three weeks treatment in ethidium bromide (EtBr) and then two weeks after removing EtBr. To indicate the depletion, mitochondrial genes (MT-ND2 and MT-ND3) were normalized to that of nuclear gene POLG as ΔCT and compared to untreated cells (UT). (C) IFNB1 expression, measured by qPCR, in UT and ρ0 THP-1 cells in response to stimulation with 2′3′-c-di-AM(PS)2(Rp, Rp) (20 μM) or DMSO as solvent control for 4hrs or (D) poly(dA:dT) (1 μg/ml), HT-DNA (2 μg/ml) and equivalent Lipofectamine as control (Ctrl) for 6hrs. (E) mitochondrial genes (MT-ND1 and MT-ND2) were depleted in iPSC-MNs treated with EtBr for 10 days. (F) Gene expression of IFNB1 and TNF, and (G) IFNβ and IP-10 production were diminished in ρ0 iPSC-MNs from TDP-43-ALS patients. (H) Quantification of mtDNA nucleoid size for imaging data in Figure 2D. Nucleoid sizes were divided into three groups; < 0.0064 mm3, 0.0064-0.016 mm3 and > 0.016 mm3. (I) No difference in copies of mitochondrial DNA (Nd1 and Nd2) was observed in total cell lysates of MEFs transfected with WT or mutant TDP-43 (A315T and Q331K). Data are mean ± SEM from 3 independent experiments. P values were calculated using two-way ANOVA. p < 0.05, ∗∗p < 0.01, ∗∗∗p < 0.001, n.s. not significant.
Figure 2
Figure 2
TDP-43 Causes mtDNA Release into the Cytoplasm (A) TDP-43-EGFP (WT or the ALS mutants A315T and Q331K) and FLAG-cGAS were transiently overexpressed in HEK293T cells, followed by extraction of DNA from FLAG immunoprecipitants. Direct qPCR reveals the presence of mtDNA (MT-ND1 and MT-ND2) but not DNA corresponding to abundant nuclear LINE1 elements (L1ORF1 and L1ORF2) or a ribosomal gene (RNA18S) bound to FLAG-cGAS. (B) Human THP-1 cells with inducible TDP-43 (WT or Q331K) were depleted of mtDNA using EtBr (ρ0). 72 h after TDP-43 induction, IFNB1 and TNF expression was diminished compared with the untreated (UT) control. (C) TDP-43 overexpressing THP-1 cells as in (B) were subjected to western blot analysis of inflammatory signaling pathways related to type I IFN and NF-κB. Arrows indicate a cut in the membrane to facilitate multiple protein probing. See the Key Resources Table for uncropped blots. (D) OMX-SR microscopy reveals that TDP-43 (FLAG-tagged, red) translocates into mitochondria (TIM44, blue; TOM20, cyan) and induces relocation of DNA (anti-DNA, green) into the cytoplasm of TDP-43-overexpressing MEFs (scale bars, 5 μm). Overview images are maximum-intensity projections, and magnified images are 3D surface reconstructions using Imaris software (bottom right) (scale bars, 0.5 μm). See also Video S1. (E and F) Spatial quantification by Imaris software for (E) the percentage of FLAG-TDP-43 in mitochondria (TIM44) and (F) the percentage of DNA outside of mitochondria; 30–40 cells per group. Data are mean – SEM, pooled from 3 independent experiments ([A], [B], [E], and [F]) or representative of 3 independent experiments ([C] and [D]). The p values were calculated using two-way ANOVA to control in (A) and (B) or unpaired t test in (E) and (F). p < 0.05, ∗∗p < 0.01, ∗∗∗p < 0.001, ∗∗∗∗p < 0.0001. See also Figure S2.
Figure 3
Figure 3
TDP-43 Entry into Mitochondria Requires AGK Independent of Its Lipid Kinase Function (A) OMX-SR microscopy reveals that import of TDP-43 (Myc-tagged, red) into mitochondria (TIM44, blue) and TDP-43-induced relocation of DNA (anti-DNA, green) into the cytoplasm are ablated in HEK293T cells lacking the TIM22 regulatory subunit AGK (scale bars, 0.5 μm). Overview images are maximum-intensity projections (top) or 3D surface reconstructions using Imaris software (bottom). See also Video S2. (B and C) Spatial quantification by Imaris software for (B) the percentage of Myc-TDP-43 in mitochondria (TIM44) and (C) the percentage of DNA outside of mitochondria in control, AGK−/−, AGK−/− +WT, or AGK−/− +G126E HEK293T cells; 30 cells per group. (D) TDP-43-induced (WT, mutant A315T and Q331K) mtDNA release (cytosolic/total lysis, percent) is ablated in cells that lack AGK. (E) Treatment with the TDP-43 inhibitor peptide (PM1; 1 μM for 24 h) prevents induction of IFNB1 and TNF in TDP-43-ALS patient iPSC-MNs. Data are mean ± SEM from 3 independent experiments. The p values were calculated using one-way or two-way ANOVA to Ctrl in (B)–(D) or unpaired t test between healthy Ctrl and ALS patient iPSC-MNs in (E). p < 0.05, ∗∗p < 0.01, ∗∗∗∗p < 0.0001. See also Figure S3.
Figure S3
Figure S3
mtDNA Leakage Is Dependent on TDP-43 Entry into Mitochondria, Related to Figure 3 (A) Representative western blot analysis of GFP-tagged TDP-43 (WT, A315T and Q331K), AGK, TFAM and Actin in Flp-In control, AGK−/−, AGK−/− +WT or AGK−/− +G126E HEK293T cells. (B) Representative western blot analysis of cells in panel (A), to establish the purity of Digitonin lysis cytosolic fraction (cyt) compared to the pellet and RIPA whole cell lysate (WCL), using the subcellular markers indicated. (C) iPSC-MNs from healthy controls (HC1, HC2, HC3) and TDP-43-ALS patients (G298S, M337V, A382T) were treated with 1 μM of control peptide (Scr ctrl) or inhibitor peptide (PM1) for 24h and were lysed in 0.0045% Digitonin buffer for cytosolic fraction or 1x RIPA buffer for whole cell lysate control (WCL) after which DNA was extracted and directly amplified by qPCR to reveal the reduced presence of mtDNA (MT-ND1 and MT-ND2) in the cytoplasm. LINE1 element (L1ORF1) and a ribosomal gene (RNA18S) were not affected. (D) Representative western blot analysis of control and ALS patient iPSC-MNs, to establish the purity of Digitonin lysis cytosolic fraction (cyt) compared to the pellet and RIPA whole cell lysate (WCL), using the subcellular markers indicated. (E) iPSC-MNs from healthy controls (HC4, HC5, HC6), C9-ALS patients and SOD1-ALS patients were analyzed by qPCR for expression of IFNB1 and TNF, or (F) subjected to subcellular fractionation and DNA quantification as in panel (C). Data are mean ± SEM from 3 independent experiments with three controls or patients per group. P values were calculated using two-way ANOVA to Empty control (Ctrl) per genotype. p < 0.05, ∗∗p < 0.01.
Figure S4
Figure S4
TDP-43 Releases mtDNA via the mPTP, Related to Figure 4 (A) Representative western blot of cleaved caspase-3 in TDP-43-overexpressing Mcl1−/− MEFs 72hrs post doxycycline (Dox) treatment, or treated with ABT-737 to induce apoptosis (t = 4h). (B) Representative western blot of Bak, Bax, TDP-43 and actin from cells in Figure 4A. (C) iPSC-derived MNs from healthy controls and ALS patients carrying mutations in TDP-43 were stained with Tetramethylrhodamine Methyl Ester (TMRM) to probe mitochondrial membrane potential (mΔΨ) and quantified by FACS analysis (MFI: mean fluorescence intensity). (D) Mitochondrial ROS inhibitors, mitoQ and mitoTEMPO (0.1-1 μM), potently prevent induction of IFNB1 and TNF in TDP-43-ALS iPSC-MNs. (E-F) Representative western blot analysis of cytosolic lysates (0.025% digitonin) and WCL (1x RIPA) from HEK293T cells treated with CsA (12.5 μM) or from (G-H) CRISPR Ppid knockout MEFs transfected with TDP-43-EGFP (WT, A315T and Q331K, 2.5 μg) or untransfected (Ctrl). Cytosolic fraction purity was confirmed using the subcellular markers indicated (I) Treatment with VBIT-4 and CsA (10uM, t = 24h) reduces mtDNA (MT-ND1 and MT-ND2) release into the cytoplasm as performed in Figure S3C, (J) reduces expression of IFNB1 and TNF as determined by qPCR, and (K) reduces production of IFNβ and IP-10 quantified by ELISA. (L) CRISPR Vdac1 knockout MEFs display no TDP-43-induced Ifnb1 and Tnf expression. Data are mean ± SEM from 3-4 independent experiments. P values were calculated using un-paired t test between healthy control and TDP-43-ALS patient iPSC-MN lines or one-way ANOVA to DMSO or vector control. p < 0.05, ∗∗p < 0.01, ∗∗∗p < 0.001, ∗∗∗∗p < 0.0001.
Figure 4
Figure 4
TDP-43 Causes mtDNA Release to the Cytoplasm via the mPTP (A) Plasmids encoding TDP-43 (WT or Q331K) were transiently overexpressed in MEFs that are genetically deficient for Bax and Bak. Expression of Ifnb1 and Tnf was measured by qPCR after 72 h. (B) Human iPSC-derived motor neurons from healthy controls and ALS patients carrying mutations in TDP-43 (G298S, M337V, and A382T) were treated with mitoSOX red to quantify mitochondrial ROS 2 weeks after terminal differentiation and then subjected to fluorescence-activated cell sorting (FACS) analysis (MFI, mean fluorescence intensity). (C) OMX-SR microscopy reveals that TDP-43-induced (FLAG-tagged, red) relocation of DNA (anti-DNA, green) from mitochondria (TIM44, blue; TOM20, cyan) into the cytoplasm was reduced significantly by inhibition of the mPTP (CsA, 12.5 μM) in TDP-43 mutant (Q331K)-overexpressing MEFs (scale bars, 5 μm). DMSO was used as a solvent control. Overview images are maximum-intensity projections, and magnified images are 3D surface reconstructions using Imaris software (bottom right) (scale bars, 0.5 μm). See also Video S3. (D) Spatial quantification by Imaris software for the percentage of DNA outside of mitochondria (TIM44); 30–40 cells per group. (E and F) Inhibition of the mPTP (CsA, 12.5 μM) in HEK293T cells prevents mtDNA cytosolic accumulation (cytosolic/total lysis, percent) and (F) prevents Ifnb1 gene expression relative to Hprt, as induced by TDP-43 transient overexpression (WT, A315T, or Q331K). (G and H) CRISPR-mediated genetic deletion of the mPTP component Ppid also abolished mtDNA release into the cytoplasm and (H) downstream Ifnb1 gene expression. Data are mean ± SEM, pooled from 3 independent experiments ([A], [B], and [D]–[H]) or representative of 3 independent experiments (C). The p values were calculated using unpaired t test in (B) and (D), two-way ANOVA to control in (A) and (E)–(H). p < 0.05, ∗∗p < 0.01, ∗∗∗p < 0.001, ∗∗∗∗p < 0.0001. See also Figure S4.
Figure S5
Figure S5
Disease Incidence and Progression in Prp-TDP-43Tg/+ Mice, Related to Figure 5 (A) qPCR analysis of type I IFNs (Ifnb1 and Ifna6), interferon-stimulated genes (Mx1, Ifit1 and Irf7) and NF-κB genes (Tnf, Il6 and Il1b) are presented for WT and Prp-TDP-43Tg/+ bone marrow derived macrophages, taken from mice at 150 days of age. The mRNA expression was normalized to Hprt as relative gene expression (mean ± SD from 4 mice per group). (B) Serum IFNβ from WT and Prp-TDP-43Tg/+ mice was quantified by ELISA at day 150. (C) Single cell suspensions of cortex and spinal cord from WT and Prp-TDP-43Tg/+ mice (n = 7, age 120 days) were subjected to subcellular fractionation followed by direct qPCR for mtDNA (Nd1 and Nd2), LINE1 element and ribosome control (RNA18S). (D) Representative western blot analysis of single cell suspensions from cortex and spinal cord of WT and Prp-TDP-43Tg/+ mice, to establish the purity of Digitonin lysis cytosolic fraction (cyt) compared to the pellet and RIPA whole cell lysate (WCL), using the subcellular markers indicated (E) Genetic deletion of Sting significantly mitigates the rate of disease progression after onset (slope of linear regression for gait impairment across lifespan). Data are mean ± SEM with P values 0.0018 in Prp-TDP-43Tg/+Sting+/− and 0.0015 in Prp-TDP-43Tg/+Sting−/− when compared to Prp-TDP-43Tg/+Sting+/+. (F) Representative western blot of transgenic FLAG-TDP-43 mutant (A315T), TDP-43, STING and Actin in brain lysates of Prp-TDP-43Tg/+ strains and control strains used in Figure 5. Three mice analyzed per group at 150 days of age. (G) Video captured from the OF test was analyzed using ImageJ and MouseMove then presented as representative cumulative trajectories of male WT (n = 12), Sting−/− (n = 6), Prp-TDP-43Tg/+Sting+/+ (n = 8), Prp-TDP-43Tg/+Sting+/− (n = 5) and Prp-TDP-43Tg/+Sting−/− (n = 8) mice at 130 days. (H) Quantification of test data shows that heterozygous and homozygous deletion of Sting significantly restores locomotor activity in Prp-TDP-43Tg/+ models of ALS relative to WT controls (n = 12) in terms of distance traveled and (I) their fractional time spent stationary during 10 min OF test at 120-130 days. Animals studied here were all males. Data are mean ± SEM from 4 independent neurological behavior tests. P values were calculated using un-paired t test between two groups (A, B, C) or one-way ANOVA (E, H, I) to Prp-TDP-43Tg/+Sting+/+. p < 0.05, ∗∗p < 0.01, ∗∗∗p < 0.001, ∗∗∗∗p < 0.0001.
Figure 5
Figure 5
Genetic Deletion of Sting Mitigates Disease in an ALS Mouse Model (A) Quantification of cGAMP in the cortex, spinal cord, and serum of WT mice and mice that are transgenic for the human TDP-43 mutant allele A315T (Prp-TDP-43Tg/+) (n = 5) at the experimental endpoint. See animal phenotype scoring. (B) Genetic deletion of Sting does not change disease onset in Prp-TDP-43Tg/+ mice (disease incidence on the day when gait impairment first achieves a score of 1). (C) Prp-TDP-43Tg/+ mice (n = 11) develop progressive neurodegenerative disease that requires euthanasia at a median of 148 days. Heterozygous (n = 9) or homozygous (n = 10) loss of Sting significantly increases the lifespan. (D and E) At 120 days, Prp-TDP-43Tg/+ mice exhibit significantly decreased latency to fall in a rotarod test (n = 5–8) and (E) significant gait impairment (n = 6–21), which are greatly rectified by genetic deletion of Sting. (F) qPCR of inflammatory gene expression relative to Hprt in the cortex and spinal cord reveals that increased levels of type I IFN- and NF-κB-dependent cytokines are greatly reduced because of genetic deletion of Sting (n = 3–6). (G) Representative Nissl body staining (cresyl violet) of a coronal section (scale bars, 5 mm) through the brain of WT and Prp-TDP-43Tg/+ mice with and without the genetic deletion of Sting at 150 days of age. Overview images are selected magnified grayscale images (scale bars, 200 μm). (H) Quantification of cortical layer V neurons marked by a brown bar in (G) (n = 4). All animals studied here were males. Data are mean ± SEM. The p values were calculated using unpaired t test between two groups in (A) or one-way ANOVA to Prp-TDP-43Tg/+Sting+/+ in (B)–(F) and (H). p < 0.05, ∗∗p < 0.01, ∗∗∗p < 0.001, ∗∗∗∗p < 0.0001. See also Figure S5.
Figure 6
Figure 6
STING Inhibition Ameliorates Neurodegeneration In Vitro and In Vivo (A) Representative bright-field images demonstrate that H-151 (1 μM) prevents the death of iPSC-derived motor neurons from TDP-43-ALS patients 28 days after terminal differentiation (scale bars, 50 μm). (B) Quantification of cell death in (A), as measured by LDH release assay. (C) Prp-TDP-43Tg/+ mice were injected intraperitoneally (i.p.) with H-151 (210 μg) three times per week for 4 weeks, starting at disease onset at day 110 of age. This treatment significantly diminishes proinflammatory cytokine gene expression in the cortex and spinal cord, as seen by qPCR (n = 3). (D) Neuron loss was imaged by cresyl violet staining of a coronal section (scale bars, 5 mm). A representative image is shown, with selected magnified grayscale images highlighting cortical layer V neurons marked by a brown bar (scale bars, 200 μm). (E) Automated quantification of cortical layer V neurons from (D) (n = 6). (F) H-151-treated mice demonstrated improved performance in the rotarod test compared with DMSO-treated mice (n = 5). All animals studied here were males. Data are mean ± SEM. The p values were calculated using two-way ANOVA in (B) or unpaired t test between two groups in (C), (E), and (F). p < 0.05, ∗∗p < 0.01, ∗∗∗p < 0.001.

Comment in

References

    1. Ahn J., Ruiz P., Barber G.N. Intrinsic self-DNA triggers inflammatory disease dependent on STING. J. Immunol. 2014;193:4634–4642. - PMC - PubMed
    1. Armakola M., Higgins M.J., Figley M.D., Barmada S.J., Scarborough E.A., Diaz Z., Fang X., Shorter J., Krogan N.J., Finkbeiner S. Inhibition of RNA lariat debranching enzyme suppresses TDP-43 toxicity in ALS disease models. Nat. Genet. 2012;44:1302–1309. - PMC - PubMed
    1. Arnold E.S., Ling S.C., Huelga S.C., Lagier-Tourenne C., Polymenidou M., Ditsworth D., Kordasiewicz H.B., McAlonis-Downes M., Platoshyn O., Parone P.A. ALS-linked TDP-43 mutations produce aberrant RNA splicing and adult-onset motor neuron disease without aggregation or loss of nuclear TDP-43. Proc. Natl. Acad. Sci. USA. 2013;110:E736–E745. - PMC - PubMed
    1. Baker P.J., Masters S.L. Generation of Genetic Knockouts in Myeloid Cell Lines Using a Lentiviral CRISPR/Cas9 System. Methods Mol. Biol. 2018;1714:41–55. - PubMed
    1. Balka K.R., Louis C., Saunders T.L., Smith A.M., Calleja D.J., D’Silva D.B., Moghaddas F., Tailler M., Lawlor K.E., Zhan Y. TBK1 and IKKε Act Redundantly to Mediate STING-Induced NF-κB Responses in Myeloid Cells. Cell Rep. 2020;31:107492. - PubMed

Publication types

MeSH terms