. 2020 Nov 5;107(5):864-881.
doi: 10.1016/j.ajhg.2020.09.007. Epub 2020 Oct 7.

Analysis of Trans-Ancestral SLE Risk Loci Identifies Unique Biologic Networks and Drug Targets in African and European Ancestries

Affiliations

Analysis of Trans-Ancestral SLE Risk Loci Identifies Unique Biologic Networks and Drug Targets in African and European Ancestries

Katherine A Owen et al. Am J Hum Genet. .

Abstract

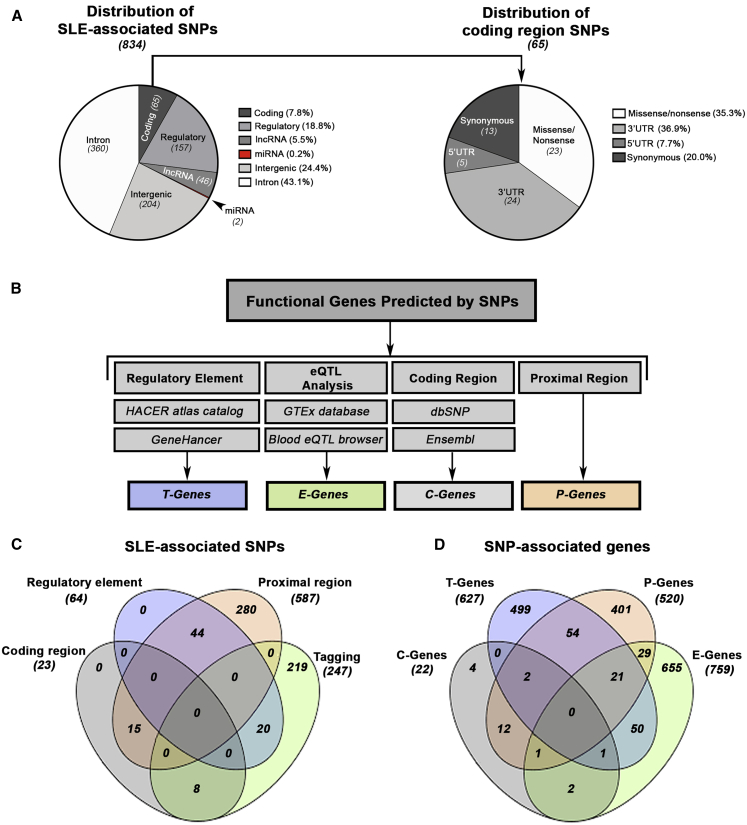
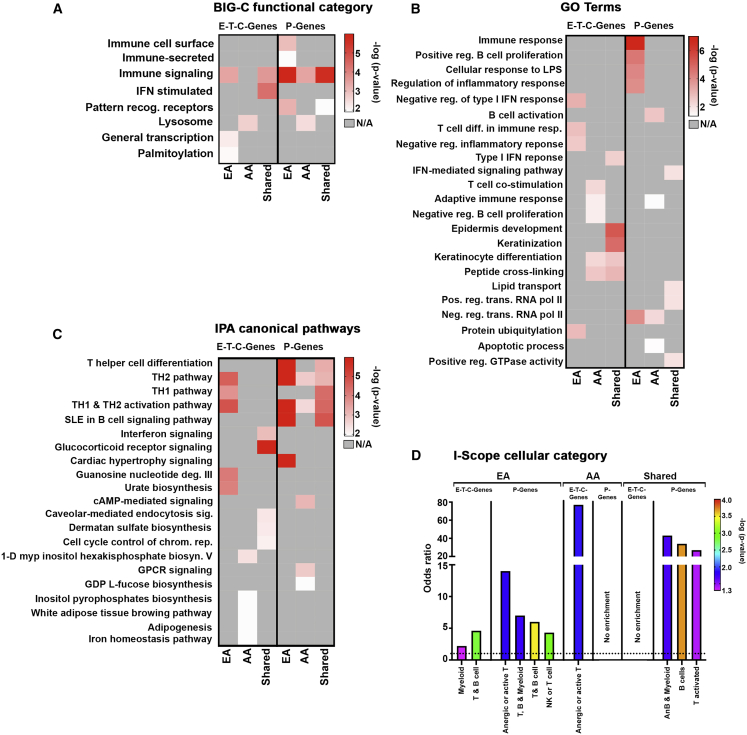
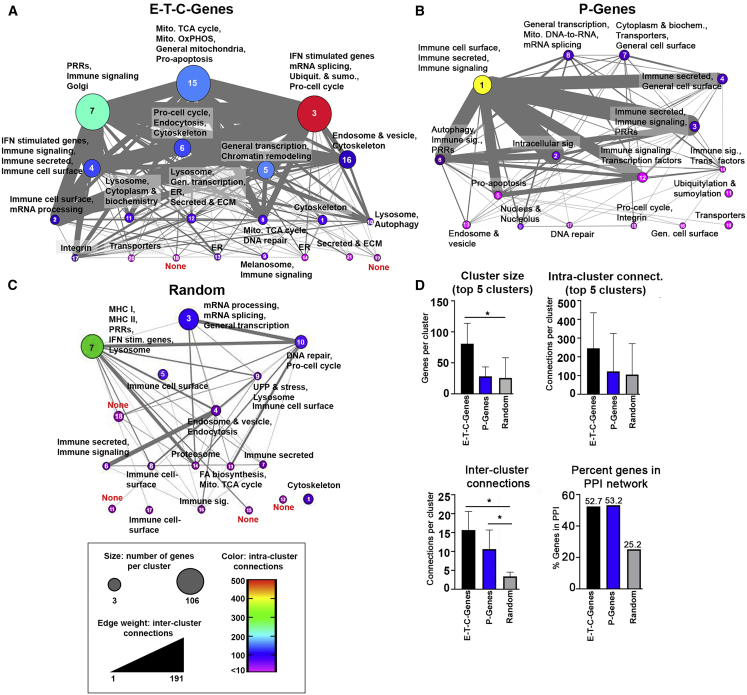
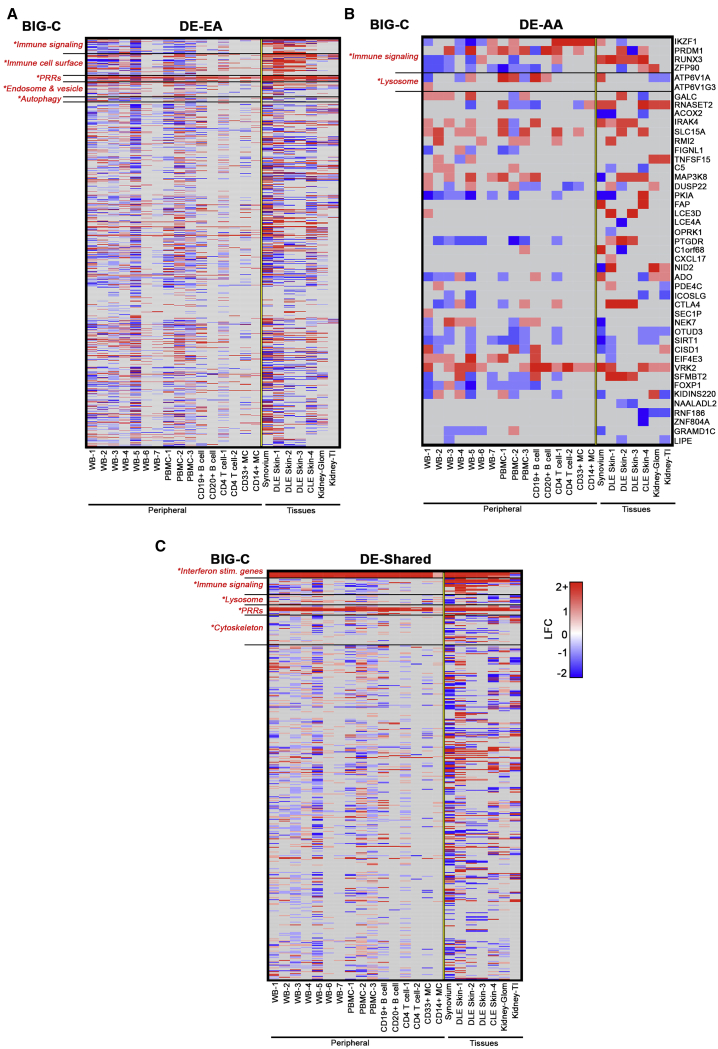
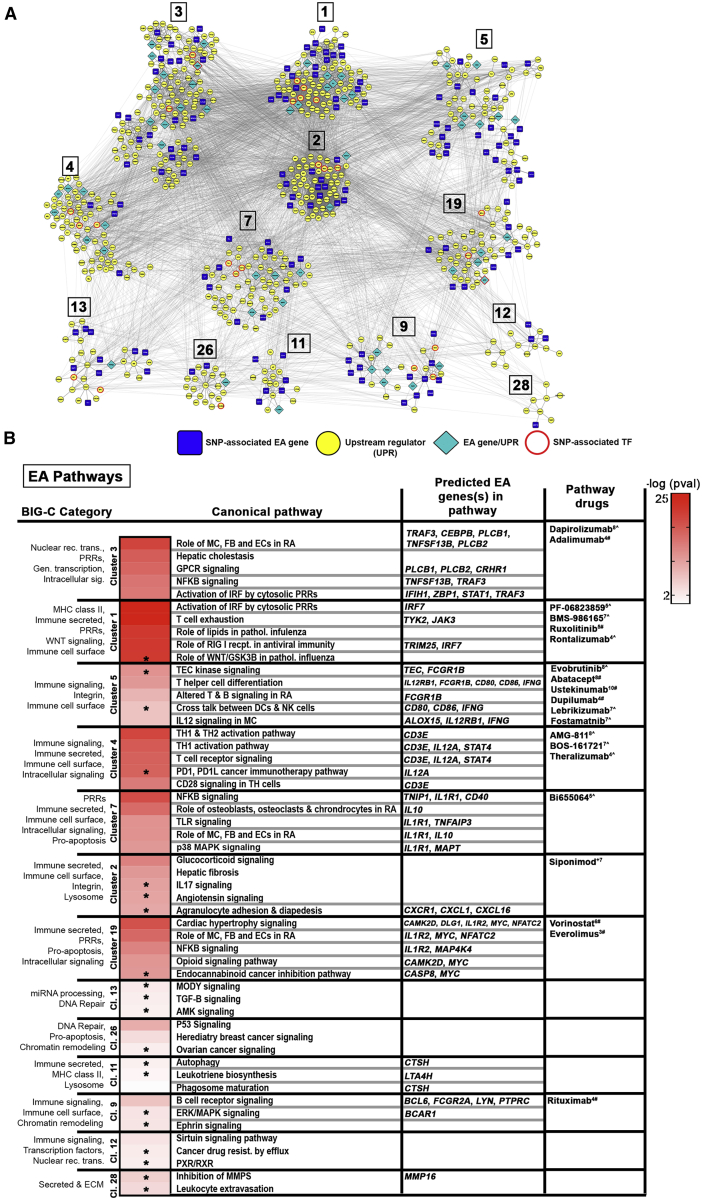
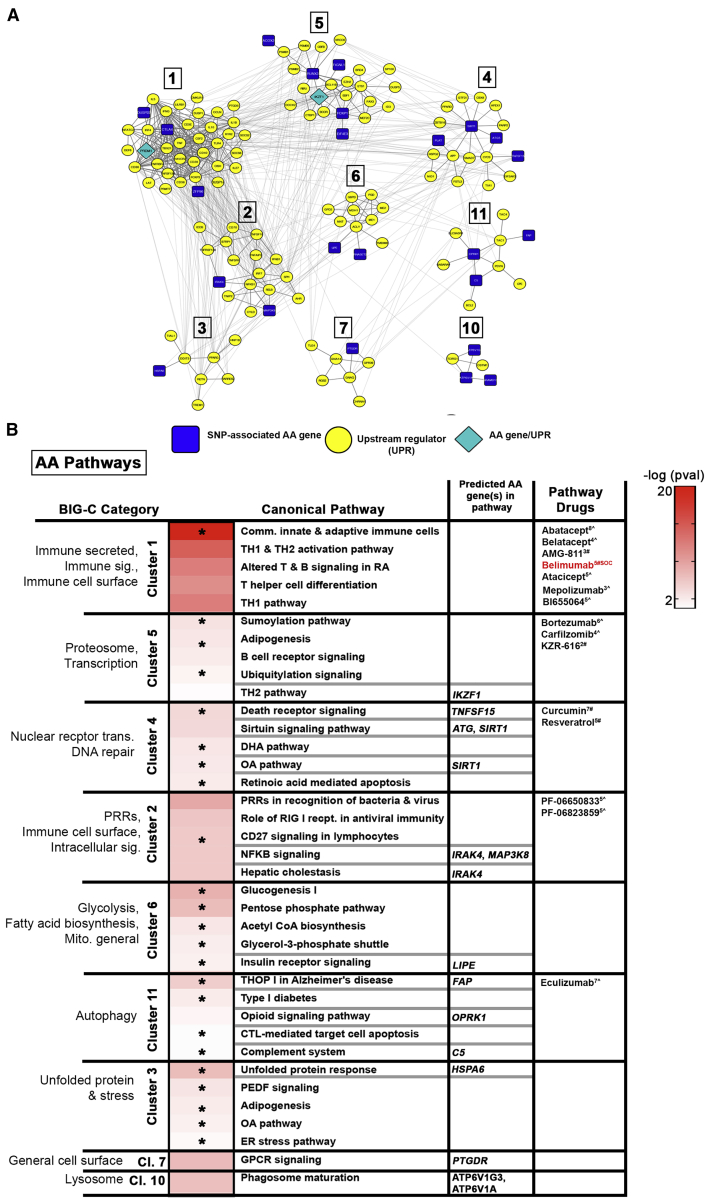
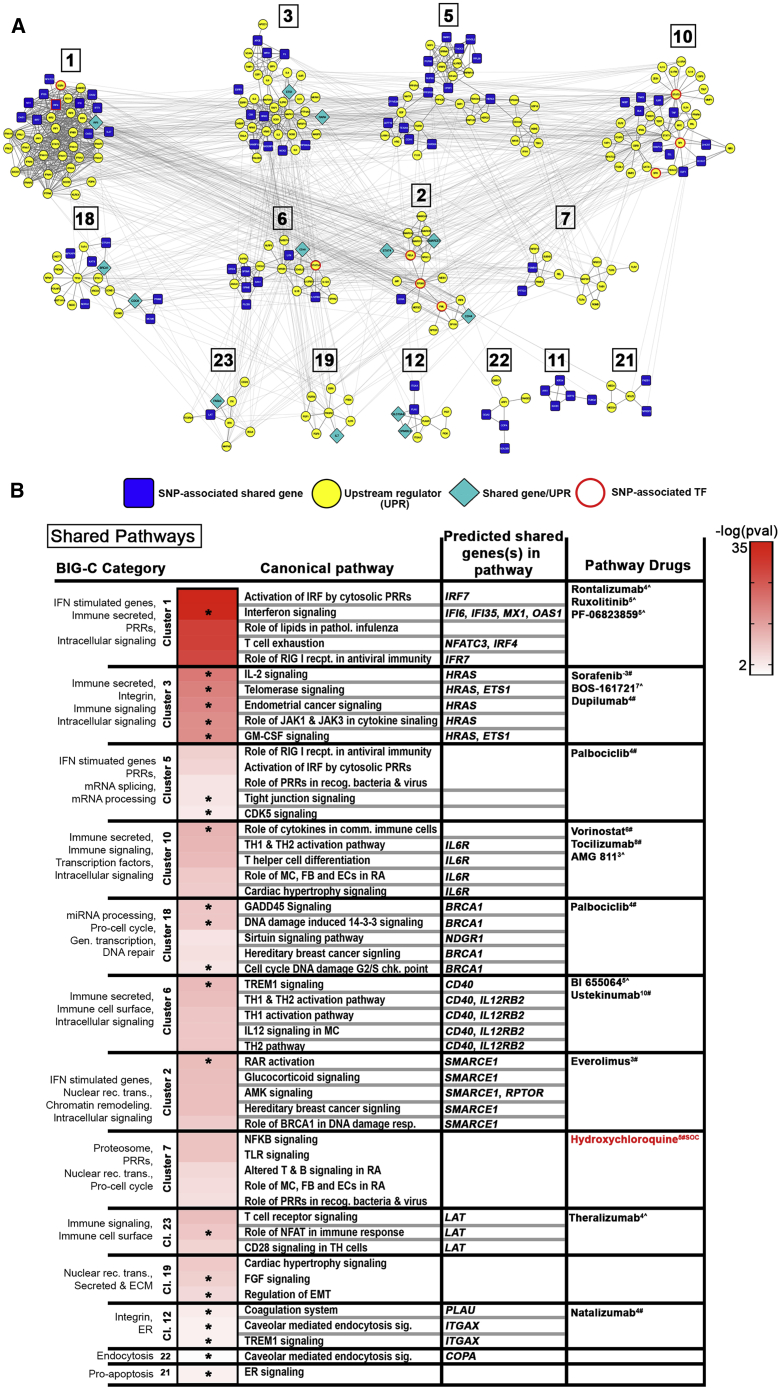
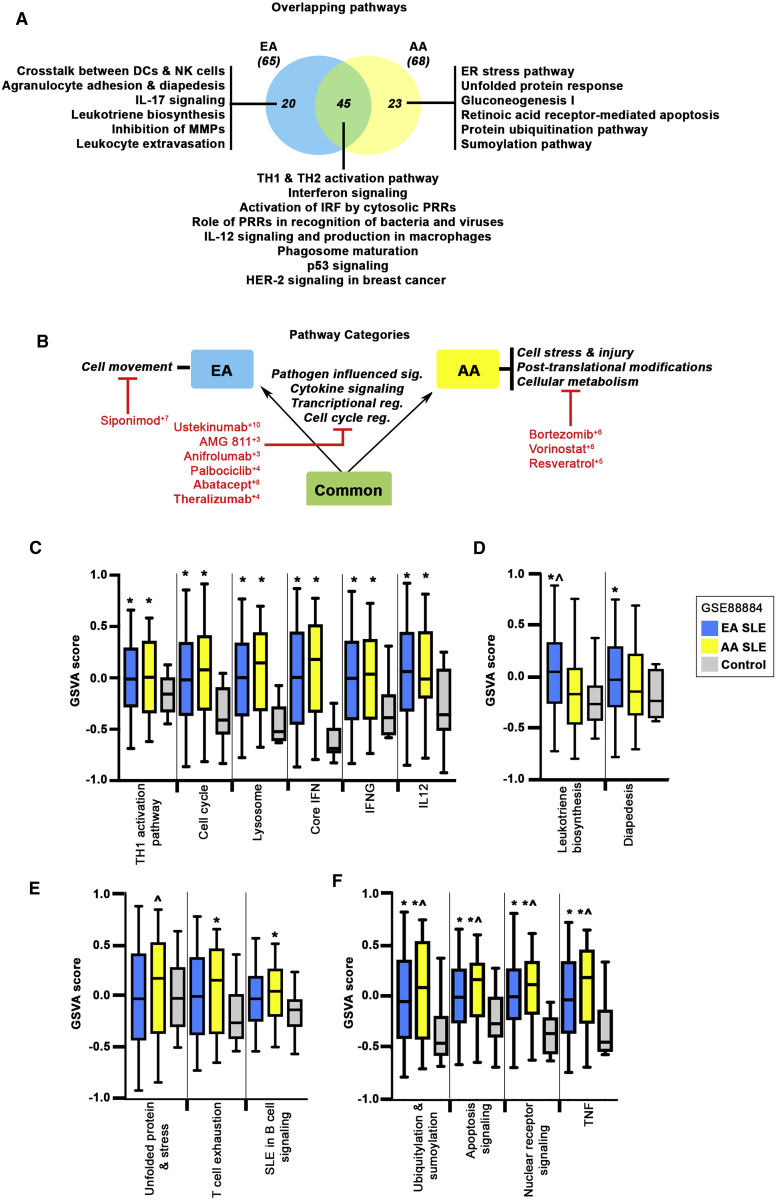
Systemic lupus erythematosus (SLE) is a multi-organ autoimmune disorder with a prominent genetic component. Individuals of African ancestry (AA) experience the disease more severely and with an increased co-morbidity burden compared to European ancestry (EA) populations. We hypothesize that the disparities in disease prevalence, activity, and response to standard medications between AA and EA populations is partially conferred by genomic influences on biological pathways. To address this, we applied a comprehensive approach to identify all genes predicted from SNP-associated risk loci detected with the Immunochip. By combining genes predicted via eQTL analysis, as well as those predicted from base-pair changes in intergenic enhancer sites, coding-region variants, and SNP-gene proximity, we were able to identify 1,731 potential ancestry-specific and trans-ancestry genetic drivers of SLE. Gene associations were linked to upstream and downstream regulators using connectivity mapping, and predicted biological pathways were mined for candidate drug targets. Examination of trans-ancestral pathways reflect the well-defined role for interferons in SLE and revealed pathways associated with tissue repair and remodeling. EA-dominant genetic drivers were more often associated with innate immune and myeloid cell function pathways, whereas AA-dominant pathways mirror clinical findings in AA subjects, suggesting disease progression is driven by aberrant B cell activity accompanied by ER stress and metabolic dysfunction. Finally, potential ancestry-specific and non-specific drug candidates were identified. The integration of all SLE SNP-predicted genes into functional pathways revealed critical molecular pathways representative of each population, underscoring the influence of ancestry on disease mechanism and also providing key insight for therapeutic selection.

Keywords: GWAS; Immunochip; SLE; ancesty; drug repurposing; genetics; lupus; pathway analysis.


Conflict of interest statement

The authors declare no competing interests.

Figures

Figure 1
Figure 1
Mapping the Functional Genes Predicted by SLE-Associated SNPs (A) Distribution of genomic functional categories for all ancestry-specific non-HLA-associated SLE SNPs (tiers 1–3). Non-coding regions include micro (mi)RNAs, long non-coding (lnc)RNAs, introns, and intergenic regions. Regulatory regions include transcription factor binding sites (TFBS), promoters, enhancers, repressors, promoter flanking regions, and open chromatin. Coding regions were broken down further and include 5′ UTRs, 3′ UTRs, and synonymous and nonsynonymous (missense and nonsense) mutations. (B) Functional genes predicted by SNPs are derived from four sources including regulatory elements (T-Genes), eQTL analysis (E-Genes), coding regions (C-Genes), and proximal gene-SNP annotation (P-Genes). (C and D) Venn diagram depicting the overlap of all SLE-associated SNPs (C) and all predicted E-, T-, P-, and C- Genes (D).
Figure 2
Figure 2
Functional Characterization of Predicted Genes (A) Ancestry-dependent and -independent SNP-predicted genes were analyzed to determine enrichment using functional definitions from the BIG-C (Biologically Informed Gene Clustering) annotation library. E-, T-, and C-Genes were analyzed together; P-Genes were examined separately. Enrichment was defined as any category with an odds ratio (OR) > 1 and –log10(p value) > 1.33. (B and C) Heatmap visualization of the top five significant IPA canonical pathways and gene ontogeny (GO) terms for each gene list (E-T-C-Genes and P-Genes) organized by ancestry. Top pathways with –log10(p value) > 1.33 are listed. (D) I-Scope hematopoietic cell enrichment defined as any category with an OR > 1, indicated by the dotted line, and –log10(p value) > 1.33.
Figure 3
Figure 3
Cluster Metastructures for SLE-Predicted and Randomly Generated Genes (A–C) Cluster metastructures were generated based on PPI networks, clustered using MCODE, and visualized in CytoScape. Size indicates the number of genes per cluster, edge weight indicates the number of inter-cluster connections, and color indicates the number of intra-cluster connections. Cluster number is indicated within each metacluster. A random gene network (1,033 genes) was clustered along-side networks for E-T-C-Genes and P-Genes. Functional enrichment for each cluster was determined using BIG-C. (D) Quantitation of cluster size, intra-cluster connections, inter-cluster connections, and the percent of genes incorporated into each network is displayed. Error bars represent the 95% confidence interval; asterisks () indicate a p value < 0.05 using Welch’s t test.
Figure 4
Figure 4
Comparison of EA, AA, and Shared SNP-Predicted Genes with SLE Differential Expression Datasets SNP-predicted genes were matched with SLE differential expression (DE) data and organized by ancestry. The fold-change variation of EA, AA, and shared genes is shown. Heatmaps are organized by BIG-C category. Enriched categories indicated with an asterisk. Enrichment was defined as any category with an OR > 1 and –log10(p value) > 1.33.
Figure 5
Figure 5
Key Pathways Determined by EA Genes and Upstream Regulators (A) Differentially expressed EA genes and their upstream regulators (UPRs) were used to create STRING-based PPI networks. DE EA genes identified as UPRs and SNP-predicted TFs are indicated. Clusters were generated via CytoScape using the MCODE plugin. (B) Top IPA canonical pathways representing individual clusters and enriched (OR > 1, p value < 0.05) BIG-C categories are listed; heatmap depicts the –log(p value) for significant IPA pathways. Unique pathways are indicated by asterisks. Predicted EA genes and select drugs acting on direct gene targets or on any of the pathways are listed. CoLT scores (−16-+11) are in superscript; # denotes FDA-approved drugs, ˆ denotes drugs in development. SOC, standard of care.
Figure 6
Figure 6
Key Pathways Determined by AA Genes and Upstream Regulators (A) Differentially expressed AA genes and their upstream regulators (UPRs) were used to create STRING-based PPI networks. DE AA genes identified as UPRs are indicated. Clusters were generated via CytoScape using the MCODE plugin. (B) Top IPA canonical pathways representing individual clusters and enriched (OR > 1, p value < 0.05) BIG-C categories are listed; heatmap depicts the –log(p value) for significant IPA pathways. Unique pathways are indicated by asterisks. Predicted AA genes and select drugs acting on direct gene targets or on any of the pathways are listed. CoLT scores (−16 to +11) are in superscript; # denotes FDA-approved drugs; ˆ denotes drugs in development. SOC, standard of care.
Figure 7
Figure 7
Key Pathways Determined by Shared Genes and Upstream Regulators (A) Differentially expressed shared genes and their upstream regulators (UPRs) were used to create STRING-based PPI networks. DE shared genes identified as UPRs and SNP-predicted TFs are indicated. Clusters were generated via CytoScape using the MCODE plugin. (B) Top IPA canonical pathways representing individual clusters and enriched (OR > 1, p value < 0.05) BIG-C categories are listed; heatmap depicts the –log(p value) for significant IPA pathways. Unique pathways are indicated by asterisks. Predicted shared genes and select drugs acting on direct gene targets or on any of the pathways are listed. CoLT scores (−16 to +11) are in superscript; # denotes FDA-approved drugs; ˆ denotes drugs in development. SOC, standard of care.
Figure 8
Figure 8
Overlapping Pathways and Categories Defining the EA and AA Predicted Gene Sets (A) Venn diagram showing the number of overlapping pathways between EA and AA predicted genes and their UPRs. Representative IPA canonical pathways are indicated. (B) Overall pathway categories are defined; shared categories are between the arrows, EA-specific (left) and AA-specific categories (right) are indicated. Select drugs at points of intervention are noted. Superscript denotes CoLT score. (C–F) GSVA enrichment scores were calculated for ancestry-specific and independent gene signatures in patient WB (GEO: GSE88885). GSVA signature scores (C) separating SLE-affected individuals (EA and AA) from control subjects, signature scores (D) distinguishing EA SLE-affected individuals from AA subjects and/or healthy control subjects, signature scores (E) distinguishing AA SLE-affected individuals from EA subjects or control subjects, and signature scores (F) separating SLE-affected individuals (EA and AA) from control subjects and that are additionally elevated in AA subjects compared to EA subjects. Error bars indicate 95% confidence interval. Asterisks () indicate a p value < 0.05 using Welch’s t test comparing SLE to control; ˆ indicates a p value < 0.05 using Welch’s t test comparing EA to AA.

References

    1. Rullo O.J., Tsao B.P. Recent insights into the genetic basis of systemic lupus erythematosus. Ann. Rheum. Dis. 2013;72(Suppl 2):ii56–ii61. - PMC - PubMed
    1. Bentham J., Morris D.L., Graham D.S.C., Pinder C.L., Tombleson P., Behrens T.W., Martín J., Fairfax B.P., Knight J.C., Chen L. Genetic association analyses implicate aberrant regulation of innate and adaptive immunity genes in the pathogenesis of systemic lupus erythematosus. Nat. Genet. 2015;47:1457–1464. - PMC - PubMed
    1. Morris D.L., Sheng Y., Zhang Y., Wang Y.F., Zhu Z., Tombleson P., Chen L., Cunninghame Graham D.S., Bentham J., Roberts A.L. Genome-wide association meta-analysis in Chinese and European individuals identifies ten new loci associated with systemic lupus erythematosus. Nat. Genet. 2016;48:940–946. - PMC - PubMed
    1. Lessard C.J., Sajuthi S., Zhao J., Kim K., Ice J.A., Li H., Ainsworth H., Rasmussen A., Kelly J.A., Marion M. Identification of a Systemic Lupus Erythematosus Risk Locus Spanning ATG16L2, FCHSD2, and P2RY2 in Koreans. Arthritis Rheumatol. 2016;68:1197–1209. - PMC - PubMed
    1. Alarcón-Riquelme M.E., Ziegler J.T., Molineros J., Howard T.D., Moreno-Estrada A., Sánchez-Rodríguez E., Ainsworth H.C., Ortiz-Tello P., Comeau M.E., Rasmussen A. Genome-Wide Association Study in an Amerindian Ancestry Population Reveals Novel Systemic Lupus Erythematosus Risk Loci and the Role of European Admixture. Arthritis Rheumatol. 2016;68:932–943. - PMC - PubMed

Publication types

MeSH terms