

Long-term exposure to NO2 and O3 and all-cause and respiratory mortality: A systematic review and meta-analysis
- PMID: 33032072
- PMCID: PMC7549128
- DOI: 10.1016/j.envint.2020.105998
Long-term exposure to NO2 and O3 and all-cause and respiratory mortality: A systematic review and meta-analysis
Abstract
Background: WHO has published several volumes of Global Air Quality Guidelines to provide guidance on the health risks associated with exposure to outdoor air pollution. As new scientific evidence is generated, air quality guidelines need to be periodically revised and, where necessary, updated.
Objectives: The aims of the study were 1) to summarise the available evidence on the effect of long-term exposure to ozone (O3) and nitrogen dioxide (NO2) on mortality; 2) and to assess concentration response functions (CRF), their shape and the minimum level of exposures measured in studies to support WHO's update of the global air quality guidelines.
Data sources: We conducted a systematic literature search of the Medline, Embase and Web of Science databases following a protocol proposed by WHO and applied Preferred Reporting Items for Systematic Review and Meta-Analyses (PRISMA) guidelines for reporting our results.
Study eligibility criteria: Cohort studies in human populations (including sub-groups at risk) exposed to long-term concentrations of NO2 and O3. Outcomes assessed were all-cause, respiratory, Chronic Obstructive Pulmonary Disease (COPD) and Acute Lower Respiratory Infection (ALRI) mortality.
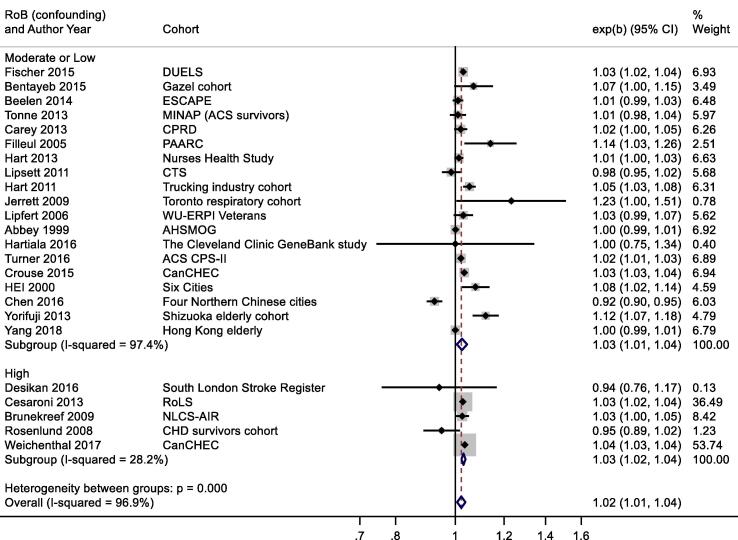
Study appraisal and synthesis methods: Studies included in the meta-analyses were assessed using a new Risk of Bias instrument developed by a group of experts convened by WHO. Study results are presented in forest plots and quantitative meta-analyses were conducted using random effects models. The certainty of evidence was assessed using a newly developed adaptation of GRADE.
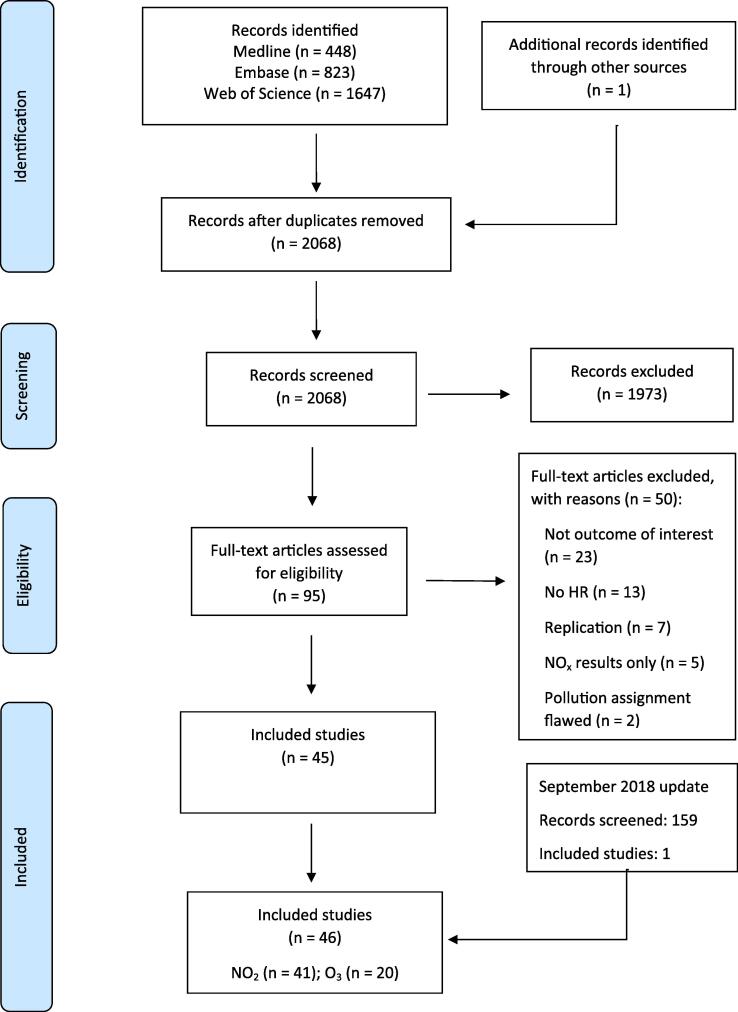
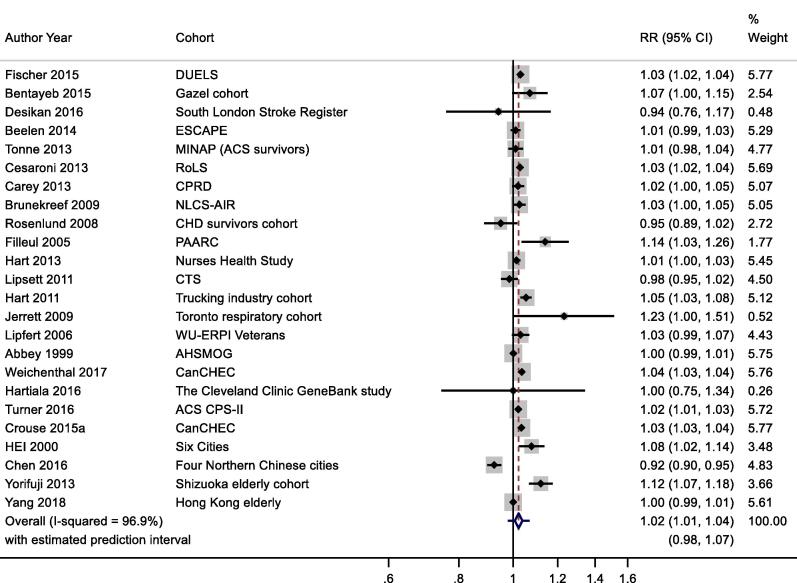
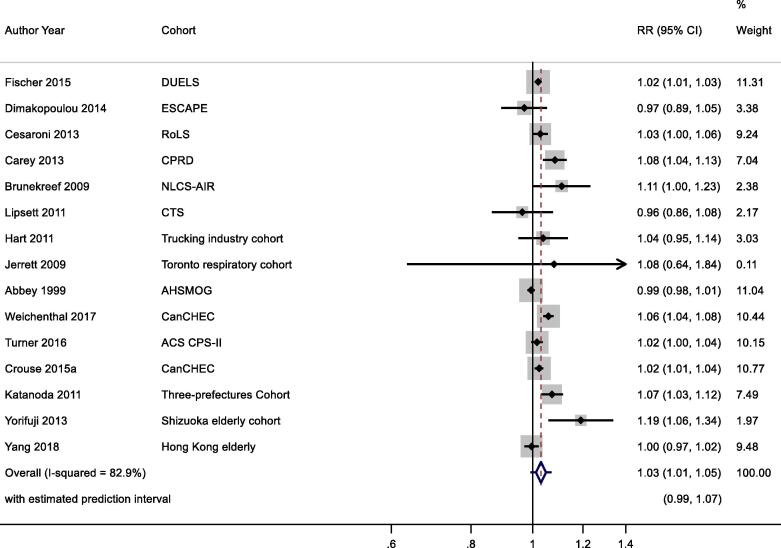
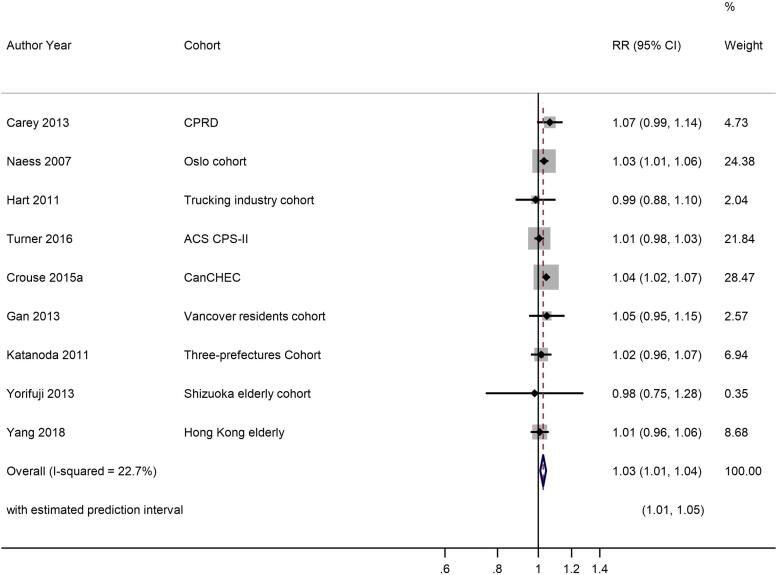
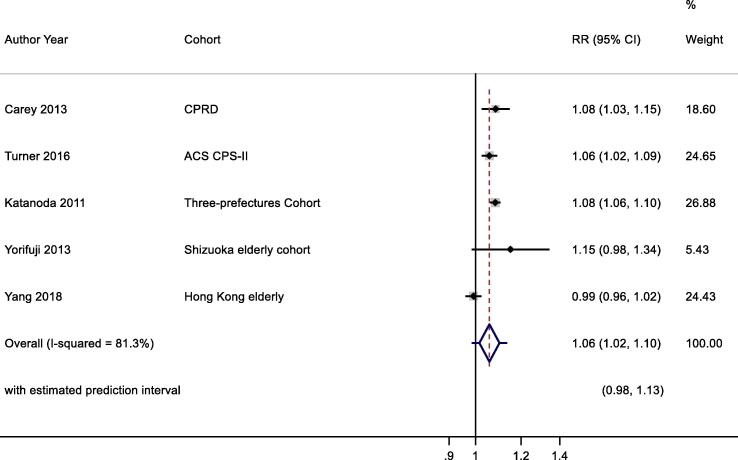
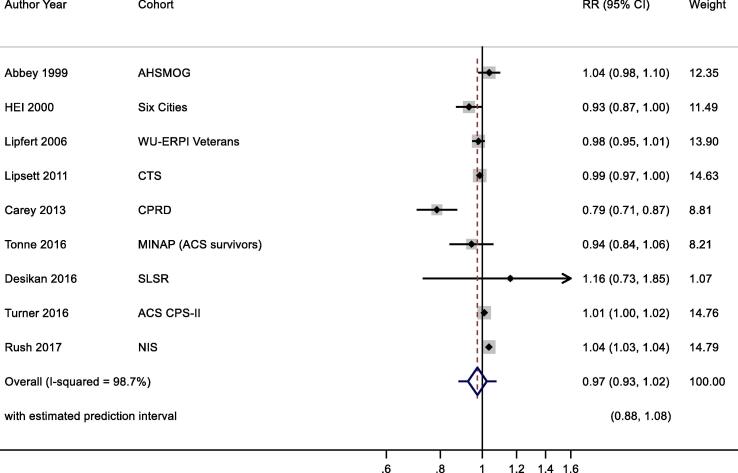
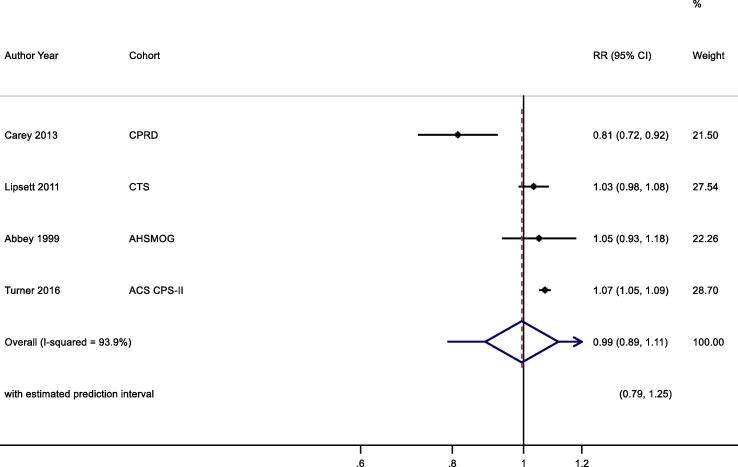
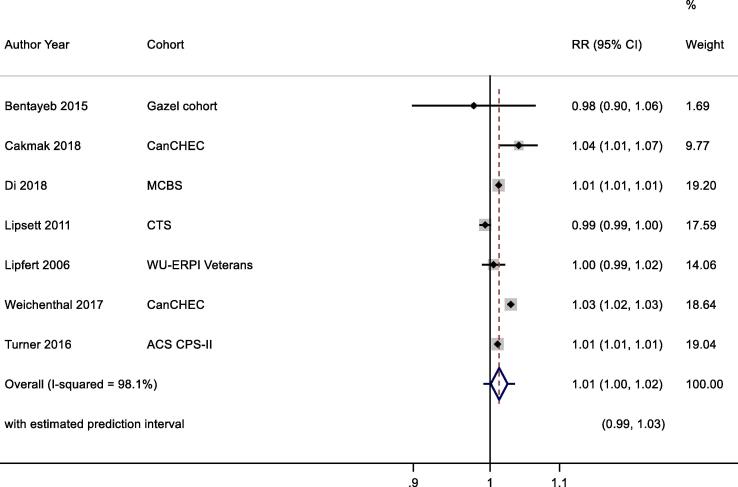
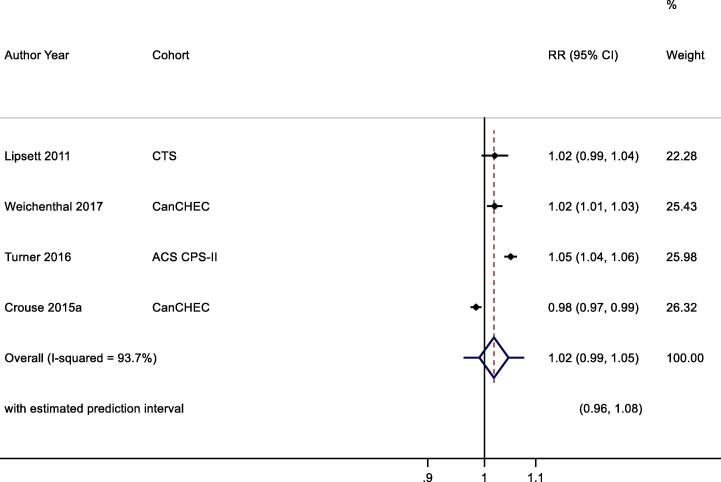
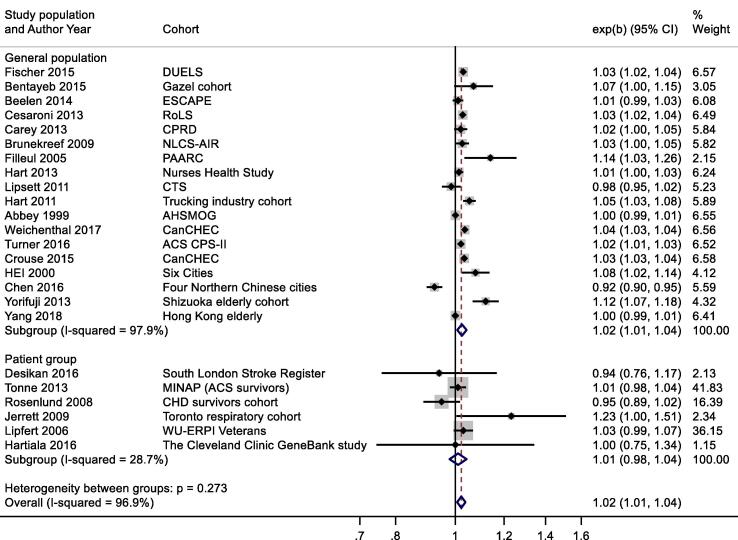
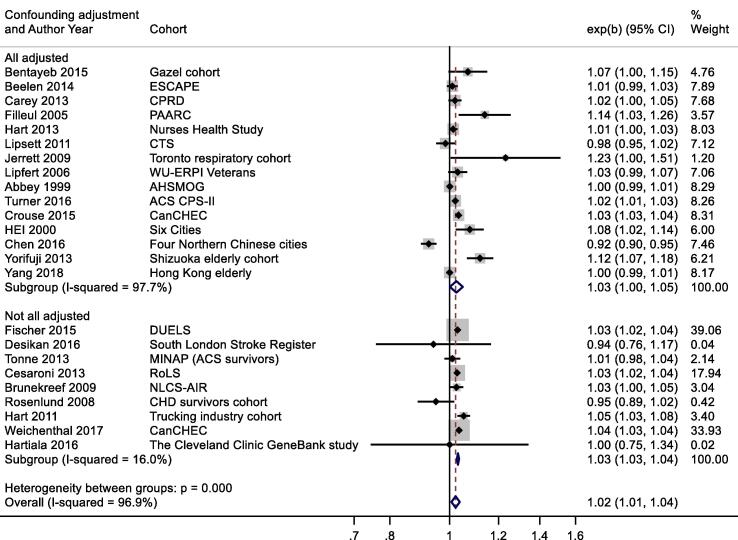
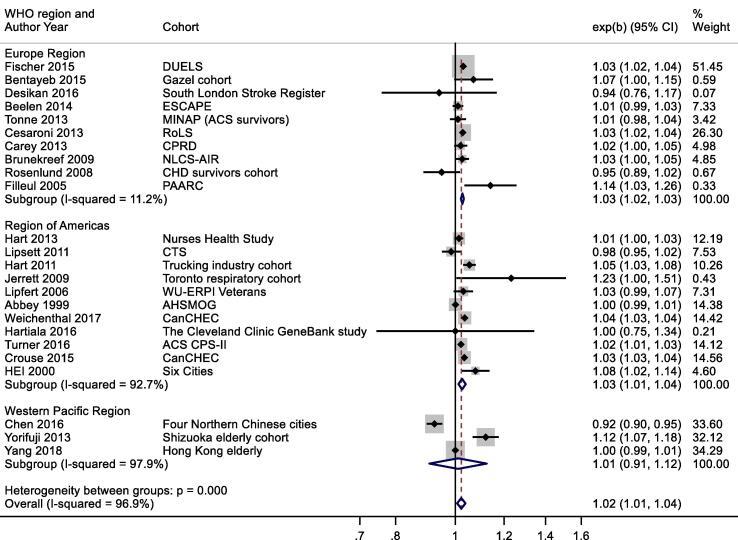
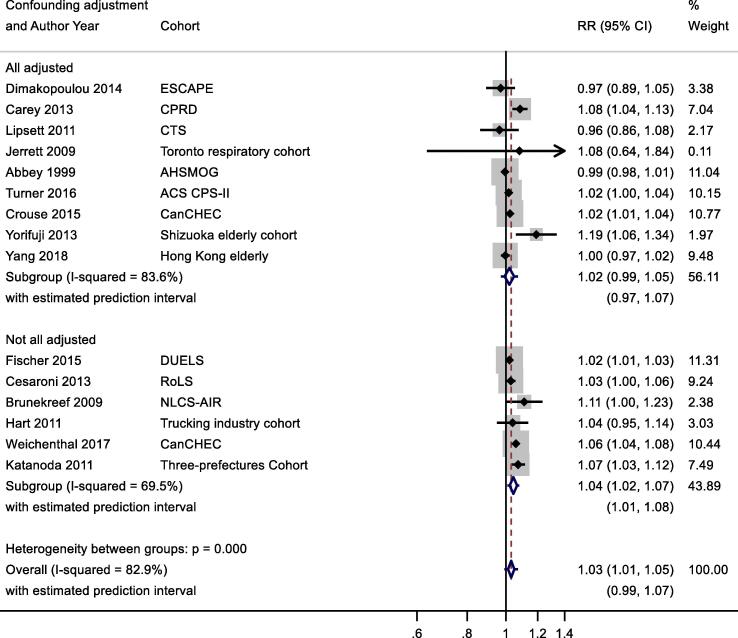
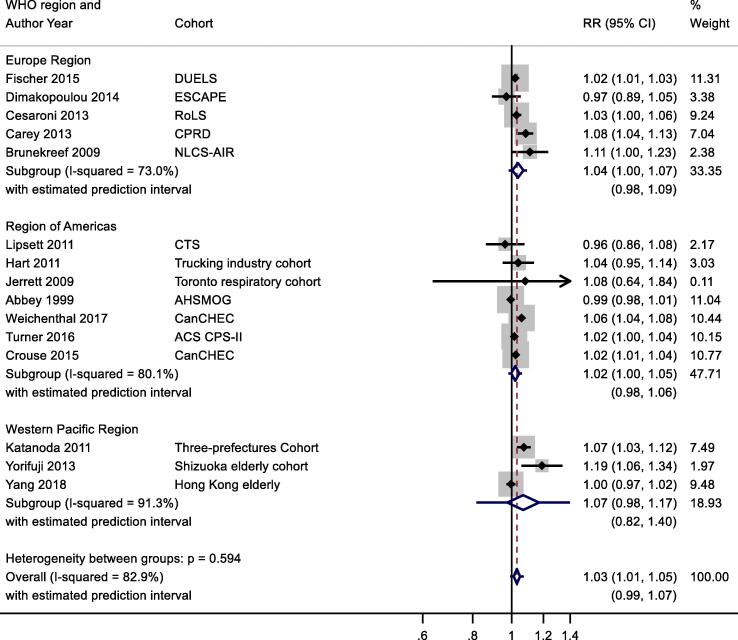
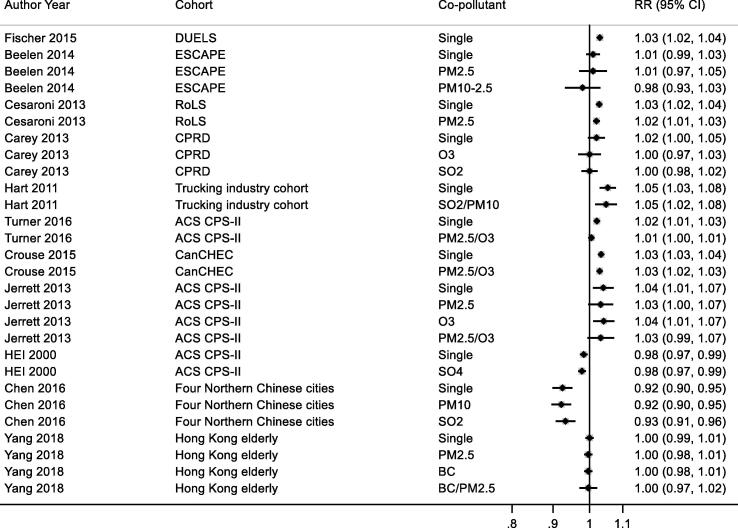
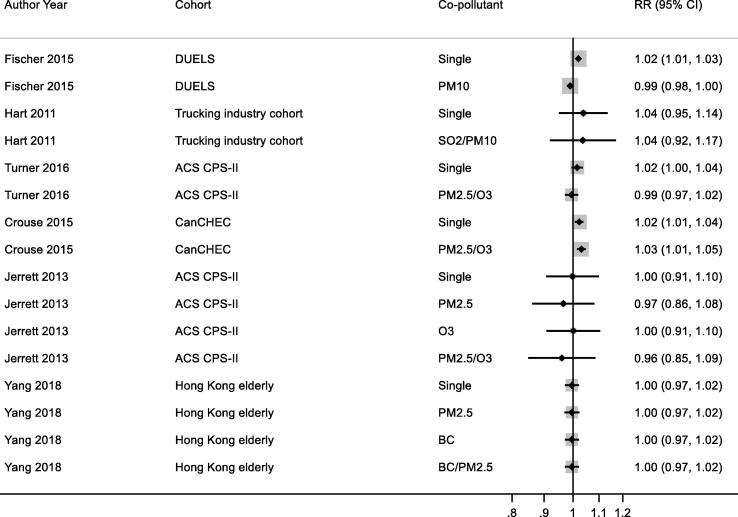
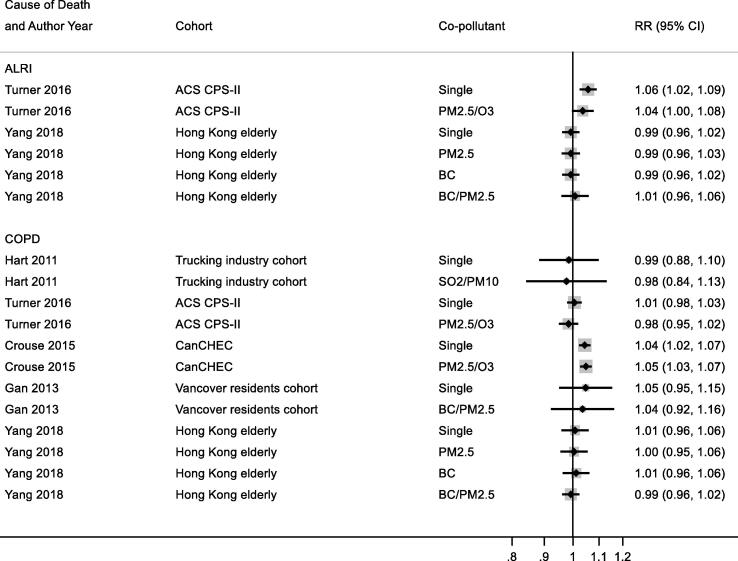
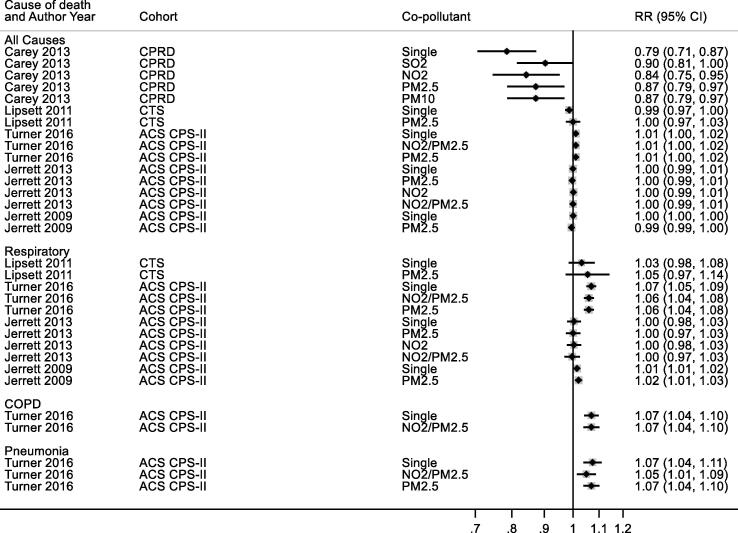
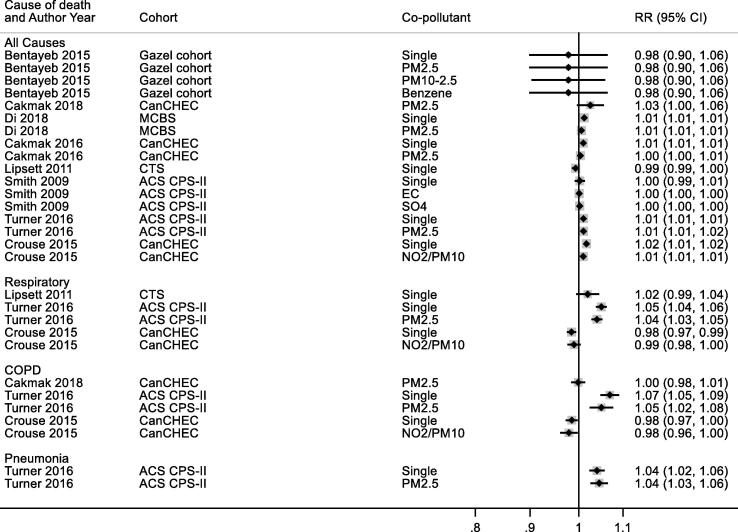
Results: The review identified 2068 studies of which 95 were subject to full-text review with 45 meeting the inclusion criteria. An update in September 2018 identified 159 studies with 1 meeting the inclusion criteria. Of the 46 included studies, 41 reported results for NO2 and 20 for O3. The majority of studies were from the USA and Europe with the remainder from Canada, China and Japan. Forty-two studies reported results for all-cause mortality and 22 for respiratory mortality. Associations for NO2 and mortality were positive; random-effects summary relative risks (RR) were 1.02 (95% CI: 1.01, 1.04), 1.03 (1.00, 1.05), 1.03 (1.01, 1.04) and 1.06 (1.02, 1.10) per 10 μg/m3 for all-cause (24 cohorts), respiratory (15 cohorts), COPD (9 cohorts) and ALRI (5 cohorts) mortality respectively. The review identified high levels of heterogeneity for all causes of death except COPD. A small number of studies investigated the shape of the concentration-response relationship and generally found little evidence to reject the assumption of linearity across the concentration range. Studies of O3 using annual metrics showed the associations with all-cause and respiratory mortality were 0.97 (0.93, 1.02) and 0.99 (0.89, 1.11) per 10 μg/m3 respectively. For studies using peak O3 metrics, the association with all-cause mortality was 1.01 (1.00, 1.02) and for respiratory mortality 1.02 (0.99, 1.05), each per 10 μg/m3. The review identified high levels of heterogeneity. Few studies investigated the shape of the concentration-response relationship. Certainty in the associations (adapted GRADE) with mortality was rated low to moderate for each exposure-outcome pair, except for NO2 and COPD mortality which was rated high.
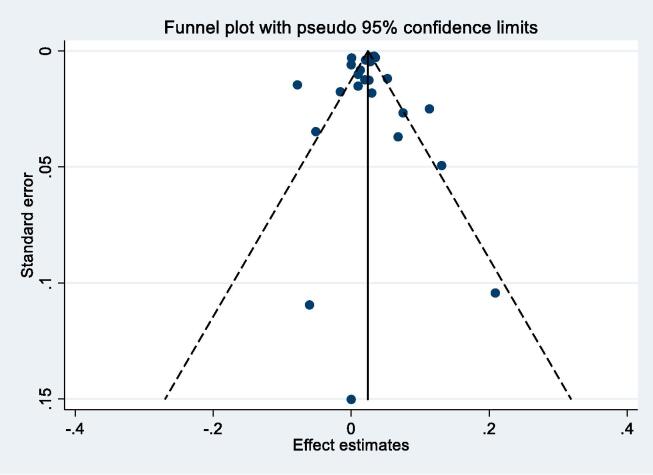
Limitations: The substantial heterogeneity for most outcomes in the review requires explanation. The evidence base is limited in terms of the geographical spread of the study populations and, for some outcomes, the small number of independent cohorts for meta-analysis precludes meaningful meta-regression to explore causes of heterogeneity. Relatively few studies assessed specifically the shape of the CRF or multi-pollutant models.
Conclusions: The short-comings in the existing literature base makes determining the precise nature (magnitude and linearity) of the associations challenging. Certainty of evidence assessments were moderate or low for both NO2 and O3 for all causes of mortality except for NO2 and COPD mortality where the certainty of the evidence was judged as high.
Keywords: Cohort; Meta-analysis; Mortality; Nitrogen dioxide; Ozone; Systematic review.
Copyright © 2020 The Authors. Published by Elsevier Ltd.. All rights reserved.
Conflict of interest statement
The authors declare that they have no known competing financial interests or personal relationships that could have appeared to influence the work reported in this paper.
Figures
References
-
- Abbey D.E., Nishino N., McDonnell W.F., Burchette R.J., Knutsen S.F., Beeson W.L. Long-term inhalable particles and other air pollutants related to mortality in nonsmokers. Am. J. Respir. Crit. Care Med. 1999;159(2):373–382. - PubMed
-
- UK Air Information Resource DfEFRA; 2005.
-
- Beelen R., Raaschou-Nielsen O., Stafoggia M., Andersen Z.J., Weinmayr G., Hoffmann B. Effects of long-term exposure to air pollution on natural-cause mortality: an analysis of 22 European cohorts within the multicentre ESCAPE project. The Lancet. 2014;383(9919):785–795. - PubMed
Publication types
MeSH terms
Substances
LinkOut - more resources
Full Text Sources
Medical
Research Materials
