. 2020 Oct:37:101736.
doi: 10.1016/j.redox.2020.101736. Epub 2020 Sep 24.

Involvement of the mitochondrial nuclease EndoG in the regulation of cell proliferation through the control of reactive oxygen species

Affiliations

Involvement of the mitochondrial nuclease EndoG in the regulation of cell proliferation through the control of reactive oxygen species

Natividad Blasco et al. Redox Biol. 2020 Oct.

Abstract

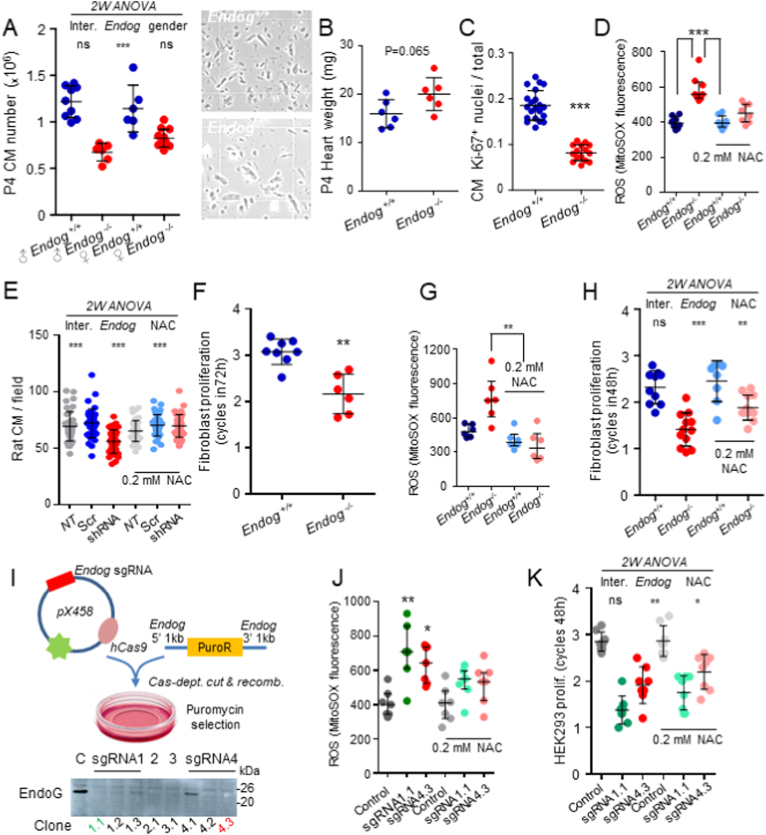
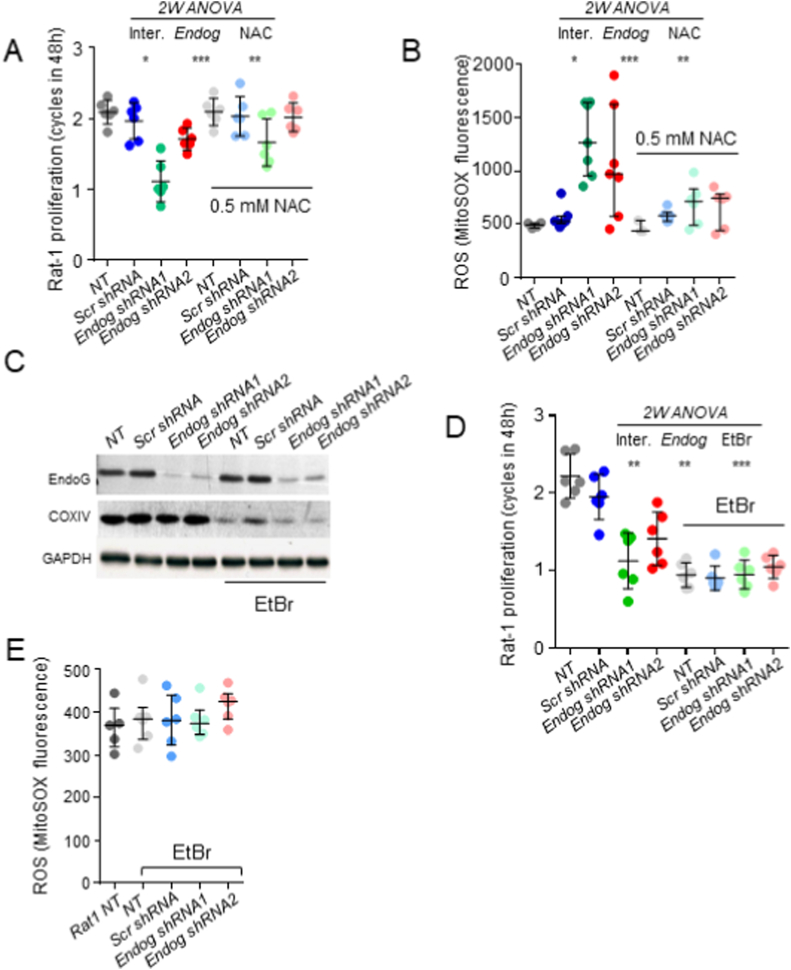
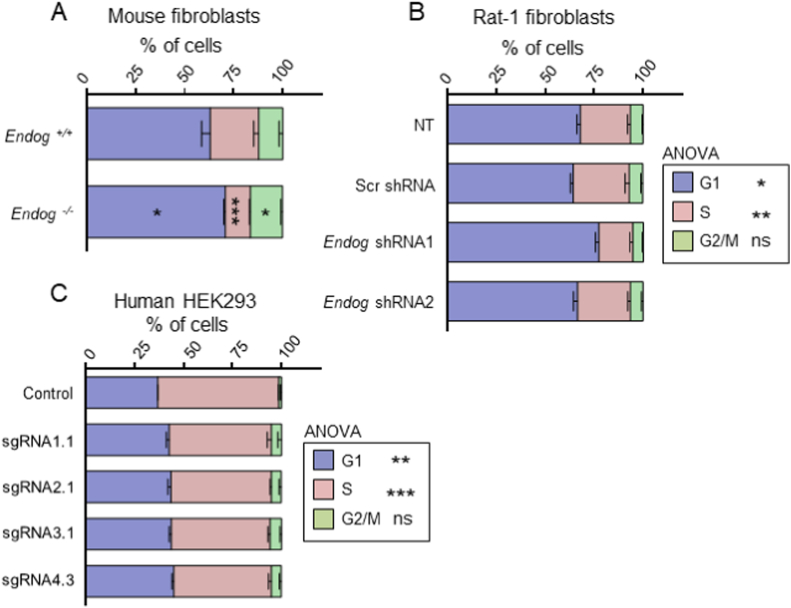
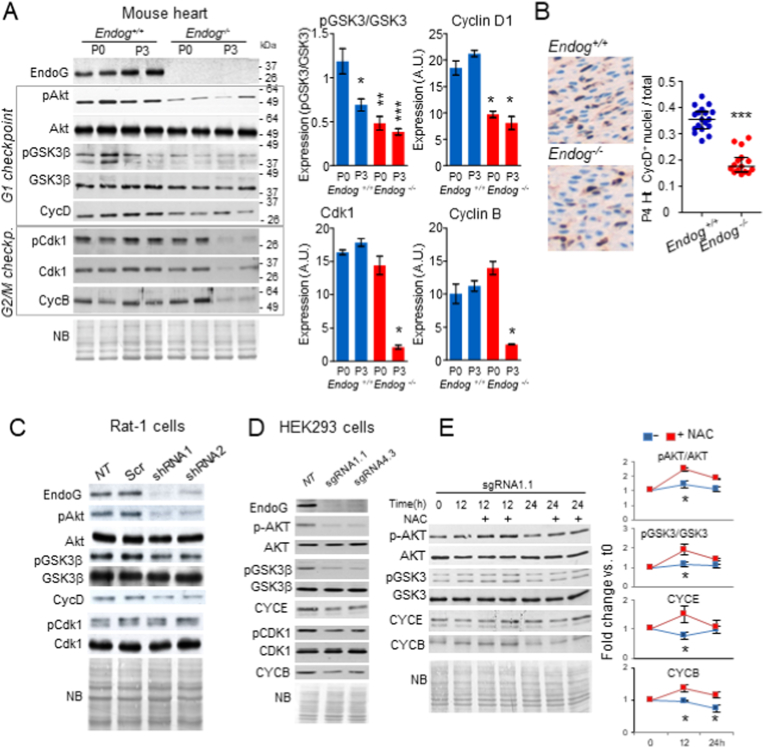
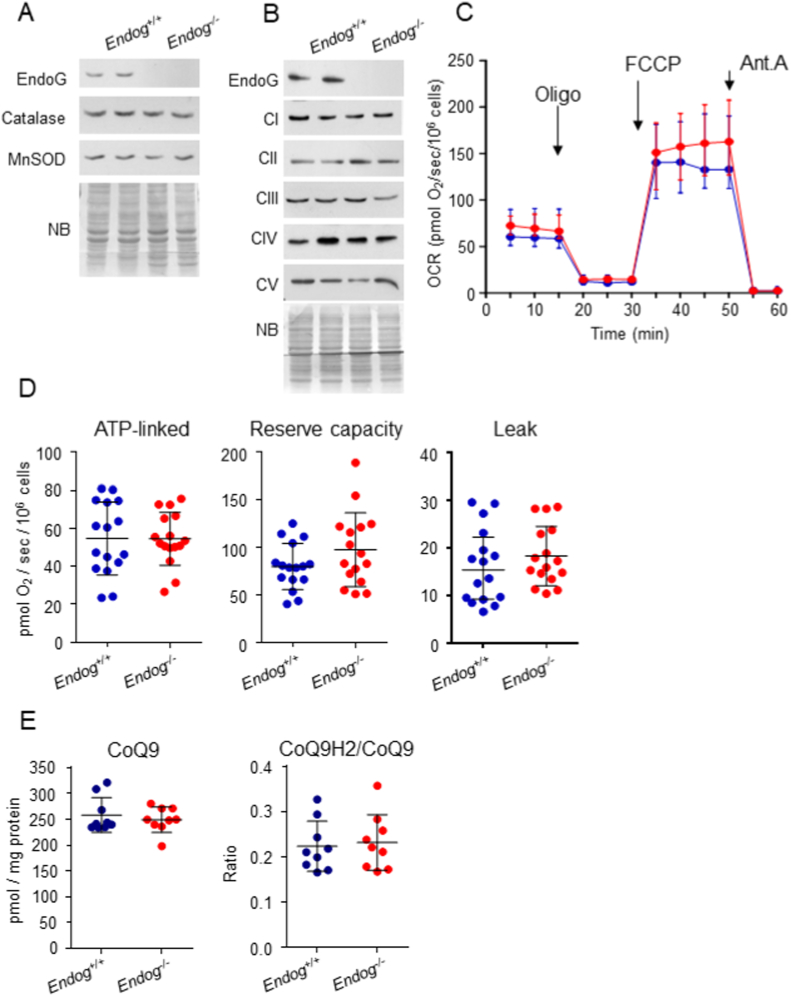
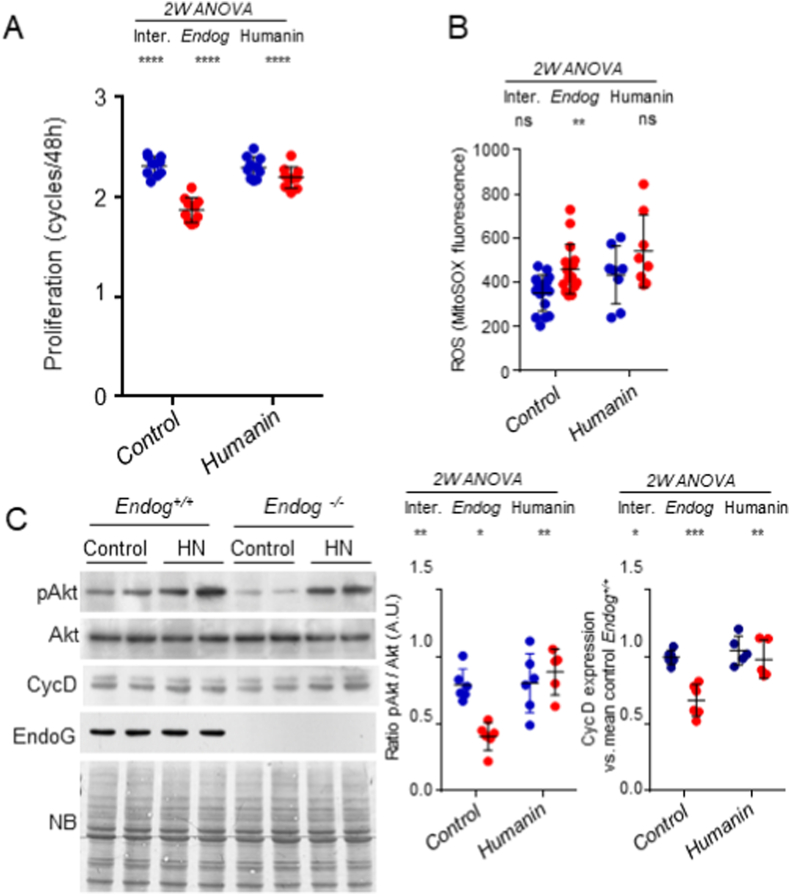
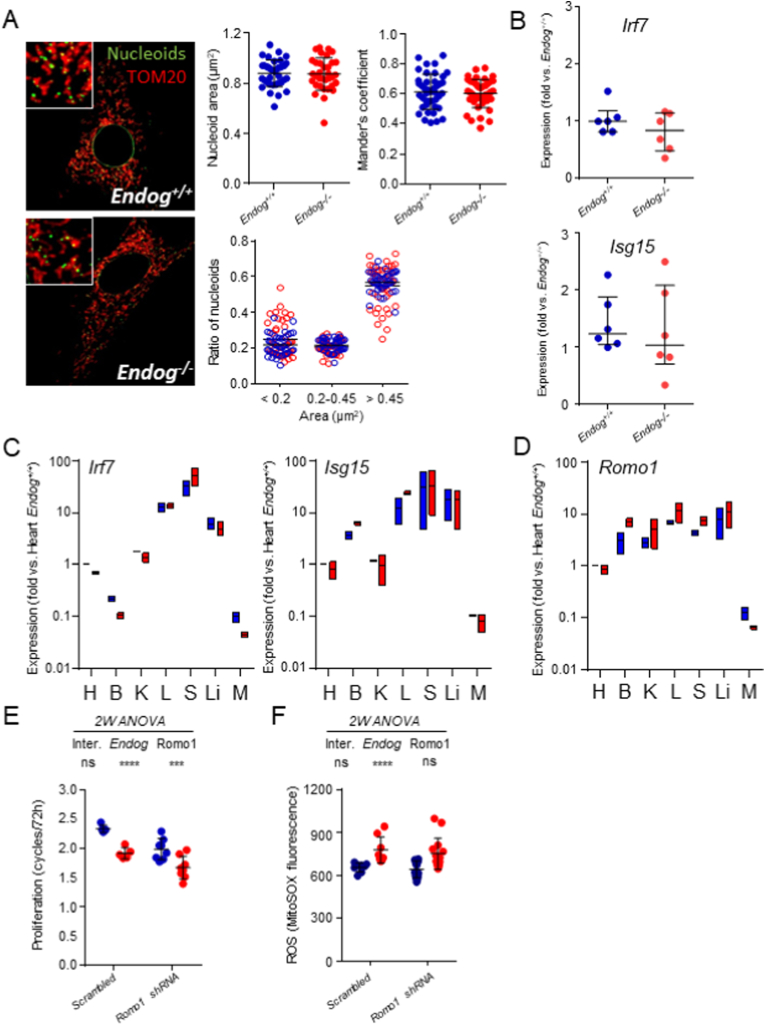
The apoptotic nuclease EndoG is involved in mitochondrial DNA replication. Previous results suggested that, in addition to regulate cardiomyocyte hypertrophy, EndoG could be involved in cell proliferation. Here, by using in vivo and cell culture models, we investigated the role of EndoG in cell proliferation. Genetic deletion of Endog both in vivo and in cultured cells or Endog silencing in vitro induced a defect in rodent and human cell proliferation with a tendency of cells to accumulate in the G1 phase of cell cycle and increased reactive oxygen species (ROS) production. The defect in cell proliferation occurred with a decrease in the activity of the AKT/PKB-GSK-3β-Cyclin D axis and was reversed by addition of ROS scavengers. EndoG deficiency did not affect the expression of ROS detoxifying enzymes, nor the expression of the electron transport chain complexes and oxygen consumption rate. Addition of the micropeptide Humanin to EndoG-deficient cells restored AKT phosphorylation and proliferation without lowering ROS levels. Thus, our results show that EndoG is important for cell proliferation through the control of ROS and that Humanin can restore cell division in EndoG-deficient cells and counteracts the effects of ROS on AKT phosphorylation.

Keywords: Cell proliferation; Cell signaling; EndoG; Humanin; Mitochondria; Reactive oxygen species; Romo1.


Conflict of interest statement

None.

Figures

Fig. 1
Fig. 1
Analysis of the impact of Endog expression in cell proliferation and ROS abundance in diverse mouse, rat and human cell types. A) Cardiomyocyte (CM) number was counted from 5 to 9 hearts of Endog+/+ and Endog−/− of 4-days-old (P4) male and female mice (representative images shown at right), after digestion of the ventricular tissue that was previously weighted (B). C) Quantification of the expression of the proliferation-related Ki-67 nuclear antigen in histological ventricular tissue preparations from P4 Endog+/+ and Endog−/− mice. Ki-67+ nuclei were counted in 3 different slices from 3 hearts/genotype and data are expressed as Ki-67+ nuclei/total nuclei in the slice. All individual quantifications are plotted (1000–2000 nuclei/genotype). D) MitoSOX™ fluorescence was quantified by flow cytometry in preparations of ventricular cardiomyocytes from P4 Endog+/+ and Endog−/− mice cultured in the presence or absence of 0.2 mM N-Acetyl-Cysteine (NAC; n = 6). E) Neonatal rat ventricular cardiomyocyte cultures were left untreated (NT, not transduced), transduced with a scrambled sequence (Scr) or an Endog-specific silencing sequence (shRNA) and then treated or not with 0.2 mM NAC for 48 h. Cells were fixed and stained with muscle-specific α-actinin (cardiomyocytes) and Hoechst dye (nuclei). Cardiomyocytes were counted in 10 different microscopic fields/treatment in 4 independent experiments. All 40 values/treatment are plotted. F) Skin fibroblasts were obtained from P4 Endog+/+ and Endog−/− mice, plated and amplified. Equal number of cells were seeded in 2 plates/genotype and counted after 72 h. Data are expressed as the number of cell cycles completed in 72 h.Cells in replicate plates were counted at time zero to confirm equal initial cell number. All values from 4 independent experiments are plotted. G) MitoSOX™ fluorescence was quantified as in (D) in preparations of Endog+/+ and Endog−/− fibroblasts treated or not with NAC. H) Endog+/+ and Endog−/− fibroblasts were seeded in presence or absence of NAC and counted after 48 h. Conditions are as in F. I) Strategy for the CRISPR-Cas9-dependent ENDOG gene truncation by insertion of the puromycin resistance cassette (PuroR), using homologous recombination in 4 different selected sites within the ENDOG gene in HEK293 human cells. Expression of ENDOG was analyzed in control cells (C) and several clones from each of the four PuroR insertion sites (see Material and methods section). J) MitoSOX™ fluorescence was quantified as in (D) in preparations of control cells and cells from CRISPR-Cas9-treated clones 1.1 and 4.3 treated or not with 0.2 mM NAC (n = 7). K) HEK293 cells were counted in control and ENDOG-deficient cultures from clones 1.1 and 4.3 cultured for 48 h, treated or not with NAC. Proliferation was expressed as cell cycles completed in 48 h. Data plotted are from four experiments performed in duplicates. Graphs show experimental values plus mean ± SD, except D, G and J where median ± interquartile range is depicted. Analysis of the effect of Endog expression in the experimental values was performed with the Student's t-test (B, C and F). 2-way ANOVA was used to analyze the influence of Endog expression and gender (A) or NAC treatment (E, H and K) and the interaction between them in cell number. The Kruskal-Wallis test was used to compare the effects of Endog expression and NAC addition on MitoSOX™ fluorescence followed by the Dunn's test for selected post hoc comparisons (D, G and J). ns = not significant; *, p < 0.05; **, p < 0.01; ***, p < 0.001.
Fig. 2
Fig. 2
Analysis of the influence of Endog expression in cell proliferation and ROS production in the Rat-1 cell line, and its dependence on the abundance of mitochondrial DNA. A) Equal number of Rat-1 control cells (NT, not transduced), scrambled-transduced (Scr) cells and cells transduced with either of two independent Endog silencing constructs were seeded in duplicates and the number of cells after 48 h was counted. Data are expressed as the number of cell cycles completed in 48 h in the presence or absence of the ROS scavenger NAC (0.5 mM). All values from 3 independent experiments are plotted plus mean ± SD. B) MitoSOX™ fluorescence was quantified by flow cytometry in preparations of the same experimental groups as in (A). C) Rat-1 cells were pre-treated with EtBr to reduce the mitochondrial DNA (mtDNA) content (see Materials and Methods section for details). Then, normal cells and EtBr-treated cells (EtBr) were transduced with scrambled (Scr) or two independent Endog-specific silencing constructs (Endog shRNA1, 2). Western Blot of EndoG assessing the efficacy of the silencing constructs and COXIV expression assessing the effect of EtBr treatment on mtDNA depletion, performed with samples of control and EtBr-treated cells not transduced (NT) or transduced with the different constructs. GAPDH was used as loading control. D) Equal number of control and EtBr-treated Rat-1 cells were seeded, left not transduced (NT) or transduced with scrambled (Scr) or Endog-directed silencing constructs (Endog shRNA1 and 2) in duplicate plates/treatment and counted after 48 h. Data are expressed as the number of cell cycles completed in 48 h. All values from 3 independent experiments in duplicates are plotted plus mean ± SD. E) MitoSOX™ fluorescence was quantified by flow cytometry in preparations of control not transduced cells (NT) or EtBr-treated cells not transduced (NT) or transduced with scrambled (Scr) or Endog-directed silencing constructs (Endog shRNA1 and 2). Values of four independent experiments are plotted plus mean ± SD. Two-way ANOVA was used to analyze the influence of Endog expression and NAC treatment (A, B) or EtBr treatment (D) and the interaction between them in cell proliferation and ROS production. Ns: not significant; *, p < 0.05; **, p < 0.01; ***, p < 0.001.
Fig. 3
Fig. 3
Quantification of the Influence of Endog expression in the distribution of proliferating non-synchronized cells throughout the cell cycle phases. A) Skin fibroblast cultures were obtained from P3 Endog+/+ (n = 3) and Endog−/− (n = 6) mice and passaged two times. After 48 h in the plate, cells were detached, washed, fixed and stained with propidium iodide. The percentage of cells in each cell cycle phase was determined by flow cytometry. B) The same procedure was used for analyzing Rat-1 fibroblasts non transduced (NT) or transduced with scrambled (Scr) or Endog silencing constructs 1 and 2 (Endog shRNA) from 5 experiments; and C) for cultures of control HEK293 cells and HEK293 cell clones harboring a disruption of the ENDOG gene within exon 1 (4 experiments). Data depicted on stacked bar graphs are mean ± SEM. Statistical analysis was performed in A by the Student's t-test, and in C and D by one-way ANOVA followed by the Bonferroni test (ns: not significant; *. p < 0.05; **, p < 0.01; ***, p < 0.001).
Fig. 4.
Fig. 4
Analysis of the influence of Endog depletion in the expression of signal transduction and cell cycle proteins. A) Expression of cell cycle regulators involved in the control of G1/S (Akt, GSK3, and their phosphorylated forms pAkt and pGSK3, Cyclin D1, Cyclin E), and G2/M (CDK1 and its phosphorylated form pCDK1 and Cyclin B in total ventricular extracts of P0 and P3 Endog+/+ and Endog−/− neonatal mice. Densitometry analysis of the Western Blot bands is represented for key genes in the bar-graphs at right. Values are means (n = 3 ± SEM). A.U., arbitrary units. The Kruskal-Wallis test was performed followed by Dunnett's test to compare all values vs. P0 Endog+/+. *, p < 0.005; **, p < 0.001; ***, p < 0.0001. B) Cyclin D immunostaining in ventricular histological preparations from Endog+/+ and Endog−/− neonatal mice. CyclinD+ nuclei were counted and referred to total nuclei in the graph at right. All 18 values from 6 hearts of each genotype are plotted. The Mann-Whitney U test was applied to check for significant differences. ***, p < 0.0001. C) The same cell cycle regulator proteins were analyzed in Rat-1 fibroblasts untreated (NT, not transduced), scrambled-transduced (Scr) and transduced with different Endog-specific silencing constructs (shRNA1 and 2) and D) in human HEK293 control cells and ENDOG-deficient clones using CRISPR-Cas9 technology to truncate ENDOG at two different regions (sgRNA1.1, sgRNA4.3; see Materials and Methods section for details). E) The effect of ROS scavenger N-Acetyl-l-Cysteine (NAC) on signaling proteins involved in cell cycle regulation was analyzed on protein extracts of ENDOG-deficient HEK293 clone sgRNA1.1 cells untreated or treated with 0.5 mM NAC for 12 and 24 h. Densitometry analysis of blots was performed and expression of key regulatory genes was referred to the values of untreated cells at time 0 in the graphs on the right. The Kruskal-Wallis test was performed followed by Dunn's test to compare control and NAC-treated values for each time point. Blots are representative of 3–5 independent experiments. NB: Naphthol blue staining of the membranes. (For interpretation of the references to colour in this figure legend, the reader is referred to the Web version of this article.)
Fig. 5
Fig. 5
Analysis of the effects of EndoG deficiency in the expression of ROS metabolizing enzymes and METC complexes, cellular respiration and CoQ redox status. A) Expression of Catalase and Mn-Superoxide Dismutase in Endog+/+ and Endog−/− skin fibroblasts. B) Expression of electron transport chain subunits I to IV and ATP-synthase (CV) in Endog+/+ and Endog−/− skin fibroblasts (NB: Naphthol Blue). C) Oxygen consumption rate (OCR) of Endog+/+ (blue) and Endog−/− (red) cultures in the presence of Oligomycin (ATP-synthase inhibitor), FCCP (METC-ATP synthase uncoupler), or Antimycin-A (Coenzyme-Q: Cytochrome-c Oxidoreductase, CIII, inhibitor). Data represent mean ± SD of 8 independent experiments comparing 2 Endog+/+ and 2 Endog−/− primary neonatal skin fibroblast cultures. D) ATP-linked respiration, reserve capacity and oxygen leak were measured in cultures of Endog+/+ (blue) and Endog−/− (red) skin fibroblast cultures from data presented in (C) following the methods described in the Materials and Methods section; individual experimental values are shown plus mean ± SD. E) Total coenzyme Q (CoQ9) and CoQ redox state (ratio of reduced CoQ vs. total CoQ) in Endog+/+ (blue) and Endog−/− (red) skin fibroblast cultures. Nine individual experimental measures are shown plus mean ± SD. Student's t-test did not find significant effects of Endog expression on the experimental values. (For interpretation of the references to colour in this figure legend, the reader is referred to the Web version of this article.)
Fig. 6
Fig. 6
Effects of Humanin addition on the effects caused by EndoG deficiency in cell proliferation, ROS production and signal transduction. A) Equal number of Endog+/+ and Endog−/− mouse-derived skin fibroblasts were seeded. At time zero, cell number in replicate plaques was counted. DMSO (Control) or 100 nM Humanin (HN) diluted in DMSO were added in duplicate plates/treatment and cells were counted after 48 h. Data are expressed as the number of cell cycles completed in 48 h. All values from 5 independent experiments in duplicates are plotted. B) MitoSOX™ fluorescence was quantified by flow cytometry in preparations of the same experimental groups as in (A). Eight experiments for controls and four experiments for HN treatment in duplicates are plotted. C) Western Blot of pAkt, total Akt and EndoG was performed with cultures of primary skin fibroblasts of 6 Endog+/+ and 6 Endog−/− adult mice (NB: Naphthol blue staining of the membrane). After densitometric quantification of pAkt and Akt Western Blot bands, the ratio was calculated for each sample and plotted in the graph at right. Data in all the graphs represent individual values, mean ± SD (Endog+/+, blue dots; Endog−/−, red dots). Two-way ANOVA was used to analyze the influence of Endog expression and Humanin treatment and the interaction between them in cell proliferation, ROS production and Akt phosphorylation. Ns: not significant; *, p < 0.05; **, p < 0.01; ***, p < 0.001; ****, p < 0.0001. (For interpretation of the references to colour in this figure legend, the reader is referred to the Web version of this article.)
Fig. 7
Fig. 7
Analysis of mitochondrial DNA nucleoid morphology and expression of Interferon pathway's markers in EndoG deficient cells, and assessment of the role of Romo1 expression and function in cell proliferation and ROS production. A) Double strand DNA (nucleoids, green) and mitochondria (TOM20 staining, red) were imaged as described in the Materials and Methods section in primary cultures of skin fibroblast obtained from Endog+/+ and Endog−/− mice. Representative composite images of a single cell for each genotype are presented in the panels (insets are a magnification of the picture for detail). Nucleoid area, area group distribution and colocalization with mitochondria (Mander's coefficient) for Endog+/+ (blue) and Endog−/− (red) measured and calculated from 42 dermal fibroblasts per genotype from 6 independent animals are shown in the graphs plus mean ± SD. B) Expression of interferon pathway markers Irf7 and Isg15 was quantified in total RNA extracts obtained from cultured skin fibroblast of Endog+/+ (blue) and Endog−/− (red) mice. N = 6, dots are individual measurements performed in duplicate and corrected by Gapdh expression, median with interquartile range is indicated. Mann-Whitney U test was performed. C) Irf7 and Isg15 mRNA expression was quantified also in several tissues of Endog+/+ (blue) and Endog−/− (red) mice (N = 3/genotype). H: Heart, B: Brain, K: Kidney, L: Lung, S: Spleen, Li: Liver, M: Skeletal muscle. Bars represent min to max. values plus median of data referred to Heart. D) Romo1 mRNA expression was quantified in the same samples as in C. Bars represent min to max. values plus median of data referred to Heart. In C) and D) the Kruskal-Wallis test followed by Dunn's post hoc test was performed showing no influence of Endog expression in the expression of Irf7, Isg15 and Romo1. E) Endog+/+ and Endog−/− mouse-derived skin fibroblasts transduced with a scrambled shRNA or a mixture of 2 independent Romo1-specific shRNA and equal amounts of cells were seeded. At time zero, cell number in replicate plaques was counted to confirm equal cell number and the rest of plates were counted after 72 h. Data are expressed as the number of cell cycles completed in 72 h. All values from 5 independent experiments are plotted. F) MitoSOX™ fluorescence was quantified by flow cytometry in preparations of the same experimental groups as in (E). All values from six experiments are plotted. In E and F mean ± SD are also indicated. Two-way ANOVA was used to analyze the influence of Endog and Romo1 expression and the interaction between them in cell proliferation and ROS abundance. Ns: not significant; ***, p < 0.001; ****, p < 0.0001. (For interpretation of the references to colour in this figure legend, the reader is referred to the Web version of this article.)

References

    1. Lee I.H., Finkel T. Metabolic regulation of the cell cycle. Curr. Opin. Cell Biol. 2013;25:724–729. doi: 10.1016/j.ceb.2013.07.002. - DOI - PMC - PubMed
    1. Miettinen T.P., Pessa H.K., Caldez M.J., Fuhrer T., Diril M.K., Sauer U., Kaldis P., Björklund M. Identification of transcriptional and metabolic programs related to mammalian cell size. Curr. Biol. 2014;24:598–608. doi: 10.1016/j.cub.2014.01.071. - DOI - PMC - PubMed
    1. Sakamaki T., Casimiro M.C., Ju X., Quong A.A., Katiyar S., Liu M., Jiao X., Li A., Zhang X., Lu Y., Wang C., Byers S., Nicholson R., Link T., Shemluck M., Yang J., Fricke S.T., Novikoff P.M., Papanikolaou A., Arnold A., Albanese C., Pestell R. Cyclin D1 determines mitochondrial function in vivo. Mol. Cell Biol. 2006;26:5449–5469. doi: 10.1128/MCB.02074-05. - DOI - PMC - PubMed
    1. Wang Z., Fan M., Candas D., Zhang T.Q., Qin L., Eldridge A., Wachsmann-Hogiu S., Ahmed K.M., Chromy B.A., Nantajit D., Duru N., He F., Chen M., Finkel T., Weinstein L.S., Li J.J. Cyclin B1/Cdk1 coordinates mitochondrial respiration for cell-cycle G2/M progression. Dev. Cell. 2014;29:217–232. doi: 10.1016/j.devcel.2014.03.012. - DOI - PMC - PubMed
    1. Owusu-Ansah E., Yavari A., Mandal S., Banerjee U. Distinct mitochondrial retrograde signals control the G1-S cell cycle checkpoint. Nat. Genet. 2008;40:356–361. doi: 10.1038/ng.2007.50. - DOI - PubMed

Publication types