. 2020 Nov:66:102454.
doi: 10.1016/j.healthplace.2020.102454. Epub 2020 Oct 5.

Combining social network and activity space data for health research: tools and methods

Affiliations

Combining social network and activity space data for health research: tools and methods

Naud Alexandre et al. Health Place. 2020 Nov.

Abstract

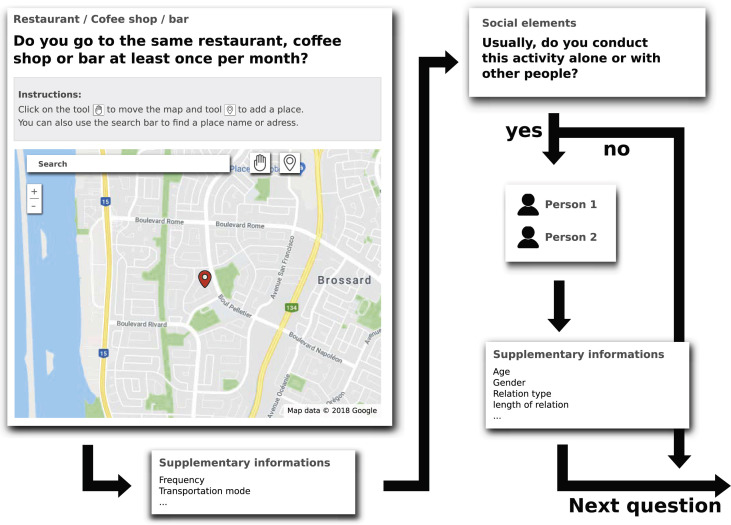
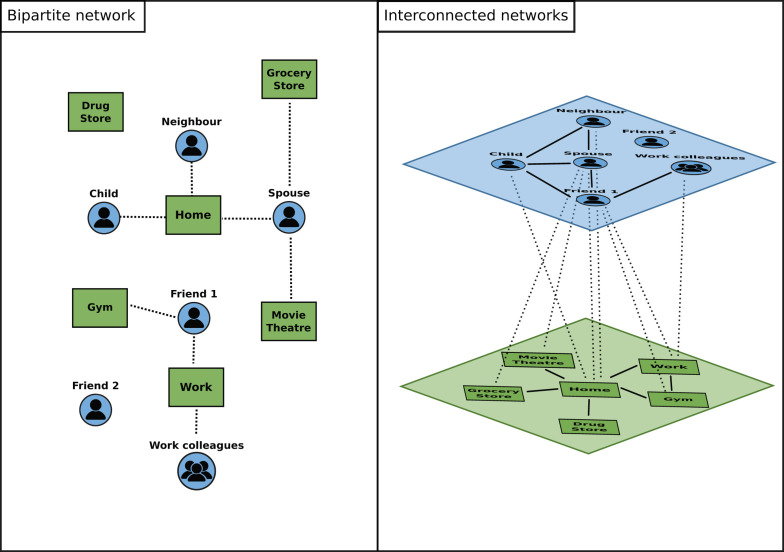
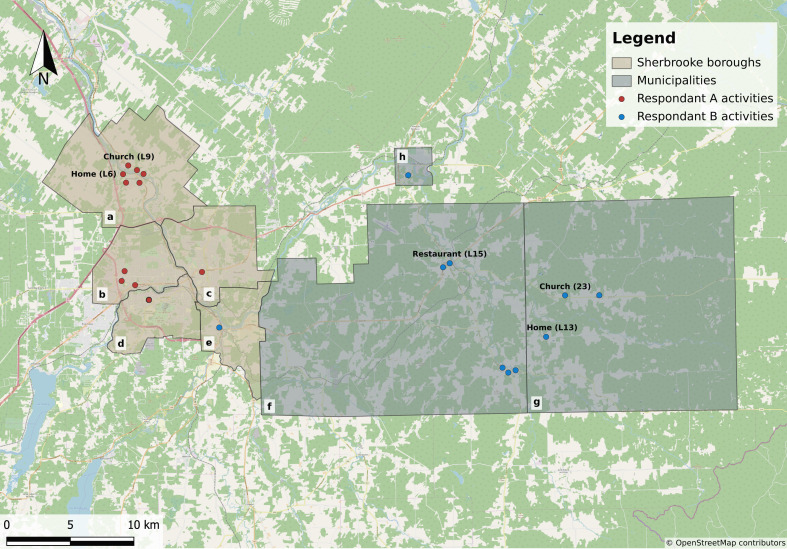
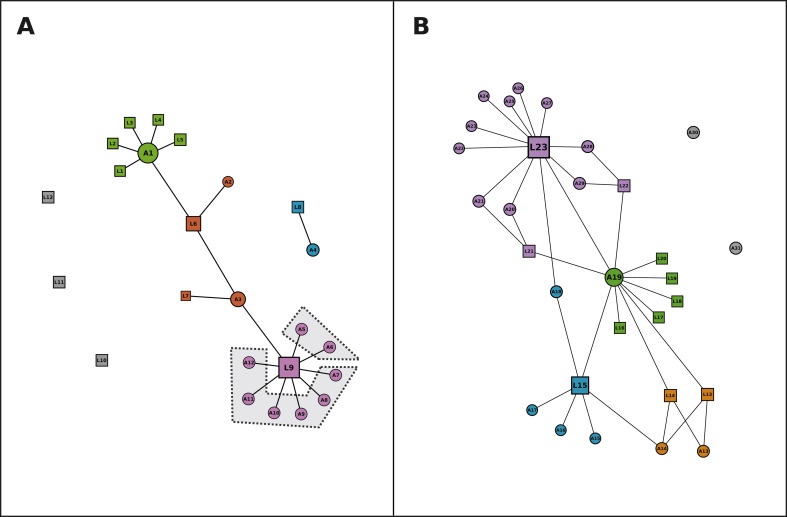
Contextual factors influencing population health have received substantial attention, especially with regard to people's social networks and the roles of built environments in their activity spaces. Yet little health research has considered spatial and social contexts simultaneously, often because of a lack of existing data. This paper presents a tool for collecting relational data on social network and activity space that extends an existing map-based questionnaire with the addition of a name generator. We then illustrate how network analysis provides a useful framework for studying connections between social and spatial contexts using data collected in the Contrasted Urban settings for Healthy Aging research project.


Conflict of interest statement

YK holds shares in Polygon Research Inc., the company that markets the VERITAS application. All other authors declare that they have no competing interests.

Figures

Fig. 1
Fig. 1
Diagram of the questionnaire flow chart. The left side represents the original VERITAS interface where the respondent can report and comment on the location of the activities. The right side represents the name generator used to assess the respondent's social network based on geolocalized activities.
Fig. 2
Fig. 2
Hypothetical examples of a bipartite network and a system of interconnected networks modelling the relationships between social networks and activity spaces. Alters are represented by blue circles. Individuals and groups are distinguished by the number of people represented in the circle. Places are represented by green rectangles. In bipartite networks, socio-spatial relationships are represented as dotted lines. These relations identify who is seen in which location. It shows, for example, that Child is only seen at Home, while Friend 1 is seen both at the Gym and at Work. It also shows that the Pharmacy is disconnected from the rest of the network, which means that the respondent does not see anyone from her network at that location. In interconnected networks, the relationships between people and visited locations are added: the social network (blue circles) is connected to the spatial network (green polygons) by who is seen at a given location (dotted lines). The edges between alters represent “who knows whom.” For example, Neighbour knows Child and Spouse. In comparison, Friend 2 is not connected, meaning he does not know any other alter. The edges between locations could represent different relationships (e.g. distance), but these are not defined by the respondent in VERITAS-Social. The respondent is not represented in either the bipartite or interconnected network, knowing that by definition, she is connected both to all people (she knows everyone in her network) and to all locations (she visits all locations). The length of the lines is not informative in these examples. (For interpretation of the references to colour in this figure legend, the reader is referred to the Web version of this article.)
Fig. 3
Fig. 3
Spatial distribution of participants A and B visited locations. The polygons represent Sherbrooke boroughs (a = Brompton–Rock Forest–Saint-Élie–Deauville, b = Jacques-Cartier, c = Fleurimont, d = Mont-Bellevue, e = Lennoxville) and Quebec municipalities (f = Cookshire-Eaton, g = Newport, h = East Angus). The primary residence has been removed and geographical coordinates of displayed locations have been randomly modified by a factor of 0.02 to ensure confidentiality. Overlapping locations were moved further apart manually to improve visualization. The different areas contain the following locations: (a contains L6 to L12), (b contains L2, L4, and L5), (c contains L3), (d contains L1), (e contains L17), (f contains L18, L20, L21, L22 and L25), (g contains L16, L23 and L24), (h contains L19). The map is projected in WGS 84/Pseudo-Mercator at 1:325 000 scale. Basemap layer is from the OpenStreetMap database (OpenStreetMap Contributors, 2012).
Fig. 4
Fig. 4
Visual representation of participants A and B's bipartite networks. Locations (Lx) are represented as squares and alters (Ax) as circles. Light grey polygons surround alters generated from groups. Edges represent “with whom activities are conducted.” For example, participant A sees three alters (i.e. A1 to A3) in location L6. The colours of the nodes represent the communities to which they belong. The size of the nodes is proportional to their within-module degree. A default minimal size was attributed to unconnected nodes, although their within-module degree is undefined. Node sizes therefore emphasize their connectivity with their own community. For example, L9 is the most connected node in its community, and therefore the largest. The position of each node in a two-dimensional space was calculated with the Force Atlas layout algorithm. Both the length and width of the edges are derived from the layout algorithm and do not represent any attribute. (For interpretation of the references to colour in this figure legend, the reader is referred to the Web version of this article.)

References

    1. Adams J., Faust K., Lovasi G.S. Capturing context: integrating spatial and social network analyses. Soc. Netw. 2012;34 doi: 10.1016/j.socnet.2011.10.007. - DOI
    1. Ahas R., Silm S., Saluveer E., Järv O. Modelling Home and Work Locations of Populations Using Passive Mobile Positioning Data. In: Gartner G., Rehl K., editors. Location Based Services and TeleCartography II, Lecture Notes in Geoinformation and Cartography. Springer; Berlin, Heidelberg: 2009. pp. 301–315.
    1. Andris C. Integrating social network data into GISystems. Int. J. Geogr. Inf. Sci. 2016;30:2009–2031. doi: 10.1080/13658816.2016.1153103. - DOI
    1. Axhausen K.W. Social networks, mobility biographies, and travel: survey challenges. Environ. Plann. Plann. Des. 2008;35:981–996. doi: 10.1068/b3316t. - DOI
    1. Barabasi A.L., Jeong H., Neda Z., Ravasz E., Schubert A., Vicsek T. Evolution of the social network of scientific collaborations. Phys. Stat. Mech. Its Appl. 2002;311:590–614. doi: 10.1016/S0378-4371(02)00736-7. - DOI

Publication types

LinkOut - more resources