

Predicting Coronavirus Disease 2019 Infection Risk and Related Risk Drivers in Nursing Homes: A Machine Learning Approach
- PMID: 33032935
- PMCID: PMC7451194
- DOI: 10.1016/j.jamda.2020.08.030
Predicting Coronavirus Disease 2019 Infection Risk and Related Risk Drivers in Nursing Homes: A Machine Learning Approach
Abstract
Objective: Inform coronavirus disease 2019 (COVID-19) infection prevention measures by identifying and assessing risk and possible vectors of infection in nursing homes (NHs) using a machine-learning approach.
Design: This retrospective cohort study used a gradient boosting algorithm to evaluate risk of COVID-19 infection (ie, presence of at least 1 confirmed COVID-19 resident) in NHs.
Setting and participants: The model was trained on outcomes from 1146 NHs in Massachusetts, Georgia, and New Jersey, reporting COVID-19 case data on April 20, 2020. Risk indices generated from the model using data from May 4 were prospectively validated against outcomes reported on May 11 from 1021 NHs in California.
Methods: Model features, pertaining to facility and community characteristics, were obtained from a self-constructed dataset based on multiple public and private sources. The model was assessed via out-of-sample area under the receiver operating characteristic curve (AUC), sensitivity, and specificity in the training (via 10-fold cross-validation) and validation datasets.
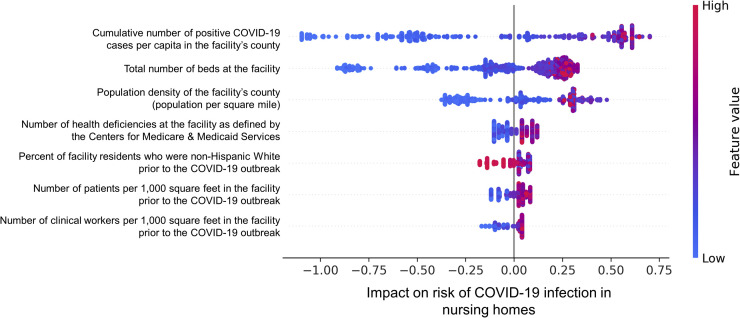
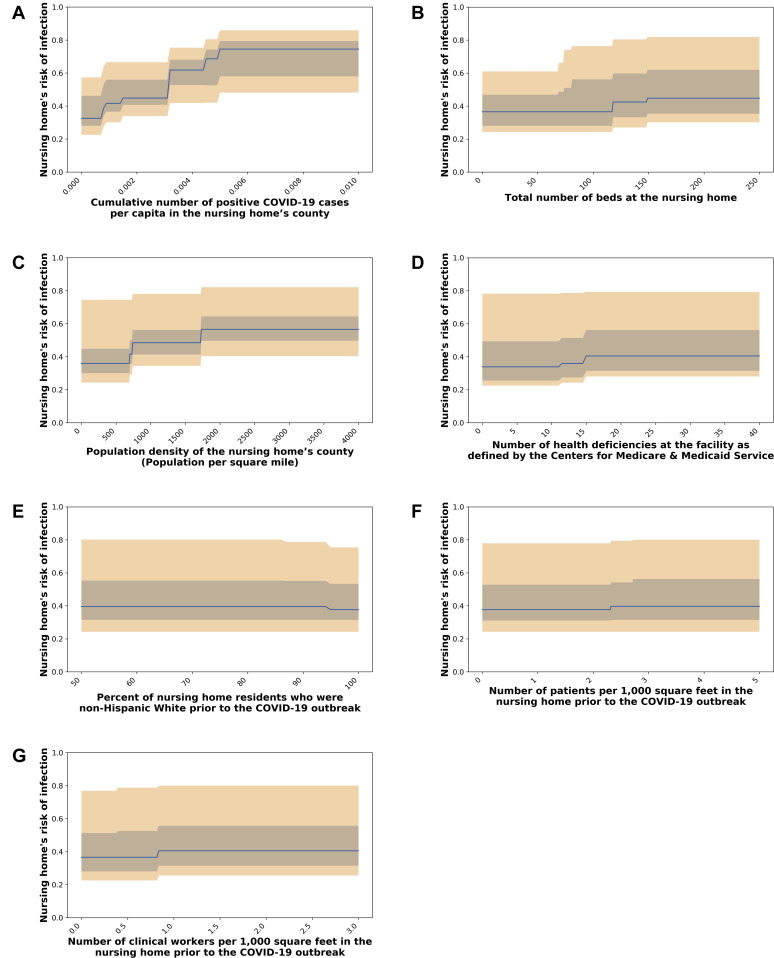
Results: The mean AUC, sensitivity, and specificity of the model over 10-fold cross-validation were 0.729 [95% confidence interval (CI) 0.690‒0.767], 0.670 (95% CI 0.477‒0.862), and 0.611 (95% CI 0.412‒0.809), respectively. Prospective out-of-sample validation yielded similar performance measures (AUC 0.721; sensitivity 0.622; specificity 0.713). The strongest predictors of COVID-19 infection were identified as the NH's county's infection rate and the number of separate units in the NH; other predictors included the county's population density, historical Centers of Medicare and Medicaid Services cited health deficiencies, and the NH's resident density (in persons per 1000 square feet). In addition, the NH's historical percentage of non-Hispanic white residents was identified as a protective factor.
Conclusions and implications: A machine-learning model can help quantify and predict NH infection risk. The identified risk factors support the early identification and management of presymptomatic and asymptomatic individuals (eg, staff) entering the NH from the surrounding community and the development of financially sustainable staff testing initiatives in preventing COVID-19 infection.
Keywords: COVID-19; Nursing homes; health policy; infection prevention; long-term care facility; machine-learning; risk modeling.
Copyright © 2020 AMDA – The Society for Post-Acute and Long-Term Care Medicine. Published by Elsevier Inc. All rights reserved.
Figures
References
-
- One-Third of All U.S. Coronavirus Deaths Are Nursing Home Residents or Workers. https://www.nytimes.com/interactive/2020/05/09/us/coronavirus-cases-nurs... Available at:
-
- Barnett M.L., Grabowski D.C. Nursing homes are ground zero for COVID-19 pandemic. JAMA Health Forum. 2020;1:e200369. - PubMed
-
- Grabowski D.C., Mor V. Nursing home care in crisis in the wake of COVID-19. JAMA. 2020;324:23–24. - PubMed
MeSH terms
LinkOut - more resources
Full Text Sources
Medical
Miscellaneous
