. 2021 Jan;19(1):136-149.
doi: 10.1158/1541-7786.MCR-20-0554. Epub 2020 Oct 8.

Extracellular Matrix-Bound FGF2 Mediates Estrogen Receptor Signaling and Therapeutic Response in Breast Cancer

Affiliations

Extracellular Matrix-Bound FGF2 Mediates Estrogen Receptor Signaling and Therapeutic Response in Breast Cancer

Josh W DiGiacomo et al. Mol Cancer Res. 2021 Jan.

Abstract

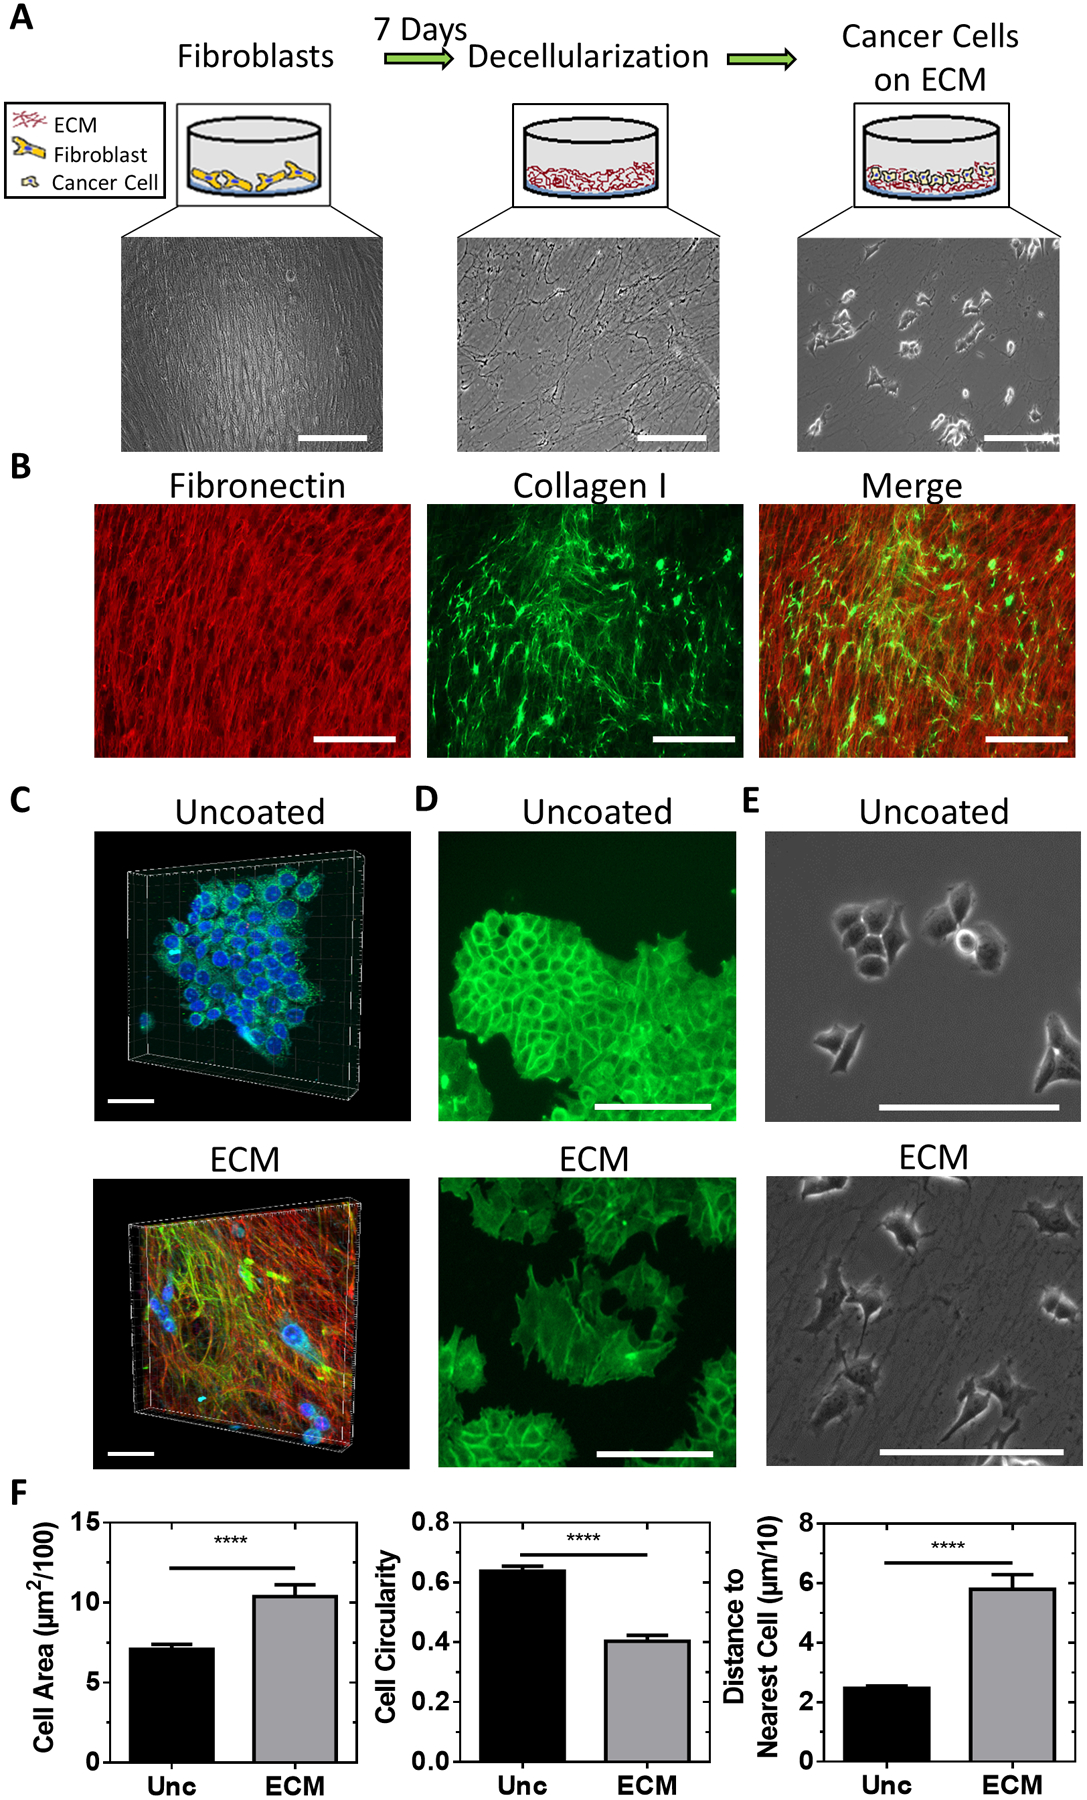
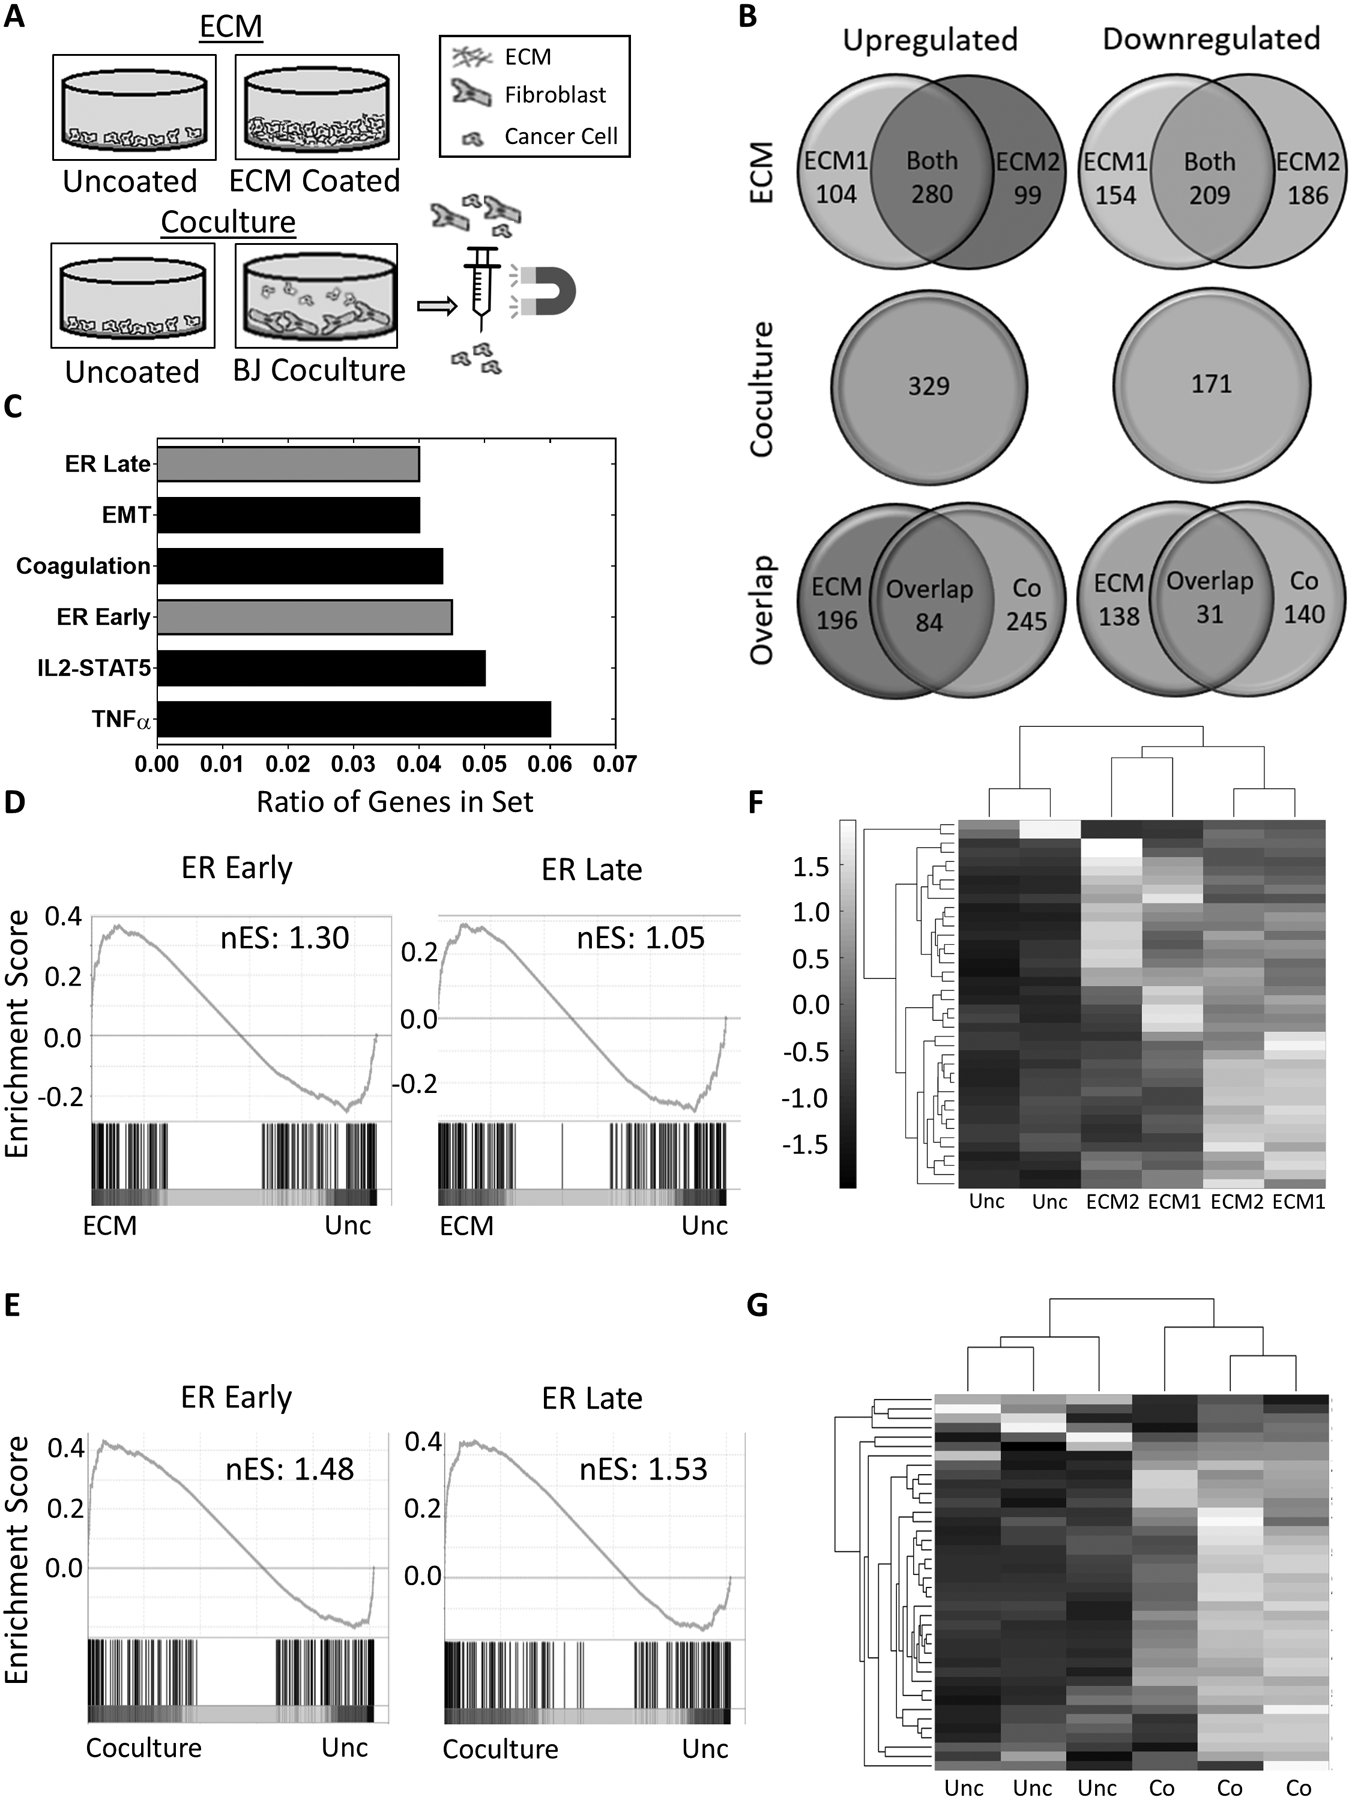
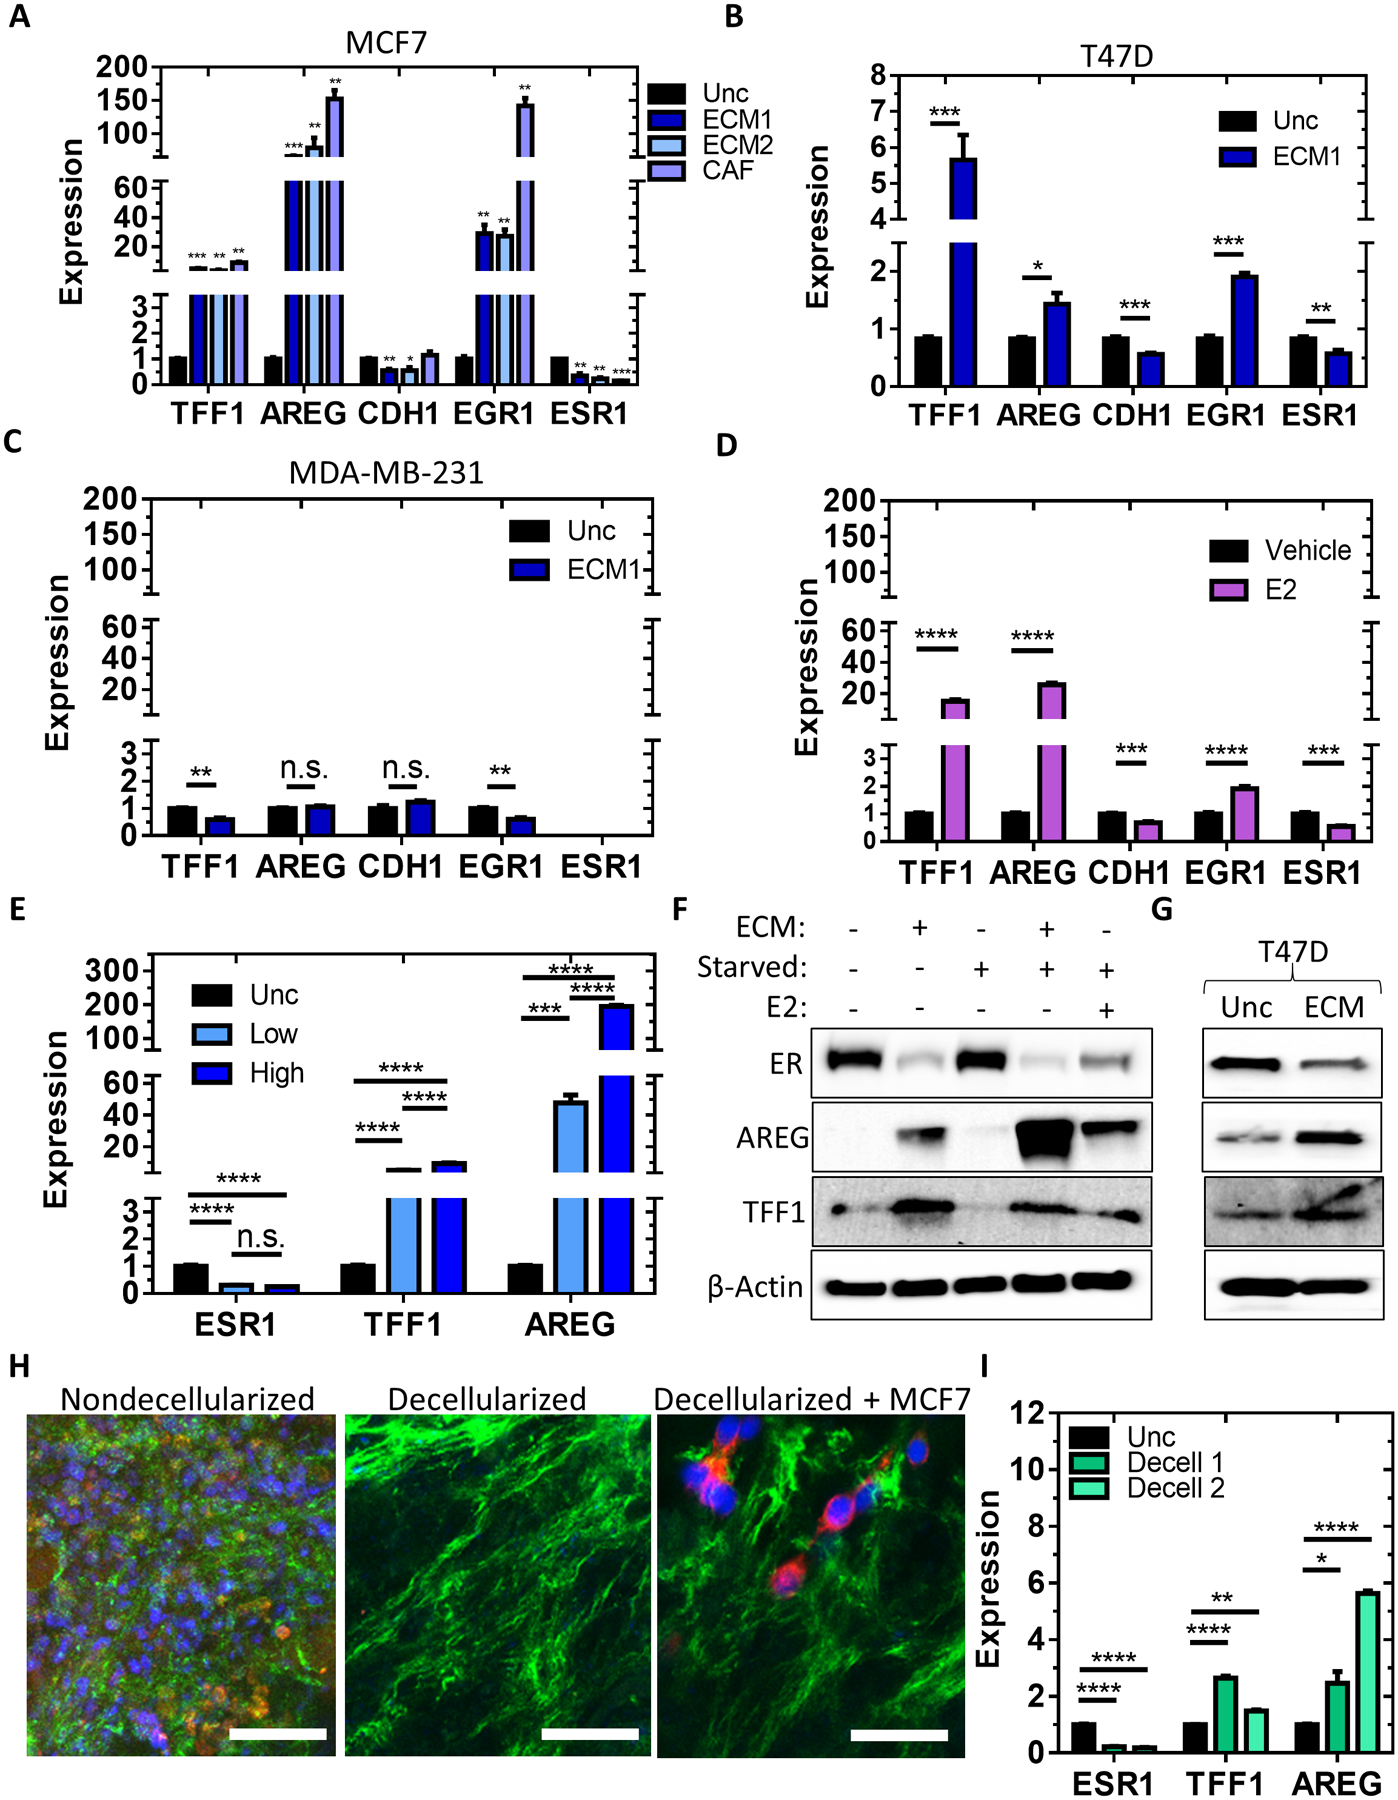
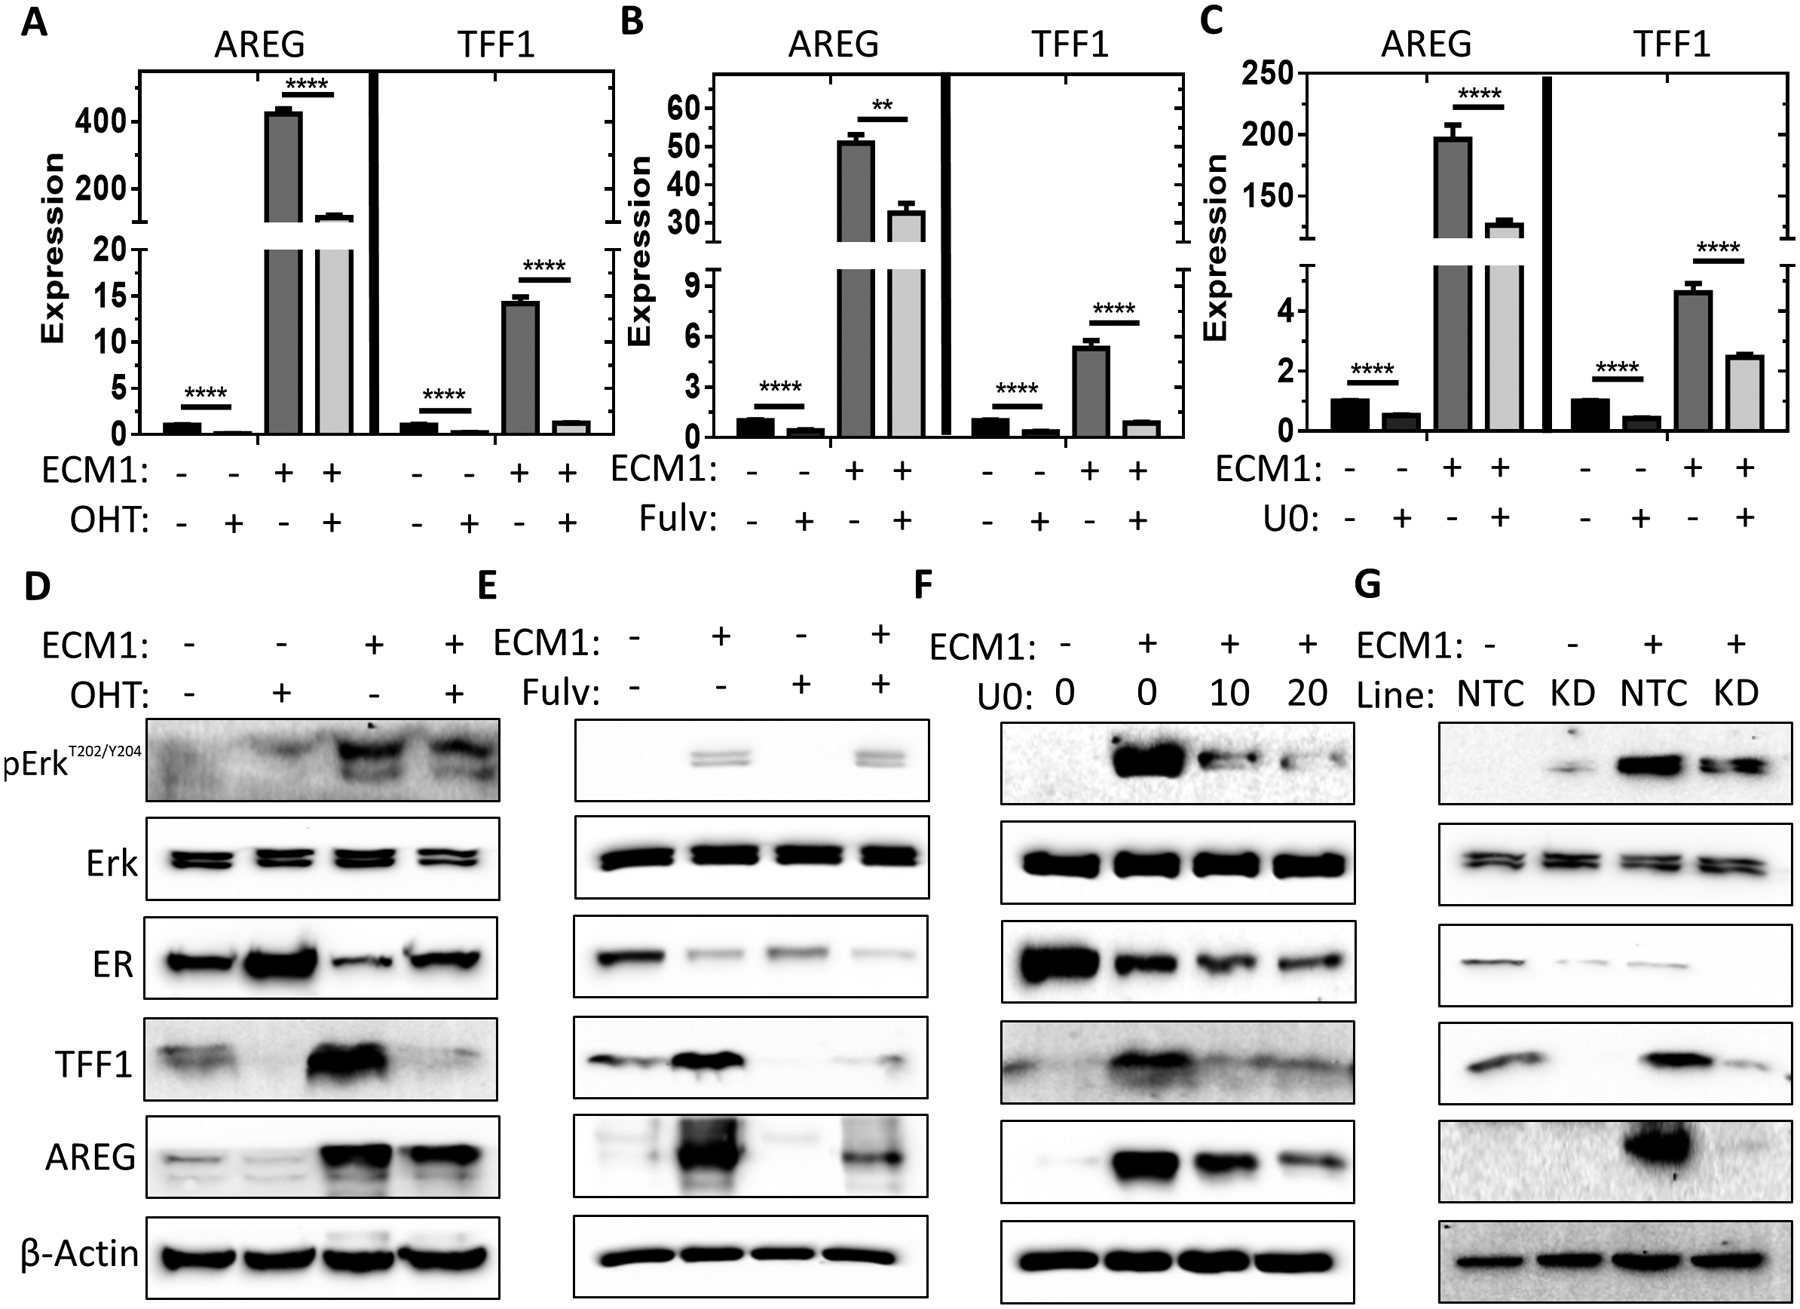
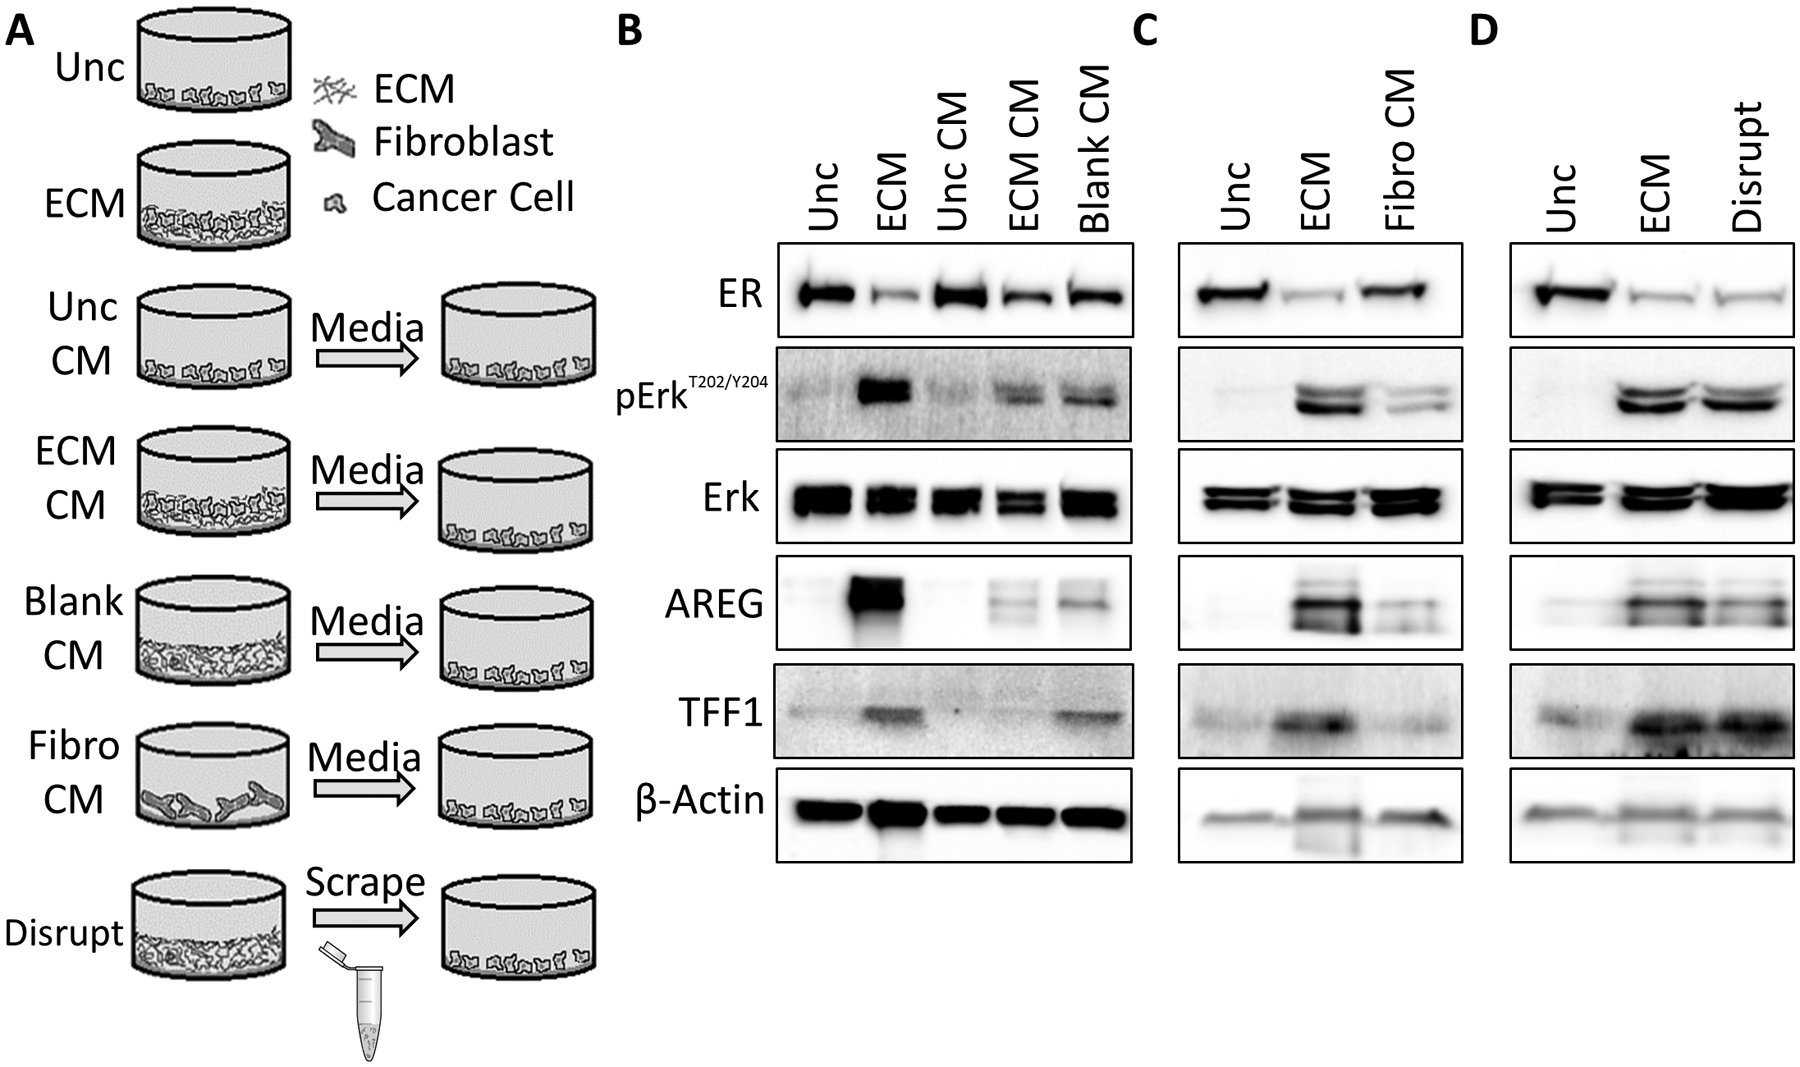
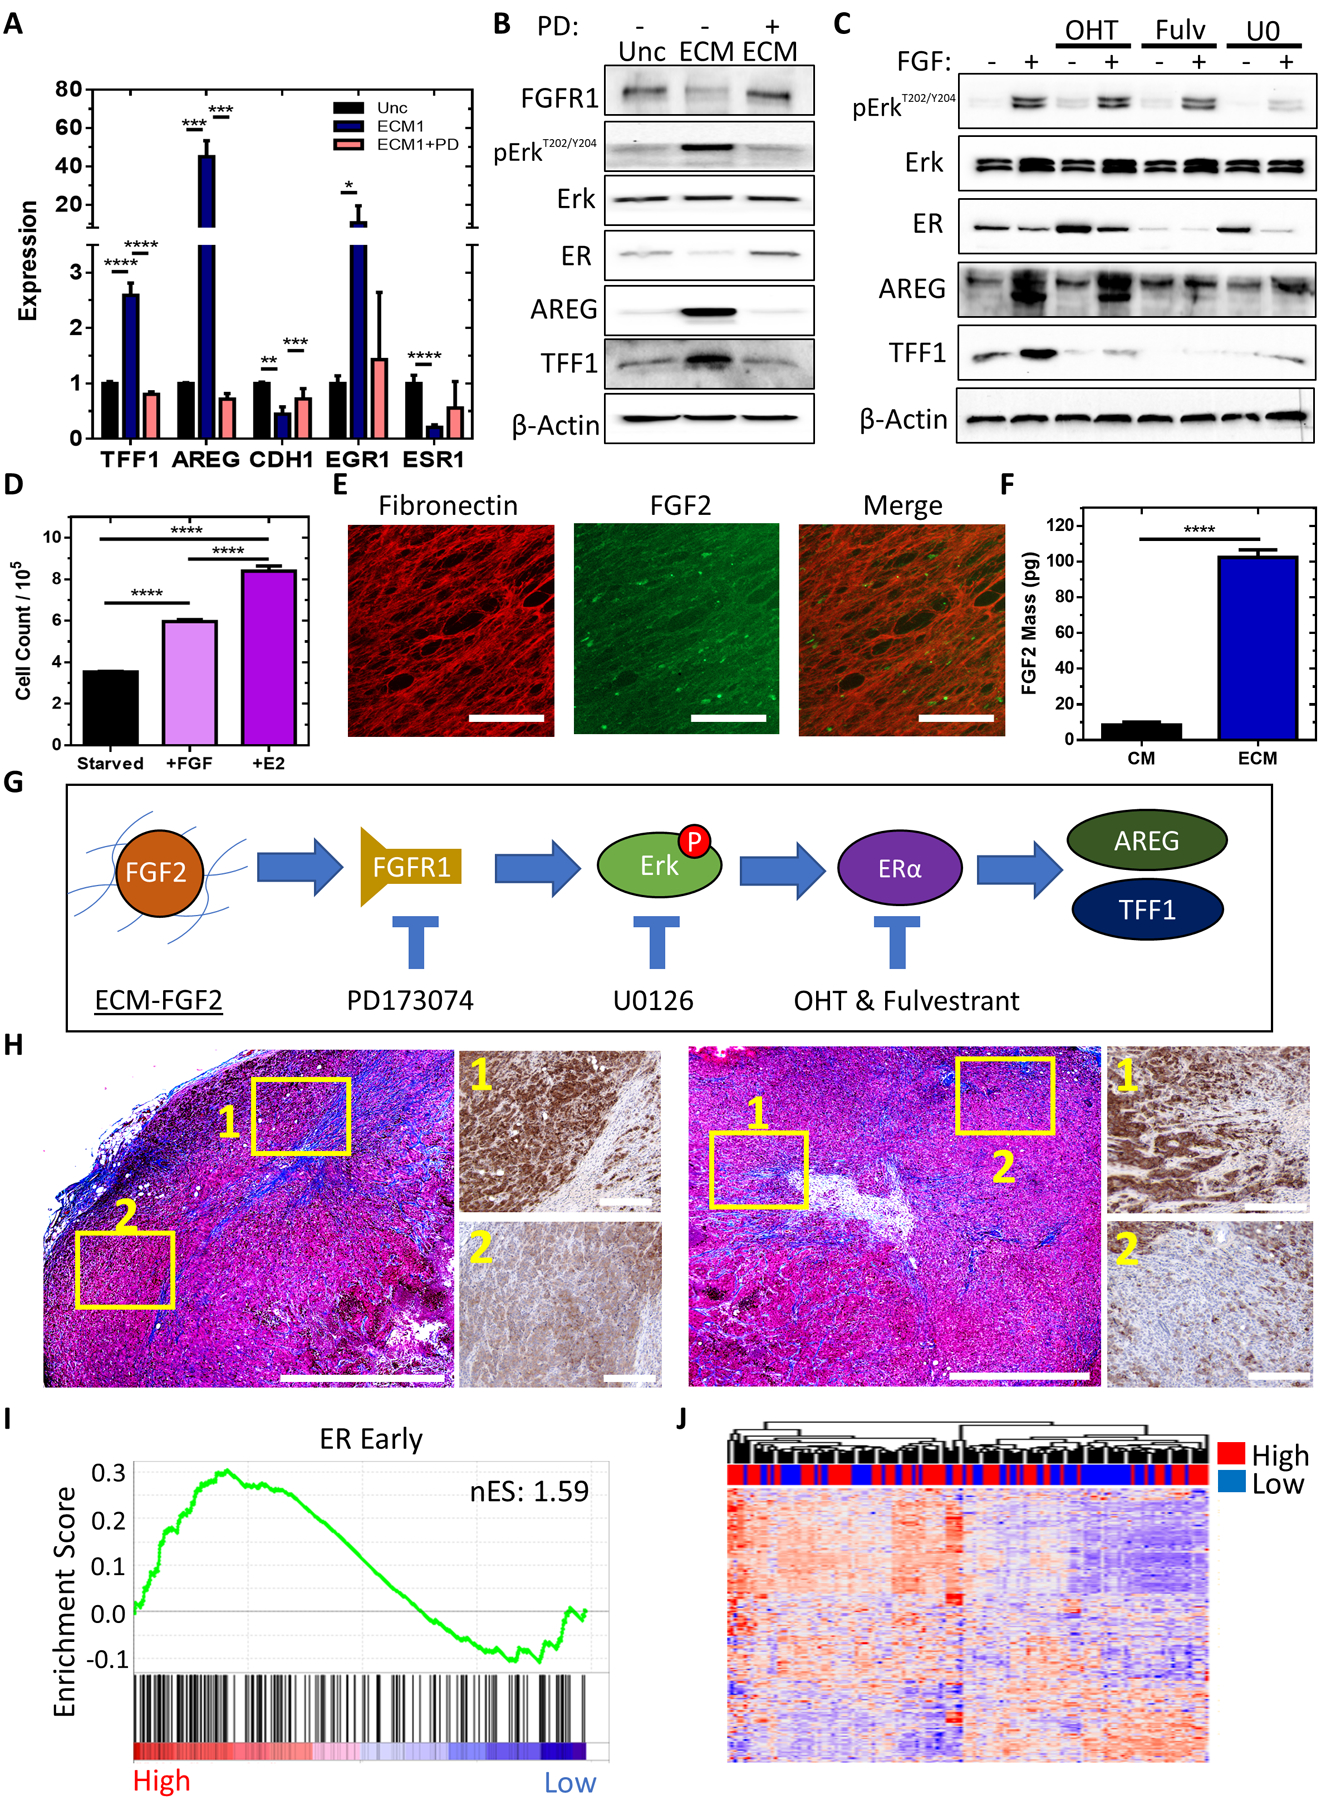
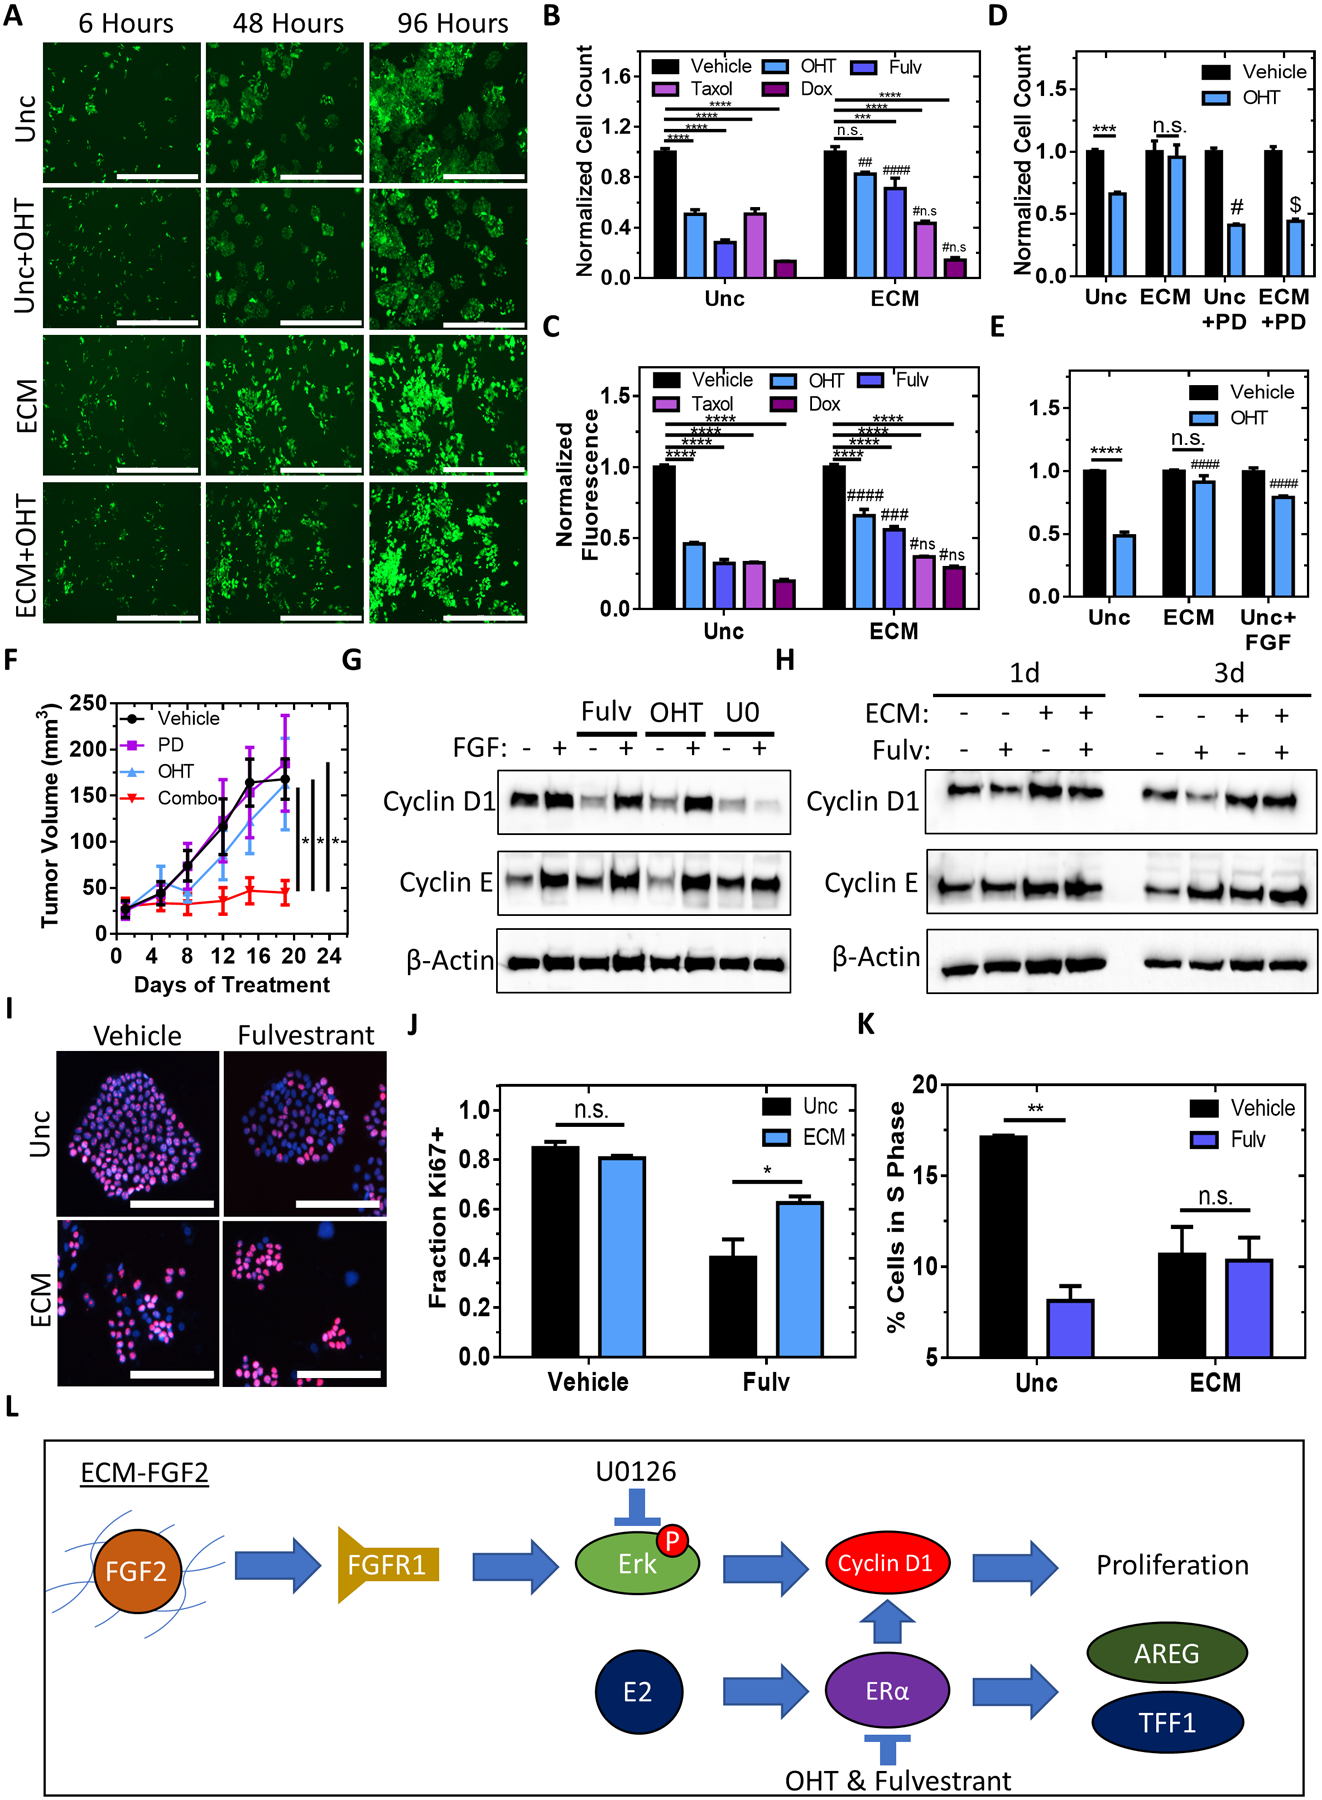
The extracellular matrix (ECM) is often unaccounted for in studies that consider the stromal contribution to cancer cell signaling and response to treatment. To investigate the influence of a fibrotic microenvironment, we use fibroblast-derived ECM scaffolds as a cell culture platform. We uncover that estrogen receptor-positive (ER+) breast cancer cells cultured within ECM-scaffolds have an increase in ER signaling that occurs via an MAPK-dependent, but estrogen-independent manner. The ECM acts as a reservoir by binding, enriching, and presenting growth factors to adjacent epithelial cells. We identified FGF2 as a specific ECM-bound factor that drives ER signaling. ER+ cells cultured on ECM matrices have reduced sensitivity to ER-targeted therapies. The sensitivity to ER-targeted therapy can be restored by inhibiting FGF2-FGFR1 binding. ECM-FGF2 complexes promote Cyclin D1 induction that prevents G1 arrest even in the presence of antiestrogens. This work demonstrates that the ECM can drive ER signaling and resistance to endocrine therapy, and suggests that patients with ER+ breast cancer that have high mammographic breast density may benefit from existing FGFR-targeted therapies. IMPLICATIONS: This work uncovers how the ECM may mediate signaling between growth factors and ER+ breast cancer cells to promote estrogen-independent ER signaling and resistance to endocrine therapy.


Conflict of interest statement

The authors declare no conflicts of interest.

Figures

Figure 1.
Figure 1.. Fibroblast-derived ECM scaffolds alter breast cancer cell morphology.
A, Schematic and phase contrast images of the fibroblast decellularization process. Scale bar = 200 μm. B, Immunofluorescent images of extracted ECM. Scale bar = 200 μm. C, 3D projection of MCF7 cells plated onto uncoated surfaces or ECM scaffolds and labeled with fibronectin (red) and collagen (green) antibodies. Scale bar = 40 μm. D, Immunofluorescent images of actin in MCF7 cells plated onto uncoated surfaces or ECM scaffolds Scale bar = 100 μm. E, Phase contrast image of MCF7 cells plated onto an uncoated surface or ECM scaffold. Scale bar = 200 μm. F, Cell area and circularity measurements and distance between MCF7 cells plated onto uncoated surfaces or ECM scaffolds. n = 55 cells (unc) and 65 cells (ECM) from three different image regions. Unpaired t-test, **** P< 0.0001.
Figure 2.
Figure 2.. ECM matrices induce estrogen signaling pathways in breast cancer cells.
A, Schematic of the mRNA sequencing experiments. MCF7 cells were cultured in two setups: MCF7 cells cultured 1) on uncoated surfaces or ECM from BJ (ECM1) or IMR90 (ECM2) fibroblasts and 2) alone or in coculture with BJ fibroblasts before isolation by magnetically activated cell sorting. B, Venn Diagram of genes significantly (p<0.05) upregulated (left side) or downregulated (right side) by at least 2-fold in MCF7 cells cultured in either ECM scaffolds derived from BJ (ECM1) or IMR90 (ECM2) fibroblasts, or in BJ fibroblast coculture (Co) compared to cells on uncoated surfaces. C, Hallmark gene sets with highest ratios of genes (k/K) overlapping with the 84 upregulated genes shared between the ECM and coculture sets. D and E, Gene set enrichment analysis (GSEA) of Hallmark Late or Early estrogen response gene sets using mRNA sequencing data of MCF7 cells plated on ECM (D) or cocultured with BJ fibroblasts (E) with nominal enrichment score (nES). Nominal p-value <0.02 for Early (D) and <0.01 for Early (E) and Late (E). F and G, Clustergram of the gene expression of 40 ER-regulated genes in MCF7 cells from the ECM set (F) or the coculture set (G). Data is standardized by each row to a mean of zero and a standard deviation of 1. A list of the genes corresponding to each row can be found in Supplementary Table 3.
Figure 3.
Figure 3.. ECM signaling activates estrogen-responsive genes in an estrogen-independent manner.
A-C, qPCR results for the quantification of mRNA expression of TFF1, AREG, CDH1, EGR1, and ESR1 in MCF7 (A), T47D (B), or MDA-MB-231 (C) cells plated onto uncoated surfaces or ECM scaffolds derived from BJ fibroblasts (ECM1), IMR90 fibroblasts (ECM2), or cancer-associated fibroblasts (CAF). n = 3–6 from N = 1–2 independent experiments. Unpaired t-test against uncoated. *** P<0.001, ** P<0.01, * P<0.05. D, qPCR results for the quantification of mRNA expression of TFF1, AREG, CDH1, EGR1, and ESR1 in MCF7 cells plated on uncoated surfaces and treated with vehicle or 10 nm of E2. n = 3. Unpaired t-test. **** P<0.0001. E, qPCR results for the quantification of mRNA expression of TFF1, AREG, and ESR1 in MCF7 cells plated onto uncoated surfaces or ECM scaffolds derived from BJ fibroblasts plated at 20,000 cells/cm2 (Low) or 60,000 cells/cm2 (High) for 24 hours. n = 3. One-way ANOVA with Bonferonni post-test for each gene. F, Immunoblot performed using protein lysates from MCF7 cells plated onto uncoated surfaces or ECM scaffolds with (+) or without (–) estrogen starvation or 100 nM E2 to detect ER, AREG, TFF1, and β-actin protein expression. G, Immunoblot performed using protein lysates from T47D cells plated onto uncoated surfaces or ECM scaffolds with complete culture media to detect ER, AREG, TFF1, and β-actin protein expression without estrogen starvation. H, Confocal of non-decellularized MCF7 xenograft tumor slices or regions of decellularized slices with or without MCF7 cells cultured in the slice. Slices were stained for actin (red), fibronectin (green), and DNA (blue). Scale bar = 50 μm. I, qPCR results for the quantification of mRNA expression of TFF1, AREG, and ESR1 in MCF7 cells plated onto uncoated surfaces or decellularized MCF7 xenograft tumor slices for 24 hours. n=3. One-way ANOVA within each gene.
Figure 4.
Figure 4.. Inhibition of ER or Erk phosphorylation prevents the ECM-mediated induction of AREG and TFF1.
A-C, qPCR results for the quantification of mRNA expression of AREG and TFF1 in MCF7 cells plated onto ECM scaffolds or uncoated surfaces and treated with either vehicle, 1 μM of OHT (A), 1 μM of fulvestrant (B), or 10 μM of U0126 (C) for 24 hours. n = 3–6 from N = 1–2 independent experiments. Two-way ANOVA of log-transformed fold change with Bonferonni post-test within each gene. **** P<0.0001, ** P<0.01. D-F, Immunoblot performed using protein lysates of MCF7 cells plated onto ECM scaffolds or uncoated surfaces and treated with vehicle or 1 μM OHT (D), 1 μM fulvestrant (fulv) (E), or 10–20 μM U0126 (F) for 24 hours to detect Erk, Erk phosphorylation, AREG, TFF1, β-actin, and ER protein expression. G, Immunoblot performed using protein lysates from a CRISPR-mediated ER knockdown or a non-target control (NTC) sequence MCF7 cells plated onto ECM scaffolds or on uncoated surfaces to detect Erk, Erk phosphorylation, AREG, TFF1, β-actin, and ER protein expression.
Figure 5.
Figure 5.. Estrogen-like signaling is activated by a component bound to ECM.
A, Schematic depicting experimental setup used for B-D. B-D, Immunoblots were performed using protein lysates from MCF7 cells plated onto ECM scaffolds (ECM) or uncoated surfaces with conditioned complete culture media from cancer cells (B), conditioned complete culture media from fibroblasts (C), or with disrupted decellularized ECM (D). Total Erk, phosphorylated Erk, AREG, TFF1, β-actin, and ER protein expression was detected.
Figure 6.
Figure 6.. ECM-FGF2 complexes promote estrogen-like signaling in ER+ breast cancer cells.
A, qPCR results for the quantification of mRNA expression of TFF1, AREG, CDH1, EGR1, and ESR1 in MCF7 cells plated onto uncoated surfaces or ECM scaffolds derived and treated with vehicle or 1 μM PD173074 for 24 hours. n = 6 from N = 2 independent experiments. One-way ANOVA with Bonferonni post-test of log-transformed fold change within each gene. **** P<0.0001, *** P<0.001, ** P<0.01, * P<0.05. B, Immunoblot performed using protein lysates from MCF7 cells cultured on uncoated surfaces or ECM and treated with vehicle or 1 μM PD173074 for 24 hours to detect Erk, Erk phosphorylation, AREG, TFF1, β-actin, FGFR1, and ER protein expression. C, Immunoblot performed using protein lysates from MCF7 cells treated with or without 40 ng/mL FGF-2 and with or without 1 μM of OHT, 1 μM of fulvestrant, or 30 μM of U0126 for 24 hours to detect Erk, Erk phosphorylation, AREG, TFF1, β-actin, and ER protein expression. D, Total cell count of MCF7 cells cultured in estrogen-deprived medium for 3 days then treated with 1 nM E2 or 40 ng/mL FGF-2 for 3 days. n = 3. One-way ANOVA with Bonferonni post-test. E, Immunofluorescent images of decellularized ECM labeled with fibronectin (red) or FGF2 (green) antibodies. Scale bar = 100 μm. F, ELISA data for the mass of FGF2 bound to ECM in a 96-wellplate versus the mass of soluble FGF2 in fibroblast-conditioned media (CM) of the fibroblasts that generated the ECM. n = 3 wells per condition. Unpaired t-test. G, Proposed mechanism. H, Masson’s trichrome stain and TFF1 immunohistochemistry stains of MCF7 xenograft tumors. Trichrome stain bars 1000 μm. IHC bars 200 μm. I, GSEA of the Hallmark estrogen response early set using extratumoral biopsies from 120 patients with breast cancer stratified by <25% mammographic breast density (MBD) (Low, N=56) or >=25% MBD (High, N=64) with nES. Nominal p-value <0.01. J,Heatmap of expression of the Hallmark estrogen response early gene set in extratumoral regions of 120 patients with breast cancer annotated by low or high MBD. Complete clustergram provided in Supplementary Figure 6.
Figure 7.
Figure 7.. ECM signaling reduces anti-estrogen sensitivity of ER+ breast cancer cells via G1 arrest prevention.
A, Representative time-lapse images of GFP-expressing MCF7 cells plated onto uncoated surfaces or ECM scaffolds with or without 1 μM OHT for 96 hours. Scale bar = 1000 μm. B, Normalized cell count of MCF7 cells treated for 4 days with 1 μM OHT, 1 μM fulvestrant, 100 nM doxorubicin, or 3 days with 5 nM taxol on uncoated surfaces or ECM scaffolds. n = 3–6 per condition from N = 1–2 independent experiments. Two-way ANOVA with Bonferonni post-test. **** P<0.0001, *** P<0.001, #### P<0.0001 compared to the same treatment with uncoated, ## P<0.01 compared to the same treatment with uncoated, #n.s. P >0.05 compared to the same treatment with uncoated. C, Normalized fluorescence of viability reagent after exposure to MCF7 cells plated on uncoated surfaces or ECM scaffolds treated for 4 days with 1 μM OHT, 1 μM fulvestrant, 2.5 nM taxol, or 100 nM doxorubicin. n=3–6. Two-way ANOVA with Bonferonni post-test. ### P <0.001 compared to the same treatment with uncoated. D and E, Normalized cell counts of MCF7 cells treated for 4 days with vehicle, 1 μM OHT, 1 μM OHT and 40 ng/mL FGF (D), or 1 μM OHT and 1 μM PD173074 (E) on uncoated surfaces or ECM scaffolds. n = 6 from N = 2 independent experiments. Two-way ANOVA with Bonferonni post-test, # P<0.05 compared to the same treatment with uncoated, $ P<0.0001 compared to the same treatment with ECM. F, Measurements of tumor volume of mice inoculated with MCF7 cells and treated with vehicle, PD173074, OHT, or a combination of both. n = 4–5 mice per condition. One-way ANOVA. * P<0.05. G, Immunoblot performed using protein lysates from MCF7 cells treated with or without 40 ng/mL FGF-2 and treated with 1 μM of OHT, 1 μM of fulvestrant, or 30 μM of U0126 for 72 hours to detect Cyclin D1, Cyclin E, and β-actin protein expression. H, Immunoblot performed using protein lysates from MCF7 cells cultured on uncoated surfaces or ECM scaffolds and treated with or without 1 μM of fulvestrant for 24 or 72 hours to detect Cyclin D1, Cyclin E, and β-actin protein expression. I, Representative images of Ki67- and DAPI-stained MCF7 cells plated onto uncoated surfaces or ECM scaffolds with or without 1 μM fulvestrant for 96 hours. Scale bar = 200 μm. J, Fraction of MCF7 cells positive for Ki67 on ECM scaffolds or uncoated surfaces after treatment with or without 1 μM fulvestrant for 96 hours. n = 2–3 wells per condition with total cell counts ranging from 905–6888 cells. Two-way ANOVA with Bonferonni post-test. K, Percentage of cells in S-phase after cell cycle analysis using propidium iodide staining of MCF7 cells on uncoated surfaces or ECM-scaffolds treated with or without 1 μM fulvestrant for 48 hours. N = 2 independent experiments with n = 8776–11674 cells per condition. Unpaired t-test. ** P < 0.01. L, Proposed mechanism.

Similar articles

Cited by

References

    1. Bray F, Ferlay J, Soerjomataram I, Siegel RL, Torre LA, Jemal A. Global cancer statistics 2018: GLOBOCAN estimates of incidence and mortality worldwide for 36 cancers in 185 countries. CA: a cancer journal for clinicians 2018;68:394–424 - PubMed
    1. Haque R, Ahmed SA, Inzhakova G, Shi J, Avila C, Polikoff J, et al. Impact of breast cancer subtypes and treatment on survival: an analysis spanning two decades. Cancer epidemiology, biomarkers & prevention : a publication of the American Association for Cancer Research, cosponsored by the American Society of Preventive Oncology 2012;21:1848–55 - PMC - PubMed
    1. Jia M, Dahlman-Wright K, Gustafsson JA. Estrogen receptor alpha and beta in health and disease. Best practice & research Clinical endocrinology & metabolism 2015;29:557–68 - PubMed
    1. Sommer S, Fuqua SA. Estrogen receptor and breast cancer. Seminars in cancer biology 2001;11:339–52 - PubMed
    1. Ikeda K, Horie-Inoue K, Inoue S. Identification of estrogen-responsive genes based on the DNA binding properties of estrogen receptors using high-throughput sequencing technology. Acta pharmacologica Sinica 2015;36:24–31 - PMC - PubMed

Publication types

Substances