. 2020 Nov 15;147(22):dev190140.
doi: 10.1242/dev.190140.

Drosophila sperm development and intercellular cytoplasm sharing through ring canals do not require an intact fusome

Affiliations

Drosophila sperm development and intercellular cytoplasm sharing through ring canals do not require an intact fusome

Ronit S Kaufman et al. Development. .

Abstract

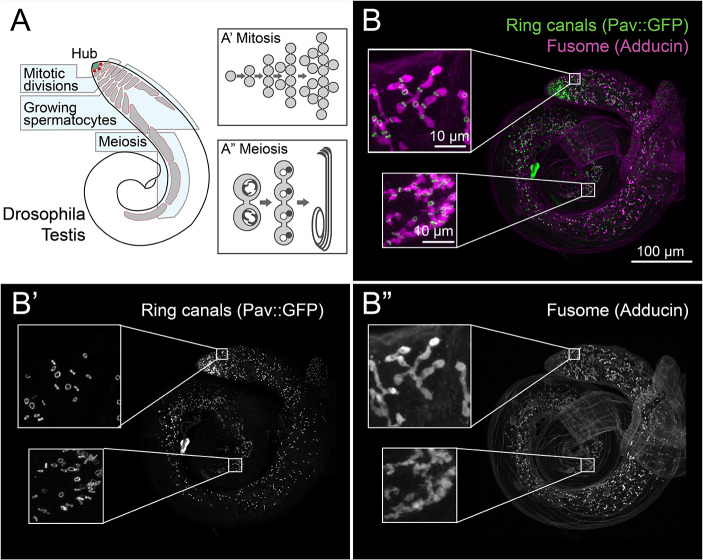
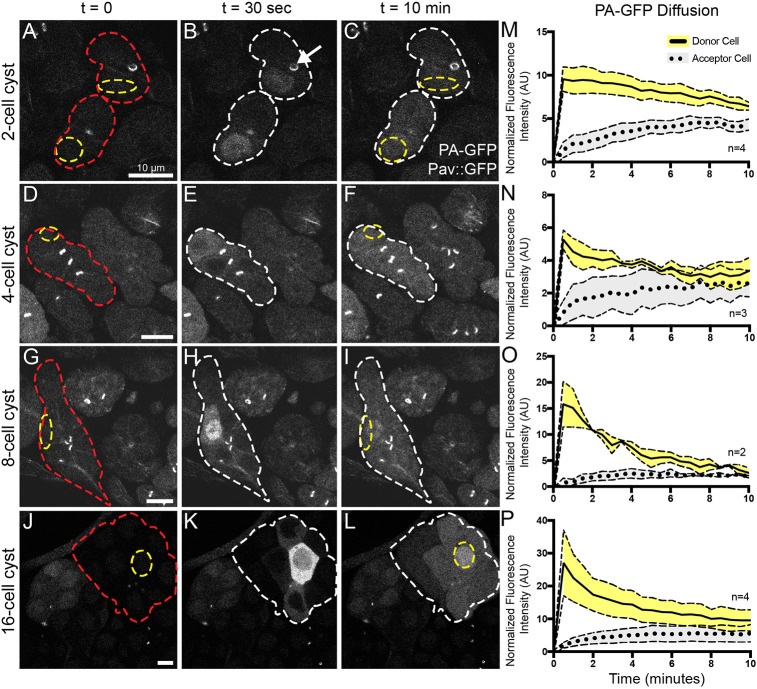
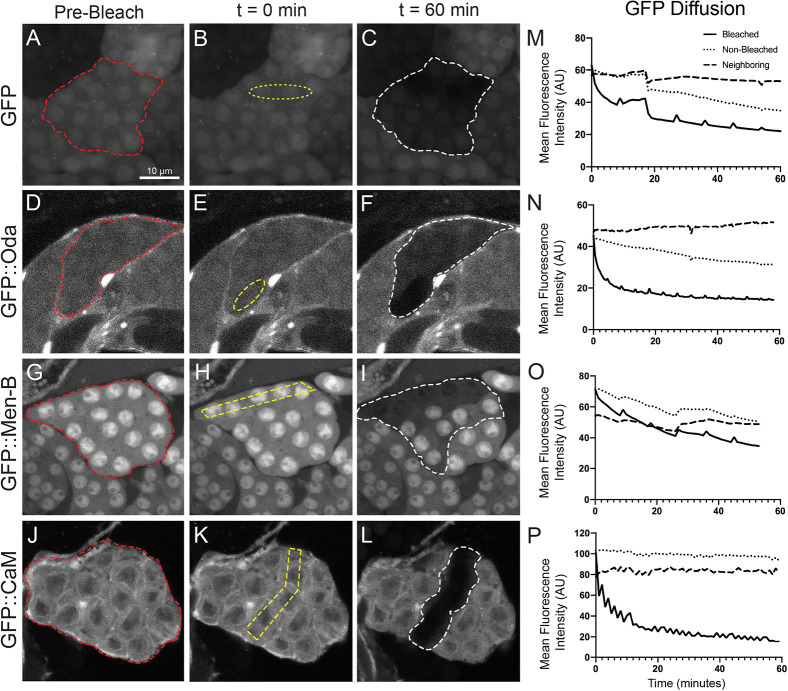
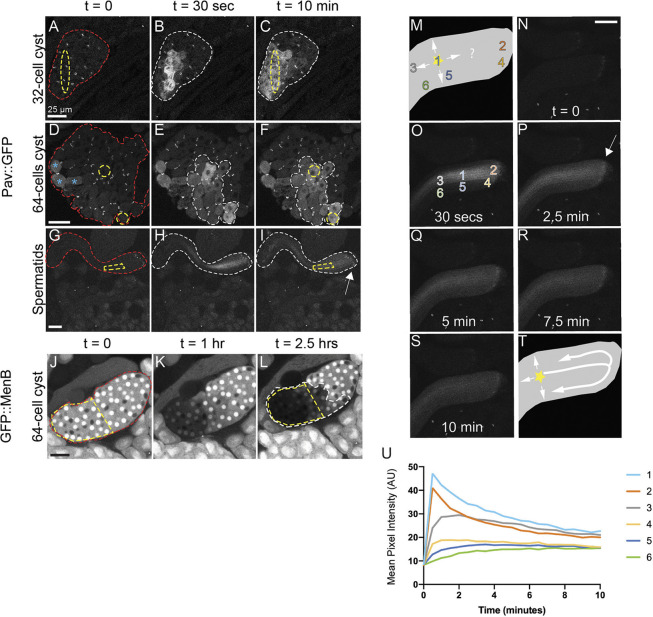
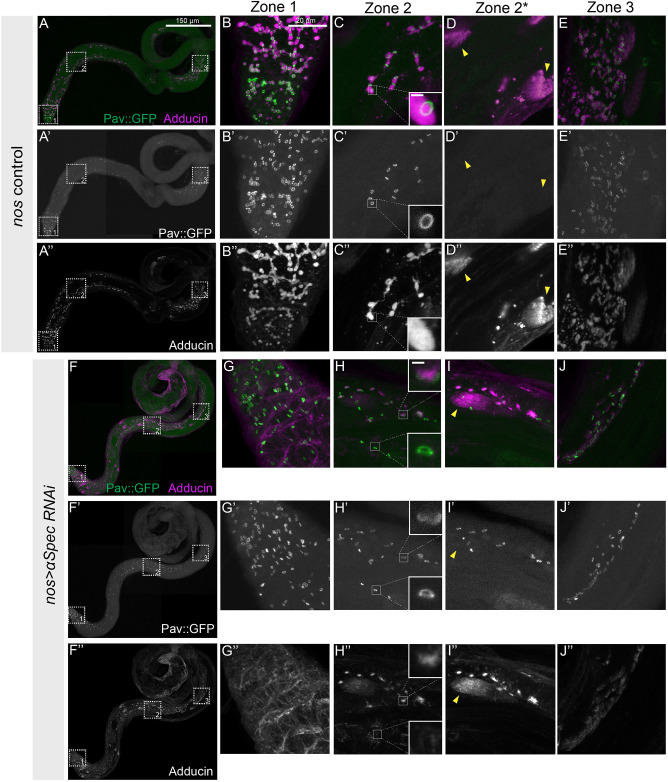
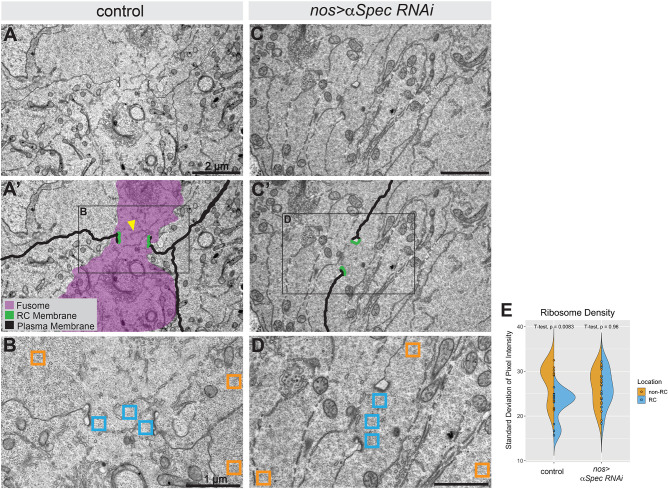
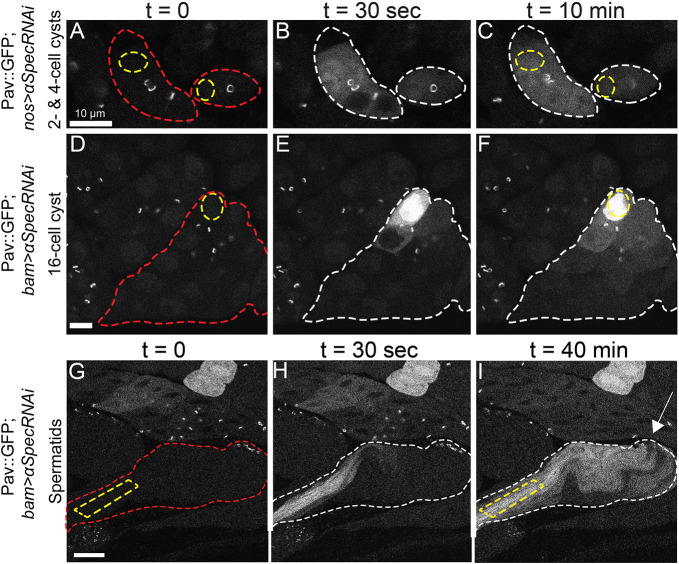
Animal germ cells communicate directly with each other during gametogenesis through intercellular bridges, often called ring canals (RCs), that form as a consequence of incomplete cytokinesis during cell division. Developing germ cells in Drosophila have an additional specialized organelle connecting the cells called the fusome. Ring canals and the fusome are required for fertility in Drosophila females, but little is known about their roles during spermatogenesis. With live imaging, we directly observe the intercellular movement of GFP and a subset of endogenous proteins through RCs during spermatogenesis, from two-cell diploid spermatogonia to clusters of 64 post-meiotic haploid spermatids, demonstrating that RCs are stable and open to intercellular traffic throughout spermatogenesis. Disruption of the fusome, a large cytoplasmic structure that extends through RCs and is important during oogenesis, had no effect on spermatogenesis or male fertility under normal conditions. Our results reveal that male germline RCs allow the sharing of cytoplasmic information that might play a role in quality control surveillance during sperm development.

Keywords: Drosophila spermatogenesis; Fusome; Intercellular movement; Ring canal.


Conflict of interest statement

Competing interestsThe authors declare no competing or financial interests.

Figures

Fig. 1.
Fig. 1.
Overview of spermatogenesis in the Drosophila testis. (A) Cartoon depicting spermatid development in Drosophila. Germline stem cells (red) are located at the hub (green) of the testis. (A′) Spermatogonia divide mitotically four times to form a 16-cell cyst. (A″) These cysts undergo a growth phase of ∼3 days before undergoing two rounds of meiosis to form 64-cell cysts. Following this, each cell elongates a tail to form bundles of mature spermatids. (B-B″) Immunofluorescence shows that ring canals marked by Pav::GFP (B′) and the fusome stained with Adducin antibody (B″) are present throughout spermatogenesis. Scale bar: 100 μm; inset 10 μm.
Fig. 2.
Fig. 2.
RCs allow movement of GFP between germline cells in a cyst. (A-L) Live imaging of activated PA-GFP at various stages of spermatogenesis reveals sharing of GFP between cells in a cyst (red outline) through the ring canals (marked with Pav::GFP, white arrow). After activation of PA-GFP in a single cell or small region of cells (yellow outline), GFP was found in most of the cells in that cyst after 10 min (white outline). Scale bars: 10 μm. (M-P) Quantification of PA-GFP movement following photoactivation from a single donor cell (solid line) to other cells within the cyst (dashed line represents the fluorescence intensity from an average of all other non-activated cells within the same cyst). Normalized fluorescence intensity (AU) was plotted with respect to time. Error bars represent s.e.m.
Fig. 3.
Fig. 3.
RCs allow for sharing of some, but not all, proteins. (A-L) Fluorescence loss in photobleaching (FLIP) demonstrated that not all GFP-tagged proteins move between the cells in a 16-cell cyst. Several cells within a 16-cell cyst (red outline) expressing GFP or a GFP-tagged protein were continuously bleached (yellow outline) over the course of 1 h. Protein movement was determined by a loss in GFP fluorescence from neighboring cells within that cyst (white outline), indicating that GFP from non-bleached cells moved into the bleached region. (M-P) Quantification of GFP from the representative images (A-L) in the bleached (solid line), non-bleached (dotted line) and neighboring (dashed line) regions in a spermatocyte cyst. FLIP was detected for GFP, GFP::Oda, GFP::Men-B but not GFP::CaM. Mean fluorescence intensity (AU) is plotted with respect to time. Intermittent peaks on the graphs represent quick recovery of GFP in the sample while the microscope switches between capture and bleach modes. Scale bar: 10 μm.
Fig. 4.
Fig. 4.
Movement of proteins in meiotic cysts and haploid spermatids. (A-I) After meiosis I and II, and during elongation of spermatid tails, PA-GFP moved between cells of a cyst (red outline). PA-GFP activated within a small region of the cyst (yellow outline) appeared in neighboring cells within that cyst (white outline). Cells activated previously in D are marked with blue asterisks. White arrow indicates RC end of spermatid bundle. (J-L) Movement of endogenous GFP::Men-B occurred in post-meiotic 64-cell cysts. Bleaching zone in this FLIP experiment is outlined in yellow. Cells with loss of fluorescence are outlined in white. Scale bars: 25 μm. (M) Cartoon of spermatid bundle depicting possible pathways of PA-GFP spread after activation (marked by star at position 1). (N-S) PA-GFP activation in a spermatid bundle over the course of 10 min with activation occurring in region 1 (shown in O). Scale bar: 25 μm. (T) Cartoon of actual PA-GFP spread showing that movement is predominantly through RCs rather than through lateral perforations. (U) Normalized fluorescence intensity of PA-GFP over time measured at the regions indicated in O. GFP fluorescence increased in region 4 (yellow line) before region 5 (dark-blue line). The RC end of spermatid bundles is marked by an arrow.
Fig. 5.
Fig. 5.
nos Gal4-driven knockdown of α-Spectrin is sufficient to compromise the fusome throughout spermatogenesis. (A-A″) Wild-type testis with RCs marked by Pav::GFP and fusomes labeled with Adducin antibody (1B1). (B-C″,E-E″) Detailed images of the regions marked by boxes in A-A″, highlighting the RCs (Pav, green) and fusome (Adducin, purple) in a wild-type testis at three different stages of development: mitotic (zone 1), post-mitotic (zone 2) and elongated spermatids (zone 3). Insets in C-C″ highlight one RC. (D-D″,I-I″) Zone 2* highlights the growing ends of spermatid tails from the same ROI, but different z plane, as zone 2. (F-F″) Testes with α-Spec RNAi driven by nos-Gal4 lack Adducin staining at the fusome, but testis morphology appears unaffected. (G-J″) Detailed images of the regions marked in F showing Adducin staining at the membrane rather than in a fusome pattern, while Pav::GFP remained localized to the RCs. Insets in H-H″ highlight one RC. Scale bars: 150 µm in A-A″,F-F″; 20 μm in B-E″,G-J″; 1 µm in insets in C-C″,H-H″.
Fig. 6.
Fig. 6.
Ribosome density reveals lack of fusomes in α-Spectrin RNAi testes. (A) EM of Pav::GFP testis revealed electron-dense RCs surrounding a fusome. (A′) False coloring of A highlights electron-dense RCs (green), plasma membrane (black), ER-like vesicles (yellow arrowhead) and a ribosome-free fusome area (purple). (B) Area outlined in A′ showing locations used for quantification of ribosome density in E. (C) EM of two cells connected by a RC in a α-Spec RNAi testis. (C′) False coloring of C highlighting RCs (green) and a plasma membrane (black) but no discernible fusome structure. (D) Area outlined in C′ shows locations used for quantification of ribosome density in E in the α-Spec RNAi testis. (E) Quantification of ribosome density shown as a split violin plot of standard deviation of pixel intensity values from regions of either RC (blue) or non-RC (orange) cytoplasmic compartments in controls or α-Spec RNAi testes.
Fig. 7.
Fig. 7.
PA-GFP moves through RCs despite knockdown of fusome components. (A-F) α-Spec RNAi driven by nos-Gal4 in two- and four-cell spermatogonia (A-C) and bam-Gal4 in 16-cell spermatocyte cysts (D-F; red outlines) did not affect movement of GFP through RCs (marked with Pav::GFP). PA-GFP was activated in one cell (yellow outline) and moved through the RCs to other cells within that cyst (white outline). (G-I) PA-GFP movement occurred through RCs in elongated spermatids, even after disruption of the fusome with α-Spec RNAi. Scale bars: 10 μm.

Similar articles

Cited by

References

    1. Airoldi S. J., McLean P. F., Shimada Y. and Cooley L. (2011). Intercellular protein movement in syncytial Drosophila follicle cells. J. Cell Sci. 124, 4077-4086. 10.1242/jcs.090456 - DOI - PMC - PubMed
    1. Barreau C., Benson E., Gudmannsdottir E., Newton F. and White-Cooper H. (2008a). Post-meiotic transcription in Drosophila testes. Development 135, 1897-1902. 10.1242/dev.021949 - DOI - PubMed
    1. Barreau C., Benson E. and White-Cooper H. (2008b). Comet and cup genes in Drosophila spermatogenesis: the first demonstration of post-meiotic transcription. Biochem. Soc. Trans. 36, 540-542. 10.1042/BST0360540 - DOI - PubMed
    1. Braun R. E., Behringer R. R., Peschon J. J., Brinster R. L. and Palmiter R. D. (1989). Genetically haploid spermatids are phenotypically diploid. Nature 337, 373-376. 10.1038/337373a0 - DOI - PubMed
    1. Brown R. K. and Smith W. L. (1964). Chromosomal studies in ovarian dysgenesis. Trans. N. Engl. Obstet. Gynecol. Soc. 18, 47-54. - PubMed

Publication types

LinkOut - more resources