. 2020 Oct 9;370(6513):eabc8420.
doi: 10.1126/science.abc8420.

Reconstitution and visualization of HIV-1 capsid-dependent replication and integration in vitro

Affiliations

Reconstitution and visualization of HIV-1 capsid-dependent replication and integration in vitro

Devin E Christensen et al. Science. .

Abstract

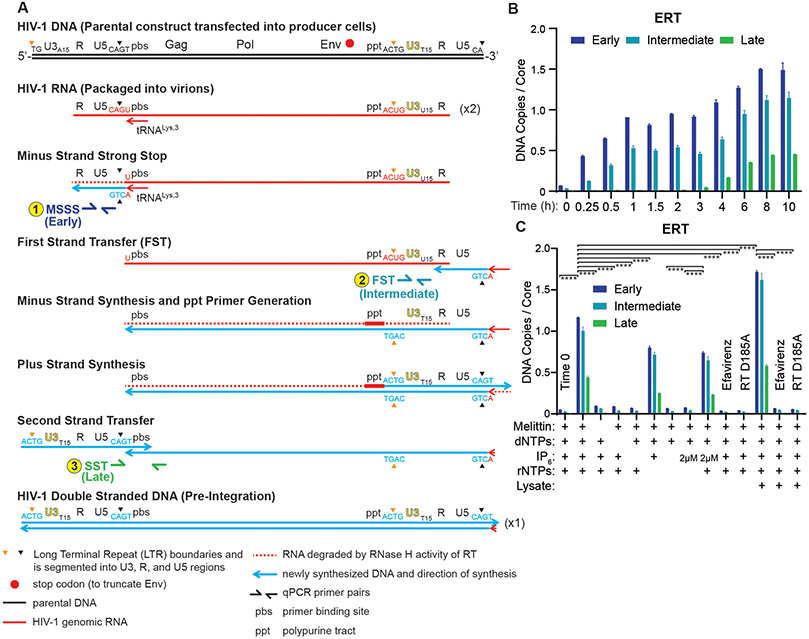
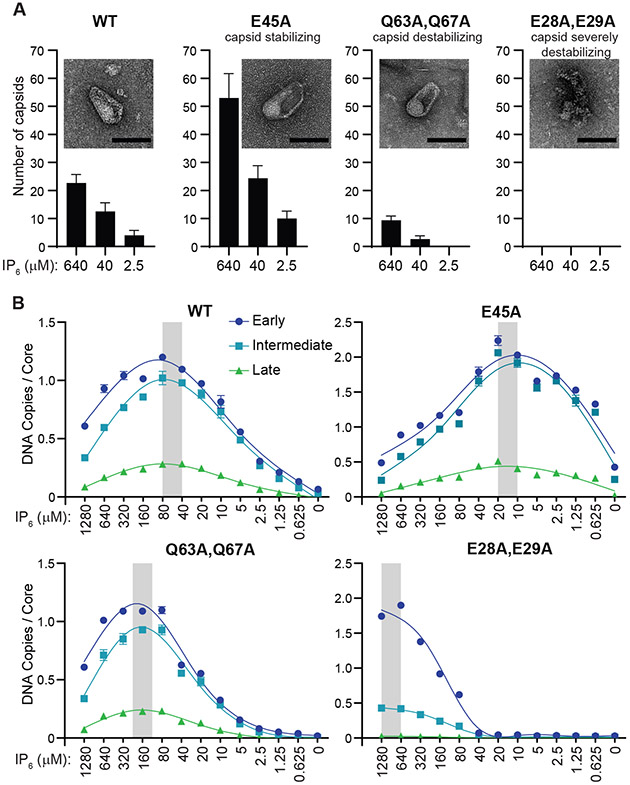
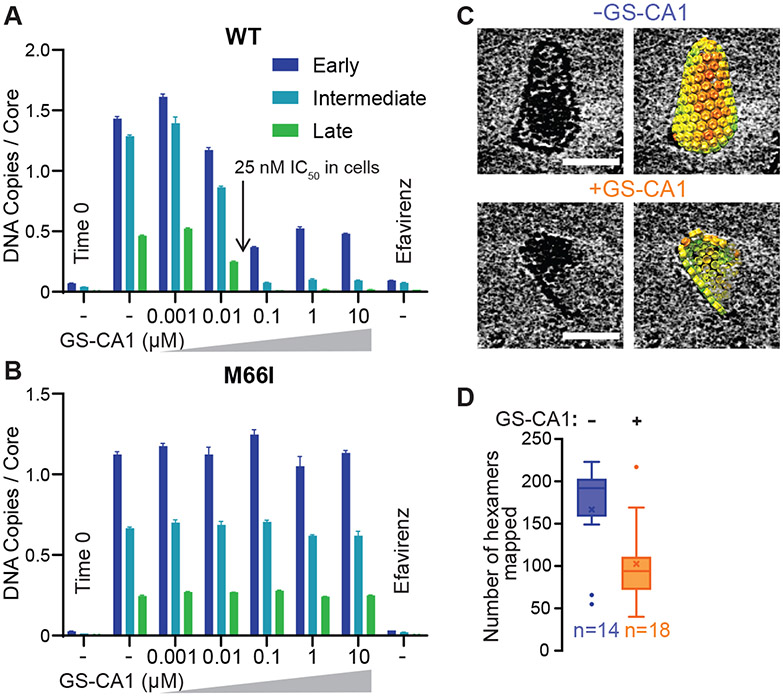
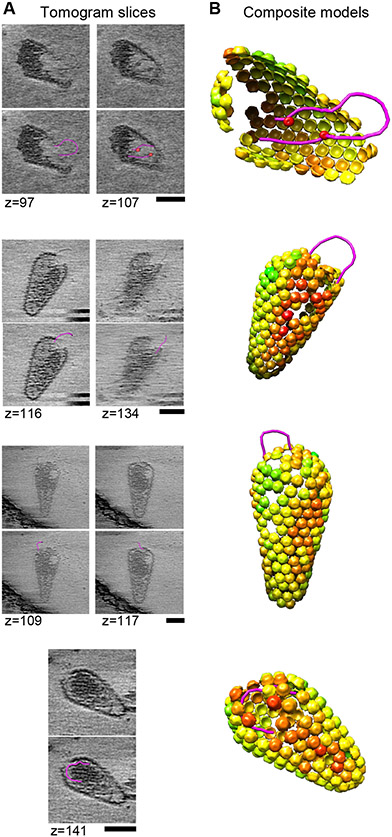
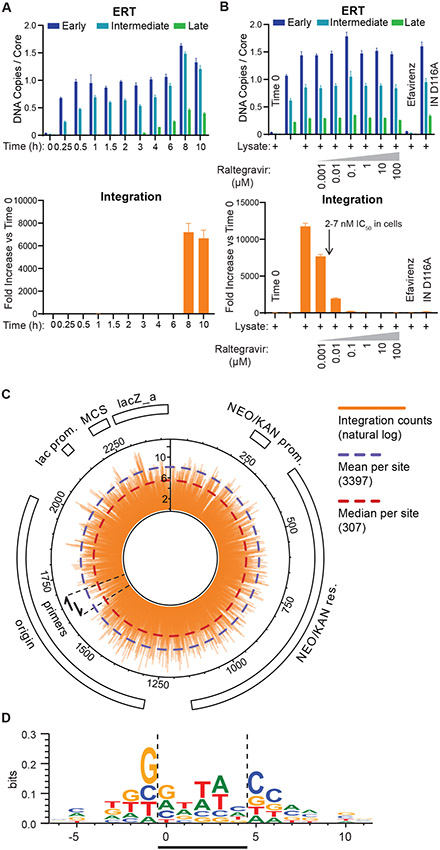
During the first half of the viral life cycle, HIV-1 reverse transcribes its RNA genome and integrates the double-stranded DNA copy into a host cell chromosome. Despite progress in characterizing and inhibiting these processes, in situ mechanistic and structural studies remain challenging. This is because these operations are executed by individual viral preintegration complexes deep within cells. We therefore reconstituted and imaged the early stages of HIV-1 replication in a cell-free system. HIV-1 cores released from permeabilized virions supported efficient, capsid-dependent endogenous reverse transcription to produce double-stranded DNA genomes, which sometimes looped out from ruptured capsid walls. Concerted integration of both viral DNA ends into a target plasmid then proceeded in a cell extract-dependent reaction. This reconstituted system uncovers the role of the capsid in templating replication.


Figures

Fig. 1.
Fig. 1.. Endogenous Reverse Transcription.
(A) Different steps in HIV-1 reverse transcription, and primer positions used to assess them. (B) Time course showing accumulation of early, intermediate, and late ERT products, as quantified by qPCR. Note that synthesis of the viral plus strand cDNA introduces second copies of the binding sites for the primers used to detect early (MSSS) and intermediate (FST), which accounts for the apparent increase in signal for those two products seen between 4 and 6 hours. (C) ERT product accumulation under different reaction conditions (10 h, 37C incubations except where noted, and see Materials and Methods for other details). The RT inhibitor efavirenz (10 μM) and an inactive RT mutant enzyme (D185A) were used as negative controls. p values are from a one-way ANOVA test with Tukey’s multiple comparisons test: p<0.01: **, p<0.001: ***, p<0.0001: ****. Graphs and error bars show mean ± SD from three qPCR measurements from a representative experiment, selected from three independent experiments.
Fig. 2.
Fig. 2.. Effects of Capsid Stability on ERT Efficiency.
(A) Stability of HIV-1 capsids composed of wild type (WT) or the indicated CA mutant subunits. Capsid stability was assessed by treating virions with melittin to release cores into lysate-free ERT buffers that contained different IP6 levels, and then quantifying the numbers of apparently intact capsids (insets; scale bars, 100 nm) by imaging with negative stain transmission electron microscopy (TEM). Graphs report the mean and standard deviation (n=3) of intact cores per 900 μm2 under the different conditions (see Materials and Methods and Fig. S1 for details). (B) ERT levels from cores with WT or mutant CA proteins at different IP6 concentrations. Grey bars highlight IP6 concentrations that optimized transcript numbers. Standard “non-lysate” conditions were used for these experiments, except for variations in IP6 levels.
Fig. 3.
Fig. 3.. Effects of the Capsid Inhibitor GS-CA1.
(A, B) ERT levels in the presence of different concentrations of GS-CA1, for cores containing WT (A) or a drug-resistant CA mutant M66I (B). Standard ERT conditions were used for these experiments. (C) Cryo-EM images of cores observed after 4 h under standard ERT conditions in the absence or presence of 100 nM GS-CA1. Scale bars, 50 nm. The capsid lattices are rendered as hexamer units, each colored by cross-correlation value as determined by sub-tomogram averaging, with red denoting low correlations. Full galleries are shown in Fig. S2. (D) Number of CA hexamers mapped per observable core in the absence or presence of 100 nM GS-CA1. Data are composite from two independent experiments that agreed well. Center lines show the medians, mean values are denoted by ×, box limits indicate the 25th and 75th percentiles, whiskers extend to minimum and maximum values, and circles indicate outliers, as determined in GraphPad Prism. Note that fully intact capsids contain an average of 240 hexamers.
Fig. 4.
Fig. 4.. Imaging Cores During Viral Replication.
(A) Tomographic slices of ruptured cores observed after 8-10 h under standard ERT conditions. Polynucleotide loops (magenta) were segmented using the tools in imod (58). Red spheres indicate apparent protein densities associated with the loops within the core. Scale bars, 50 nm. (B) Composite representations illustrating the three-dimensional arrangements of loops and capsid lattice maps. The capsid lattice maps are rendered as hexamer units, each colored by cross-correlation value as determined by sub-tomogram averaging, with red denoting low correlations.
Fig. 5.
Fig. 5.. Reconstituted Integration.
(A) Time courses showing accumulation of ERT (upper panel) and integration products (lower panel). The time courses show the sequential formation of early, intermediate and late ERT products, followed by integration. Note that integration products first appeared at t=8 h, in parallel with peak production of late ERT products. Error bars here and in (B) show mean ± SD from three qPCR measurements from a representative experiment, selected from three independent experiments. (B) Quantification of ERT (upper panel) and integration products under different reaction conditions (see Materials and Methods for details). Negative controls show the effects of no incubation (t=0), raltegravir (IN inhibitor, 1 nM-100 μM), efavirenz (RT inhibitor, 10 μM), or an inactivating IN mutation (D116A). (C) Circular pK184 plasmid map showing the position and frequency of integration events determined by deep sequencing of read junctions between the 3’ end of the viral genome and the target plasmid (orange bars, ln scale). The graphic shows composite data from three independent integration and deep sequencing reactions, with integration in both possible orientations picked up by the two designated primers. (D) Favored DNA sequences for HIV integration, analyzed using WebLogo as described in Materials and Methods. HIV integration in the target DNA sequence occurs between positions 0 and −1 on the sequenced strand and between positions 4 and 5 for the complementary strand. A representative logo from one of three experiments (sample 47, Supplemental Table S1) is shown. Bases and their heights show the level of conservation at each target base position (perfect conservation = 2 bits).

Comment in

References

    1. Saag MS et al., Antiretroviral Drugs for Treatment and Prevention of HIV Infection in Adults: 2018 Recommendations of the International Antiviral Society-USA Panel. JAMA 320, 379–396 (2018). - PMC - PubMed
    1. De Clercq E, The nucleoside reverse transcriptase inhibitors, nonnucleoside reverse transcriptase inhibitors, and protease inhibitors in the treatment of HIV infections (AIDS). Adv Pharmacol 67, 317–358 (2013). - PubMed
    1. Arts EJ, Hazuda DJ, HIV-1 antiretroviral drug therapy. Cold Spring Harb Perspect Med 2, a007161 (2012). - PMC - PubMed
    1. Lesbats P, Engelman AN, Cherepanov P, Retroviral DNA Integration. Chem Rev 116, 12730–12757 (2016). - PMC - PubMed
    1. Coffin JM, Fan H, The Discovery of Reverse Transcriptase. Annu Rev Virol 3, 29–51 (2016). - PubMed

Publication types