. 2020 Oct 27;117(43):26822-26832.
doi: 10.1073/pnas.2016905117. Epub 2020 Oct 8.

Multiscale imaging of basal cell dynamics in the functionally mature mammary gland

Affiliations

Multiscale imaging of basal cell dynamics in the functionally mature mammary gland

Alexander J Stevenson et al. Proc Natl Acad Sci U S A. .

Abstract

The mammary epithelium is indispensable for the continued survival of more than 5,000 mammalian species. For some, the volume of milk ejected in a single day exceeds their entire blood volume. Here, we unveil the spatiotemporal properties of physiological signals that orchestrate the ejection of milk from alveolar units and its passage along the mammary ductal network. Using quantitative, multidimensional imaging of mammary cell ensembles from GCaMP6 transgenic mice, we reveal how stimulus evoked Ca2+ oscillations couple to contractions in basal epithelial cells. Moreover, we show that Ca2+-dependent contractions generate the requisite force to physically deform the innermost layer of luminal cells, compelling them to discharge the fluid that they produced and housed. Through the collective action of thousands of these biological positive-displacement pumps, each linked to a contractile ductal network, milk begins its passage toward the dependent neonate, seconds after the command.

Keywords: GCaMP6; calcium signaling; lactation; mammary gland; oxytocin.


Conflict of interest statement

The authors declare no competing interest.

Figures
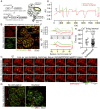
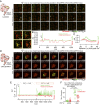
Fig. 1.
Fig. 1.
Basal cell Ca2+ oscillations precede alveolar contractions. (A) Schematic representation of GCaMP6f;K5CreERT2 model. (B) Maximum intensity z-projection of cleared lactating mammary tissue immunostained with smooth muscle actin (SMA) to reveal basal cells and anti-GFP antibody to detect GCaMP6f. (C) Three-dimensional time-lapse imaging of live mammary tissue from GCaMP6f;K5CreERT2 lactating mice stimulated with OT (85 nM) at 01:33 (min:s). Images show maximum intensity z-projection. Arrowheads point to Ca2+ events in single cells. See Movie S1. (D) Maximum intensity z-projections of cleared mammary tissue immunostained with K14 to reveal basal cells and pMLC to show sites of contractile activity. Arrow shows pMLC+ blood vessel in control tissue, arrowhead shows pMLC+ basal cell in tissue stimulated with OT (85 nM) prior to fixation; dotted lines surround alveolar units. (E) Quantification of [Ca2+]i responses (green) and alveolar unit contraction (red) in lactating mammary tissue from GCaMP6f;K5CreERT2 mice. [Ca2+]i measurements are ΔF/F0. Alveolar unit contractions shown by negative deflections (CellTracker fluorescence). (F and G) Average (±SEM) peak [Ca2+]i and contractile responses. Highlighting (x axis) corresponds with events linked in E; arrowheads show initiation of the response. (H) Interval between the first and second, and all subsequent [Ca2+]i events (P > 0.05, Student’s t test). AU, arbitrary unit; n = 3 mice.
Fig. 2.
Fig. 2.
Ca2+-contraction coupling. (A) Three-dimensional time-lapse imaging of live mammary tissue from GCaMP6f-TdTom;K5CreERT2 mice stimulated with OT (85 nM) at 01:09 (min:s). Images show maximum intensity z-projection. Box (frame 1) expanded in panel Below; arrowheads point to Ca2+ events in single cells. See Movie S3. (B) Quantification of [Ca2+]i responses (green) and alveolar unit contraction (red) in lactating mammary tissue from GCaMP6f-TdTom;K5CreERT2 mice. [Ca2+]i measurements are ΔF/F0. Basal cell contractions shown by negative deflections (TdTomato fluorescence). (C) Average (±SEM) peak [Ca2+]i response and contractile response in mammary tissue isolated from lactating GCaMP6f-TdTom;K5CreERT2 mice. Values averaged from both the first response and the oscillatory phase. (D) Three-dimensional time-lapse imaging of live mammary tissue from GCaMP6f-TdTom;K5CreERT2 mice (15.5 to 16.5 days postcoitus (d.p.c.) stimulated with OT (85 nM) at 01:08 (min:s) under extracellular Ca2+ free conditions. Images show maximum intensity z-projection. Ca2+ (1 mM free Ca2+) was added back at 20:23 (min:s). See Movie S5. (E) Quantification of [Ca2+]i responses and alveolar unit contraction in mammary tissue from pregnant GCaMP6f-TdTom;K5CreERT2 mice stimulated with OT under extracellular Ca2+-free conditions and with Ca2+ addback. [Ca2+]i measurements are ΔF/F0. Basal cell contractions shown by negative deflections (TdTomato fluorescence). (F) Number of [Ca2+]i and contraction events ± extracellular Ca2+ ([Ca2+]O). Graph shows individual measurements and median. P value in parentheses is from multiple t tests. n = 3 mice.
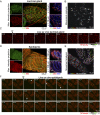
Fig. 3.
Fig. 3.
Functional differentiation and Ca2+-contraction coupling in ducts and alveoli. (A and B) Immunostaining of paraffin-embedded mouse and human lactating tissue. MLCK, CNN1, and CALD1 are expressed in both ducts (Du) and alveoli. E-cadherin shows the luminal cell lineage; K14 shows the basal cell lineage. Nuclei are stained with DAPI; n = 3 samples, mouse and human. (C) Three-dimensional time-lapse imaging of live mammary tissue from a pregnant (15.5 to 16.5 d.p.c.) GCaMP6f-TdTom;K5CreERT2 mouse stimulated with OT (85 nM) at 01:15 (min:s). Images show maximum intensity z-projection of live tissue; box (frame 1) shows subtending duct (Du, magnified at Bottom), extending deeper into the tissue. Arrowhead at 01:54 shows direction of OT diffusion; asterisks show coordinated firing; n = 3. See Movie S6. (D) Three-dimensional time-lapse imaging of a large duct from a lactating GCaMP6f-TdTom;K5CreERT2 mouse stimulated with OT (85 nM) immediately prior to imaging. Images show maximum intensity z-projection of live tissue; n = 3. See Movie S7. (E) Percent of cells with a high correlation coefficient (>0.5) in Ca2+ firing and the Euclidean distance of correlated events. Graph shows average ± SEM (n = 4 mice, gestation).
Fig. 4.
Fig. 4.
OT responses in basal epithelial cells of other fluid-moving organs. (A) Maximum intensity z-projection and optical slices of lacrimal tissue. Lacrimal acinar basal cells express K14 and SMA. (B) Analysis of tissue movement created by the overlay of three images (approximately 43 s apart). Each image has been assigned a primary color. Regions that do not move during the 90-s window have R-G-B (red, green, and blue) pixels superimposed and are white. Regions where significant movement has occurred appear R, G, B or a combination of two colors. See Movie S8. (C) Three-dimensional time-lapse imaging of lacrimal tissue from GCaMP6f-TdTom;K5CreERT2 mice. Tissue was stimulated with OT (85 nM, 00:45). Image series show maximum intensity z-projection. (D) Maximum intensity z-projection and optical slices of cleared mouse caput epididymis. Basal K14 positive cells are surrounded by SMA positive cells (arrow). (E) Tissue movement analysis of three images (approximately 45 s apart) as per B. (F) Three-dimensional time-lapse imaging of epididymal tissue from GCaMP6f-TdTom;K5CreERT2 mice. Tissue was stimulated with OT (850 nM, 01:38); arrows show single-cell calcium responses. See Movie S9. n = 3 mice.
Fig. 5.
Fig. 5.
Pharmacological inhibition of the contractile pathway. (A) Matrix of contractile activity in tissue pieces isolated from uterus, epididymis, bladder, and mammary gland and treated with either buffer (control), a combination of inhibitors of MLCK (ML-9) and ROCK (Y27632), or a combination of inhibitors of MLCK (ML-9), ROCK (Y27632), PKC (calphostin-C), and CaMKII (KN93). Contractions were induced with oxytocin (85 nM, uterus and mammary gland; 850 nM epididymis) or carbachol (10 μM, bladder). See Movie S10. (B) Analysis of tissue movement in mammary tissue pieces created by the overlay of three images (30 s apart). Each image has been assigned a primary color. Regions that do not move during the 60-s window have R-G-B pixels superimposed and are white. Regions where significant movement has occurred appear R, G, B, or a combination of two colors. n = 4 mice.
Fig. 6.
Fig. 6.
Dantrolene-induced tissue synchronization. (A) Sequential non-negative matrix factorization (seqNMF) was used for unsupervised discovery of repeated temporal sequences of activation and to cluster cells accordingly. Temporal sequence 1 corresponds to the initial InsP3 response; temporal sequence 2 corresponds to the dantrolene-dependent synchronized oscillations. Dots (Top) are cells color coded (see timing colorbar) according to the order of their activation in the sequence (Middle, each row is one cell) and overlaid on a maximum intensity z-projection of the green channel. The times at which each temporal sequence of [Ca2+]i activity is repeated for each cluster is represented by a spike at the Bottom; n = 3 mice. (B) Interval between each synchronized oscillation in ex vivo dantrolene-treated mammary tissue (mean ± 95% CI); n = 5 tissue pieces from at least 3 mice. (C) Optically cleared mammary tissue from lactating mice showing SMA immunostaining (green, Top) and cells expressing a membrane-targeted fluorescent protein (red, Top). Colored arrowheads point to sites of cell–cell contact that are revealed by the membrane fluorescent protein (Lck-GCaMP6f/mGFP, detected using an anti-GFP antibody). Immunostaining for Cx43 (white, Bottom) in cells expressing the membrane-targeted fluorescent protein (red, Bottom). White arrows show Cx43 staining at sites where basal cells are connected; B, basal cell; n = 3 mice. (D) seqNMF as in A, where temporal sequence 1 corresponds to the initial InsP3 response; temporal sequence 2 corresponds to dantrolene-dependent synchronized oscillations; and temporal sequence 3 corresponds to addition of nifedipine. After addition of nifedipine, the synchronized activity disappears and switches to a stochastic activity distributed through the tissue, as can be seen by the lack of repeated spikes in the bottom pane. See Movie S15. n = 3 mice.

Similar articles

Cited by

References

    1. Victora C. G.et al. .; Lancet Breastfeeding Series Group , Breastfeeding in the 21st century: Epidemiology, mechanisms, and lifelong effect. Lancet 387, 475–490 (2016). - PubMed
    1. Macias H., Hinck L., Mammary gland development. Wiley Interdiscip. Rev. Dev. Biol. 1, 533–557 (2012). - PMC - PubMed
    1. Cowin P., Wysolmerski J., Molecular mechanisms guiding embryonic mammary gland development. Cold Spring Harb. Perspect. Biol. 2, a003251 (2010). - PMC - PubMed
    1. Lloyd-Lewis B., Harris O. B., Watson C. J., Davis F. M., Mammary stem cells: Premise, properties and perspectives. Trends Cell Biol. 27, 556–567 (2017). - PubMed
    1. Sleeman K. E.et al. ., Dissociation of estrogen receptor expression and in vivo stem cell activity in the mammary gland. J. Cell Biol. 176, 19–26 (2007). - PMC - PubMed

Publication types

Substances