. 2020 Oct 27;117(43):26812-26821.
doi: 10.1073/pnas.2013163117. Epub 2020 Oct 8.

Two classes of active transcription sites and their roles in developmental regulation

Affiliations

Two classes of active transcription sites and their roles in developmental regulation

Sarah Robinson-Thiewes et al. Proc Natl Acad Sci U S A. .

Abstract

The expression of genes encoding powerful developmental regulators is exquisitely controlled, often at multiple levels. Here, we investigate developmental expression of three conserved genes, Caenorhabditis elegans mpk-1, lag-1, and lag-3/sel-8, which encode homologs of ERK/MAPK and core components of the Notch-dependent transcription complex, respectively. We use single-molecule FISH (smFISH) and MATLAB to visualize and quantify nuclear nascent transcripts and cytoplasmic mRNAs as a function of position along the germline developmental axis. Using differentially labeled probes, one spanning an exceptionally long first intron and the other spanning exons, we identify two classes of active transcription sites (ATS). The iATS class, for "incomplete" ATS, harbors only partial nascent transcripts; the cATS class, for "complete" ATS, harbors full-length nascent transcripts. Remarkably, the frequencies of iATS and cATS are patterned along the germline axis. For example, most mpk-1 ATS are iATS in hermaphrodite germline stem cells, but most are cATS in differentiating stem cell daughters. Thus, mpk-1 ATS class frequencies switch in a graded manner as stem cell daughters begin differentiation. Importantly, the patterns of ATS class frequency are gene-, stage-, and sex-specific, and cATS frequency strongly correlates with transcriptional output. Although the molecular mechanism underlying ATS classes is not understood, their primary difference is the extent of transcriptional progression. To generate only partial nascent transcripts in iATS, progression must be slowed, paused, or aborted midway through the gene. We propose that regulation of ATS class can be a critical mode of developmental gene regulation.

Keywords: ERK/MAPK; active transcription site; germ cell development.


Conflict of interest statement

The authors declare no competing interest.

Figures

Fig. 1.
Fig. 1.
C. elegans germline anatomy and key regulatory genes. (A, Left) Adult hermaphrodite has two U-shaped gonadal arms (in colors). The distal gonad (red square) houses germ cells that are either dividing (yellow) or in early meiotic prophase (green); proximal germ cells make oocytes (pink). Sperm (blue) were made as larvae. (A, Right) Development in distal gonad. The progenitor zone (PZ) includes germline stem cells (GSCs) within their niche (gray) and stem cell daughters primed to differentiate; upon leaving the PZ, germ cells enter meiotic prophase (green crescents). (B) Key regulators relevant to this work. (CE) Gene architecture: boxes, exons; lines, introns. Exons include coding regions (gene-specific colors) and untranslated regions (UTRs; gray). Direction of transcription is the same for all genes (arrow in C). Vertical lines indicate sites of individual smFISH probes; probe sets target either the large first intron (green) or all exons (magenta). Red asterisk marks site of 1 bp frame-shifting insertion in mpk-1b first exon, used as control for mpk-1 exon probe specificity. Deletions in mpk-1 and lag-3 long first introns were used as control for intron probe specificity. The lag-1 gene makes four isoforms (lag-1a-d); for simplicity, lag-1a represents lag-1a-c, which differ in size of exons 2 and 3. The lag-3a first intron contains predicted ncRNA C32A3.7.
Fig. 2.
Fig. 2.
Identification of two classes of active transcription sites (ATS). (AC) Maximum projections of smFISH images. (Left) Intron probe set signals (green), (Middle) exon probe set signals (magenta), and merge of both signals with DAPI (cyan). (Scale bar, 5 µm.) (D) Two ATS classes: (Left) images and (Right) cartoons. A cATS (complete ATS) is visualized by overlapping intron and exon probe signals; an iATS (incomplete ATS) is visualized by the intron probe signal alone. (E) ATS numbers, regardless of class, detected with either the intron probe set (intron) or exon probe set (exon) for each gene. Overlaps of intron-detected and exon-detected spots were not determined in this analysis. To test if the high number of intron-detected spots reflected fluorophore bias, the fluorophores conjugated to the original mpk-1 intron and exon probes were swapped (*****P < 0.0000001, Student’s t test).
Fig. 3.
Fig. 3.
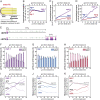
Expression of mpk-1, lag-1, and lag-3 in the distal Progenitor Zone (PZ). (A) Region scored (dashed red box) extends 12 germ cell diameters (gcds) into the PZ from the niche (gray). Numbers indicate positions as gcds along the distal–proximal axis, starting from the distal end according to convention; MATLAB score position in micrometers from the distal end, with each gcd averaging ∼4.4 µm in this region (8). (BD and FK) The x-axis shows position in both gcds (Top) and micrometers (Bottom). Numbers of gonads scored: mpk-1, n = 37; lag-1, n = 36; and lag-3, n = 32. (B) Transcriptional probability measured as percentage of cells with at least one ATS, including both iATS and cATS. Line plots are derived from data in SI Appendix, Fig. S6 AC. Total numbers of cells scored: mpk-1, n = 6,065; lag-1, n = 5,981; and lag-3, n = 4,472. (C) Transcriptional output measured as total number of nascent transcripts at cATS per cell row. Analysis was limited to cATS as explained in the text and detailed in SI Appendix, Methods. Line plots are derived from data in SI Appendix, Fig. S6 GI. (D) Transcriptional output measured as total number of cellular mRNAs per cell row; mRNAs in rachis were excluded. Germ cell boundaries were determined from MATLAB-generated Voronoi cells as described in SI Appendix, Methods. Line plots are derived from data in SI Appendix, Fig. S6 JL. Data for number of mRNAs per cell are in SI Appendix, Fig. S6 MO. (E) Detection of nascent transcripts at iATS (Top) and cATS (Bottom). iATS are seen uniquely with the intron probe set, whereas cATS are seen with overlapping exon and intron probe sets. The mpk-1 intron probe set spans 77% of the full-length transcript (excluding 3′UTR); by contrast, the exon probe set spans only 23%. (FH) iATS and cATS frequencies as a function of position. Each bar shows percentage of total ATS that are cATS (darker bars) or iATS (lighter bars). Numbers of total ATS (cATS plus iATS) scored: mpk-1, n = 5,699; lag-1, n = 6,610; and lag-3, n = 4,200. SEs are shown. (IK) Measures of transcription taken from panels above and combined to highlight patterns of graded increase, decrease, or relative uniformity; individual lines represent quite different measures, and specific values are therefore not comparable. Transcriptional probability (gray line) is from B, cellular mRNA abundance per row (dashed line) is from D, and cATS frequency (dark colored line) and iATS frequency (lighter colored line) are from GI. The original panels show y-axis value ranges.
Fig. 4.
Fig. 4.
Transcription of mpk-1, lag-1, and lag-3 in Early Pachytene (EP) region. (A) Region scored (dashed red box) extends 12 gcds from the TZ/EP boundary. Numbers mark gcd positions, starting at TZ/EP boundary; each gcd averages ∼4.4 µm in this region. SI Appendix, Fig. S7, provides smFISH images. (BJ) Quantification of transcripts. Numbers of gonads scored: mpk-1, n = 36; lag-1, n = 36; and lag-3, n = 37. The x-axis shows position as both gcds (Top) and micrometers (Bottom) from TZ/EP boundary. (B) Transcriptional probability measured as percent cells with one or more ATS of either class. Total cell numbers scored: mpk-1, n = 6,249; lag-1, n = 6,064; and lag-3, n = 4,625. Line plots are from data in SI Appendix, Fig. S8 AC. (C) Transcriptional output measured as total nascent transcripts at cATS per cell row (see text and SI Appendix, Methods). Line plots are from data in SI Appendix, Fig. S8 GI. (D) Transcriptional output measured as total number of mRNAs in cells per row (cells defined as in Fig. 2D); mRNAs in rachis were excluded. Line plots are from data in SI Appendix, Fig. S8 JL. Data for mRNA number per cell are shown in SI Appendix, Fig. S8 MO. (EG) ATS class frequencies as a function of position. Total number of ATS (either class) scored: mpk-1, n = 5,749; lag-1, n = 10,118; and lag-3, n = 4,730. (HJ) Measures of transcription taken from panels above and combined to highlight patterns; individual lines represent different measures, and specific values are therefore not comparable. Transcriptional probability (gray line) is from B, number of mRNAs in cells (dashed colored line) are from D, and cATS frequency (dark colored line) and iATS frequency (light colored line) are from EG. The original panels show y-axis value ranges.
Fig. 5.
Fig. 5.
Male mpk-1 ATS pattern. (A) Male gonad architecture with two somatic niche cells (gray), longer Progenitor and Transition Zones than hermaphrodites (66), but similar GSC pool size in the two sexes (10). Red boxes mark regions analyzed: the first 12 cell rows of PZ and first 12 cell rows of Early Pachytene (EP) region. (B and D) PZ data; conventions as in Fig. 3. Number of gonads scored, n = 24. (C and E) EP data; conventions as in Fig. 4. Number of gonads, n = 22. (B and C) iATS and cATS frequencies in the PZ (B) and EP (C). Total number of ATS scored in PZ, n = 2,195; in EP, n = 1,350. (D and E) Male mpk-1 cATS frequency (solid purple) compared to hermaphrodite cATS frequency (dashed purple) in the PZ (D) and EP (E). Hermaphrodite data are taken from Fig. 3J for PZ and Fig. 4H for the EP.
Fig. 6.
Fig. 6.
Models for ATS classes and their regulation in development. (A) Simple molecular models of iATS and cATS. (Left) iATS nascent transcripts are detected with the long first intron probe set and therefore likely consist of the first exon (Ex1) and much of the long first intron, but not more downstream exons (Ex2-7). We show one incomplete nascent transcript during transcriptional elongation by RNA polymerase II (RNAP II) for simplicity, but iATS could result from slowed or paused transcriptional elongation, slowed or paused splicing, or aborted transcription, with each mechanism leading to different partial nascent transcripts (Discussion). (Right) cATS nascent transcripts are detected with both intron and exon probe sets. We show one complete nascent transcript with the first exon, long first intron, and all downstream exons for simplicity, but cATS likely include a spectrum of partial and complete transcripts. (B) Biological models for mpk-1 ATS class frequency having a critical role in developmental gene expression. Developmental stages shown above correspond to patterns of ATS class frequency, transcriptional output, and protein expression shown below (Discussion).

Similar articles

Cited by

References

    1. Mannervik M., Nibu Y., Zhang H., Levine M., Transcriptional coregulators in development. Science 284, 606–609 (1999). - PubMed
    1. Gubb D., Intron‐delay and the precision of expression of homoeotic gene products in Drosophila. Dev. Genet. 7, 119–131 (1986).
    1. Shermoen A. W., O’Farrell P. H., Progression of the cell cycle through mitosis leads to abortion of nascent transcripts. Cell 67, 303–310 (1991). - PMC - PubMed
    1. Adelman K., Lis J. T., Promoter-proximal pausing of RNA polymerase II: Emerging roles in metazoans. Nat. Rev. Genet. 13, 720–731 (2012). - PMC - PubMed
    1. Jonkers I., Lis J. T., Getting up to speed with transcription elongation by RNA polymerase II. Nat. Rev. Mol. Cell Biol. 16, 167–177 (2015). - PMC - PubMed

Publication types

MeSH terms

Substances

LinkOut - more resources