. 2020 Oct 8;11(1):5077.
doi: 10.1038/s41467-020-18916-5.

Single-cell RNA sequencing highlights the role of inflammatory cancer-associated fibroblasts in bladder urothelial carcinoma

Affiliations

Single-cell RNA sequencing highlights the role of inflammatory cancer-associated fibroblasts in bladder urothelial carcinoma

Zhaohui Chen et al. Nat Commun. .

Abstract

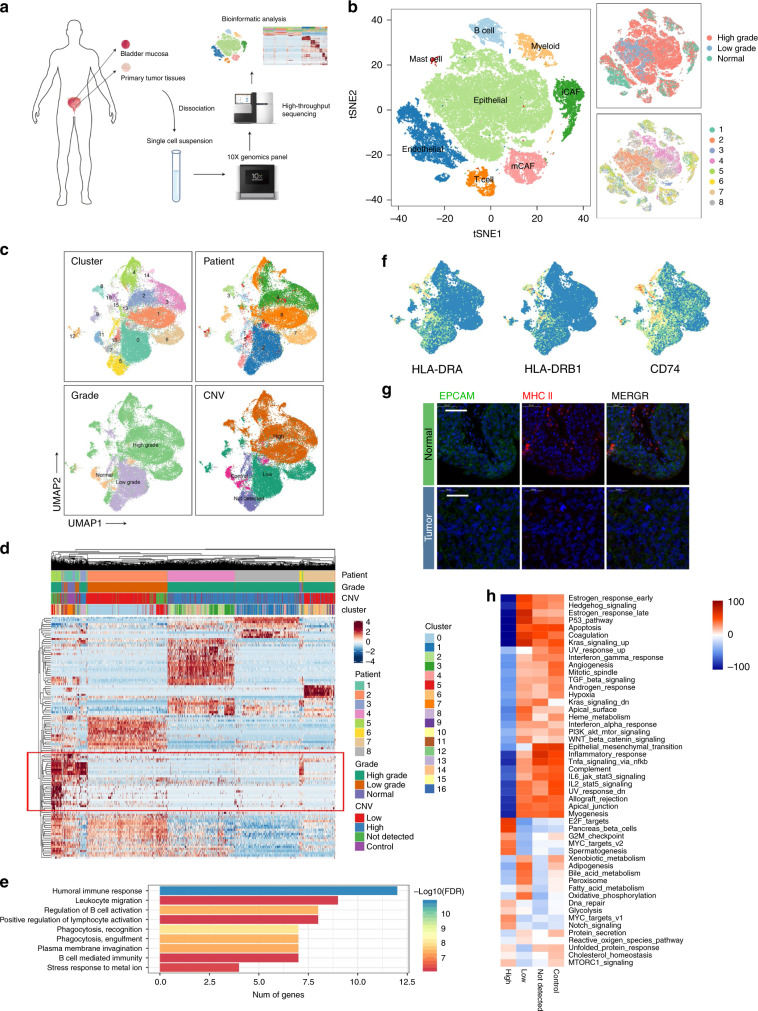
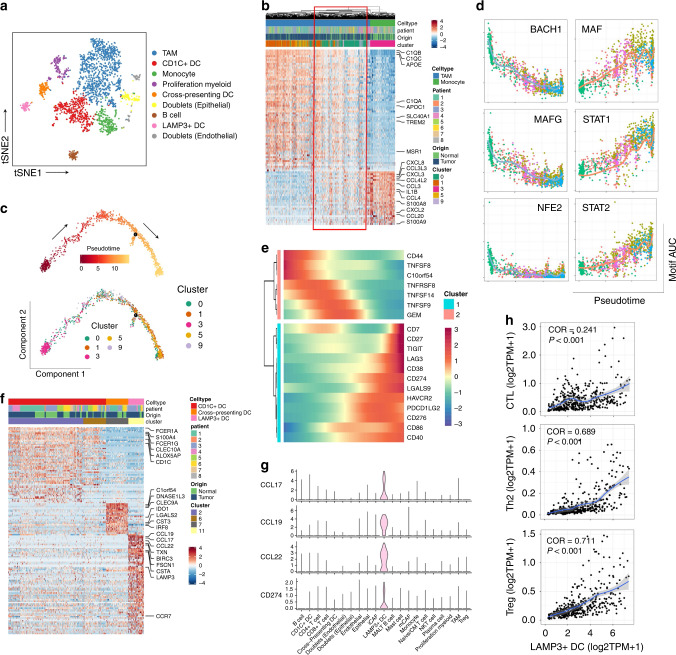
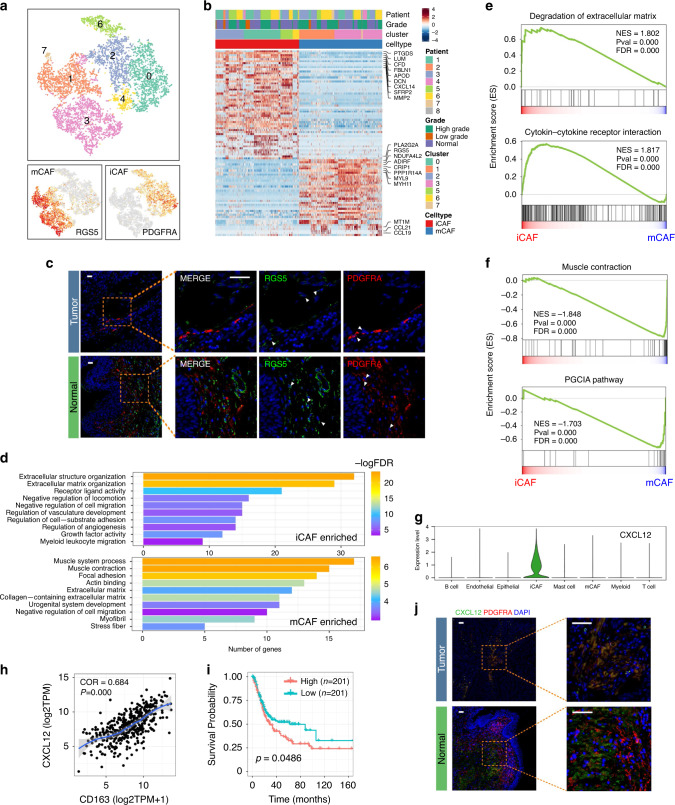
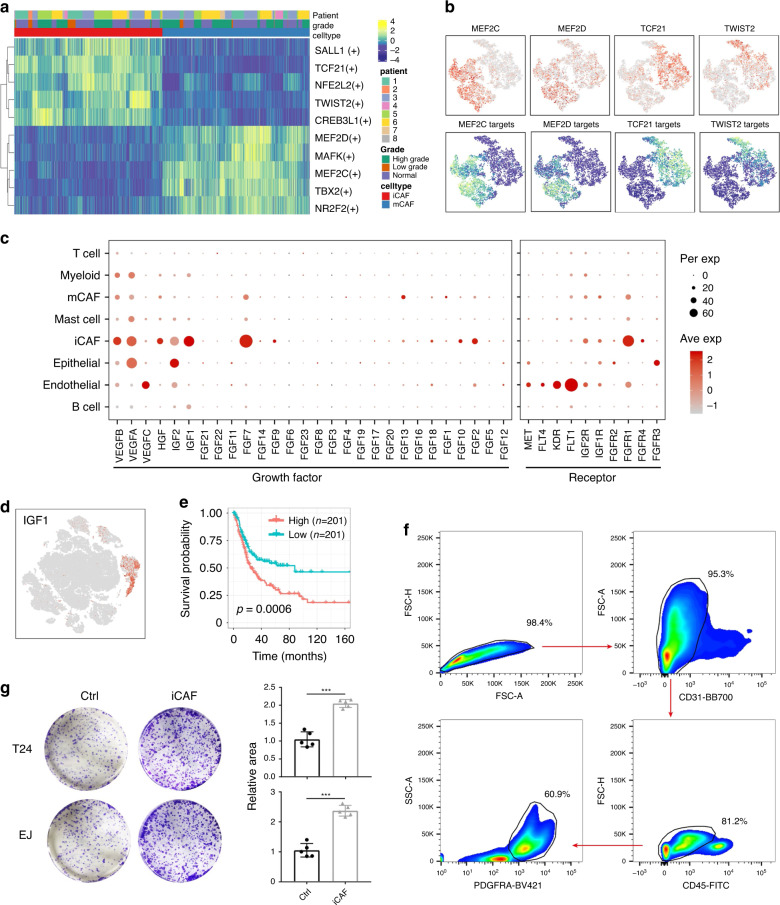
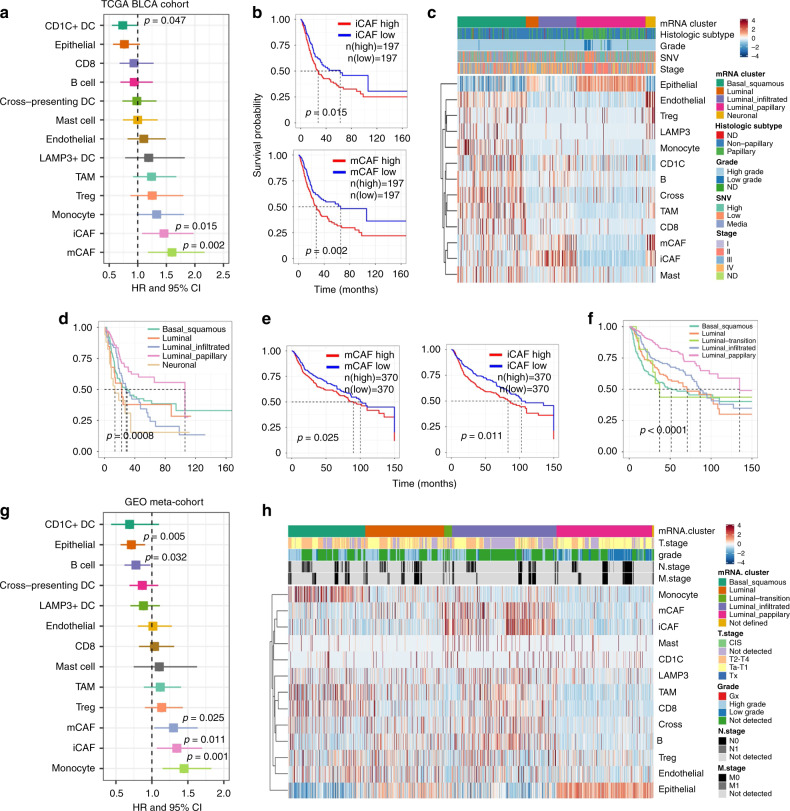
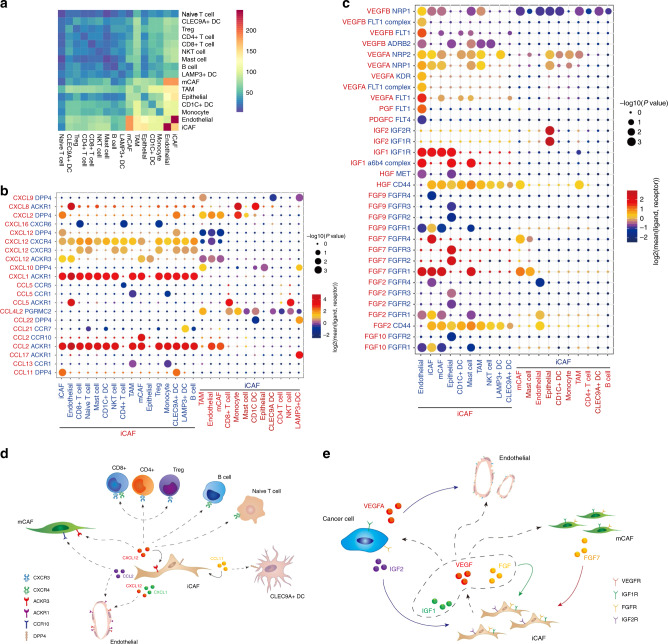
Although substantial progress has been made in cancer biology and treatment, clinical outcomes of bladder carcinoma (BC) patients are still not satisfactory. The tumor microenvironment (TME) is a potential target. Here, by single-cell RNA sequencing on 8 BC tumor samples and 3 para tumor samples, we identify 19 different cell types in the BC microenvironment, indicating high intra-tumoral heterogeneity. We find that tumor cells down regulated MHC-II molecules, suggesting that the downregulated immunogenicity of cancer cells may contribute to the formation of an immunosuppressive microenvironment. We also find that monocytes undergo M2 polarization in the tumor region and differentiate. Furthermore, the LAMP3 + DC subgroup may be able to recruit regulatory T cells, potentially taking part in the formation of an immunosuppressive TME. Through correlation analysis using public datasets containing over 3000 BC samples, we identify a role for inflammatory cancer-associated fibroblasts (iCAFs) in tumor progression, which is significantly related to poor prognosis. Additionally, we characterize a regulatory network depending on iCAFs. These results could help elucidate the protumor mechanisms of iCAFs. Our results provide deep insight into cancer immunology and provide an essential resource for drug discovery in the future.


Conflict of interest statement

The authors declare no competing interests.

Figures

Fig. 1
Fig. 1. Identifying infiltrated cell types in BC and non-malignant tissues.
a, b Identifying infiltrated cell types in BC and non-malignant tissues. a Workflow of the sample preparation, sequencing and bioinformatic analysis. b tSNE plot of single cells profiled in the presenting work colored by major cell types, tumor grade and patient. ch Reclustering of EPCAM+ cells. c UMAP plot EPCAM+ cells (epithelial marker) colored by cluster, patient, grade and CNV level. d Heatmap of differentially expressed genes (DEGs) of every CNV group. e Enriched GO functions of downregulated genes in malignant cells. f Expression levels of MHC-II molecules and CD74. g Immunofluorescence (IF) staining of MHC-II molecules and EPCAM. Scale bar represents 50 μm. h Heatmap shows difference in pathway activities scored by GSVA per cell between different CNV groups. Shown are t-values from a lineal model.
Fig. 2
Fig. 2. Reclustering of myeloid-derived cells (LYZ+).
a tSNE plot of subgroups of LYZ+ single cells. b DEGs between monocytes and TAMs. Single cells in red blank show features of both groups. c Trajectory of differentiation from monocyte into TAMs predicted by monocle 2. d Significantly inhibited or activated TF motifs in the differentiation process colored by cell clusters. e Heatmap show upregulated or downregulated immune checkpoints in the differentiation process. f Heatmap of DEGs between three different DC subgroups. g Violin plot show expression level of cytokines and CD274 highly expressed in LAMP3+ DCs. h Correlation between LAMP3+ DCs and different T cell subgroups in TCGA BLCA cohort. Coefficient was calculated with spearman correlation analysis.
Fig. 3
Fig. 3. Fibroblasts in BC could be divided into two different subgroups.
a tSNE plot of fibroblasts colored by clusters (up) and subgroup markers (down). b Heatmap of DEGs between different fibroblast subgroups. c IF confirmed the existence of iCAFs and mCAFs (n = 30). Scale bar represents 50 μm. d Enriched GO functions of upregulated genes in iCAFs and mCAFs. e, f GSEA shows top enriched pathways in iCAFs (3E) and mCAFs (3F). NES denotes normalized enrichment score. g Violin plot shows expression level of CXCL12 across major cell types. h Correlation between CXCL12 level and tumor-infiltrated macrophages in TCGA BLCA cohort. Coefficient was calculated with spearman correlation analysis. i High level of CXCL12 predicted poor prognosis in TCGA BLCA cohort. Log-rank p value < 0.05 was considered as statistically significant. j IF recognized CXCL12+ iCAFs in BC tissues. iCAFs are the major derivation of CXCL12 in tumor tissues. Scale bar represents 50 μm.
Fig. 4
Fig. 4. iCAFs promote proliferation of cancer cells.
a Heatmap of the area under the curve (AUC) scores of TF motifs estimated per cell by SCENIC. Shown are top five differentially activated motifs in iCAFs and mCAFs, respectively. b tSNE plots of the expression levels of TFs (up) and AUC scores (down). c Dot plot shows the expression level of growth factors across cell types. iCAFs are the major producer of growth factors. d tSNE plot shown the expression level of IGF1. IGF1 is secreted almost only by iCAFs. e High level IGF1 represents poor overall survival in TCGA BLCA cohort. P value was calculated with log-rank test. f FACS sorting strategy of iCAFs. g Co-culture and colony formation experiment showed that iCAFs have pro-proliferation property in vitro (n = 5). Error bar: mean value ± sd. P values were determined by two-side Student’s t test. ***p < 0.001.
Fig. 5
Fig. 5. Molecular subtypes of BC were caused by heterogeneity of TME.
a Association between relative cell abundance and patient survival from TCGA BLCA cohort (COX regression analysis). b Kaplan–Meier curves for TCGA BLCA patients. P value was calculated with log-rank test. c Heatmap of cell abundance predicted per sample from TCGA BLCA cohort by CIBERSORTx. Shown are row z-score. d Kaplan–Meier survival curve for TCGA BLCA patients, grouped by molecular subtypes. e Kaplan–Meier survival curves for microarray-based meta-cohort patients. f Kaplan–Meier survival curve for microarray-based meta-cohort patients, grouped by molecular subtypes. P values of (df) were calculated with log-rank test. g Association between relative cell abundance and patient survival from microarray-based meta-cohort (COX regression). h Heatmap of cell abundance predicted per sample from microarray-based meta-cohort by CIBERSORTx. Shown are row z-score.
Fig. 6
Fig. 6. Cell–cell communication network in BC TME.
a Heatmap show number of potential ligand-receptor pairs between cell groups predicted by CellphoneDB 2. b, c Bubble plots show ligand-receptor pairs of cytokines b and growth factors c between iCAFs and other cell groups. d, e Predicted regulatory network centered on iCAFs.

References

    1. Antoni S, et al. Bladder cancer incidence and mortality: a global overview and recent trends. Eur. Urol. 2017;71:96–108. doi: 10.1016/j.eururo.2016.06.010. - DOI - PubMed
    1. Grayson M. Bladder cancer. Nature. 2017;551:S33. - PubMed
    1. Chen YP, et al. Genomic analysis of tumor microenvironment immune types across 14 solid cancer types: immunotherapeutic implications. Theranostics. 2017;7:3585–3594. - PMC - PubMed
    1. Robertson AG, et al. Comprehensive molecular characterization of muscle-invasive bladder cancer. Cell. 2017;171:540–556.e525. - PMC - PubMed
    1. Lambrechts D, et al. Phenotype molding of stromal cells in the lung tumor microenvironment. Nat. Med. 2018;24:1277–1289. - PubMed

Publication types

MeSH terms