. 2020 Oct 8;11(1):5060.
doi: 10.1038/s41467-020-18875-x.

In vivo CRISPR/Cas9 targeting of fusion oncogenes for selective elimination of cancer cells

Affiliations

In vivo CRISPR/Cas9 targeting of fusion oncogenes for selective elimination of cancer cells

M Martinez-Lage et al. Nat Commun. .

Abstract

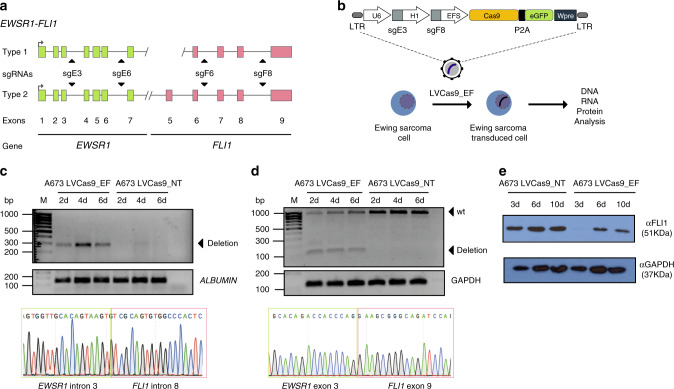
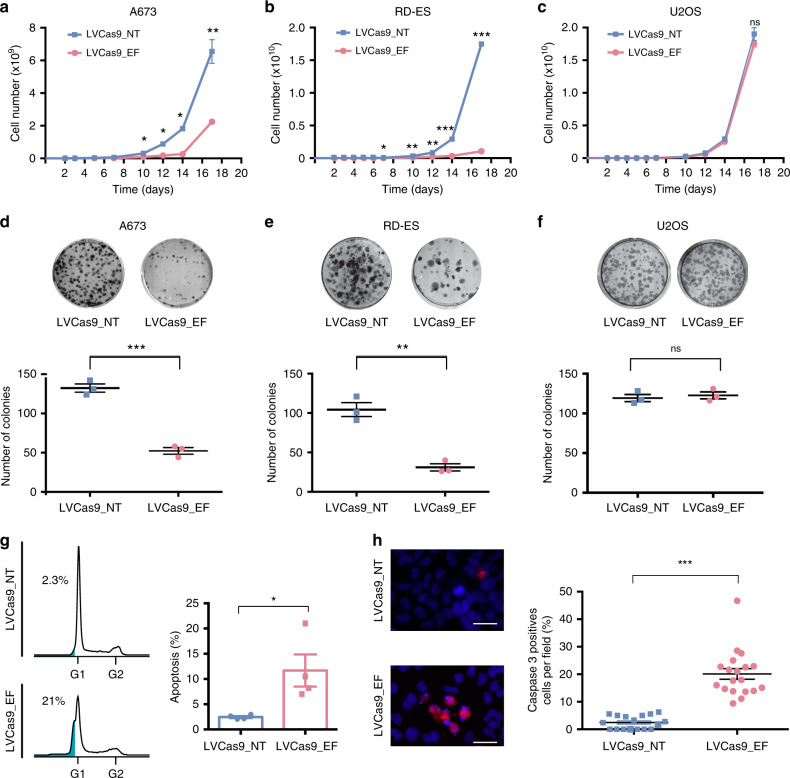
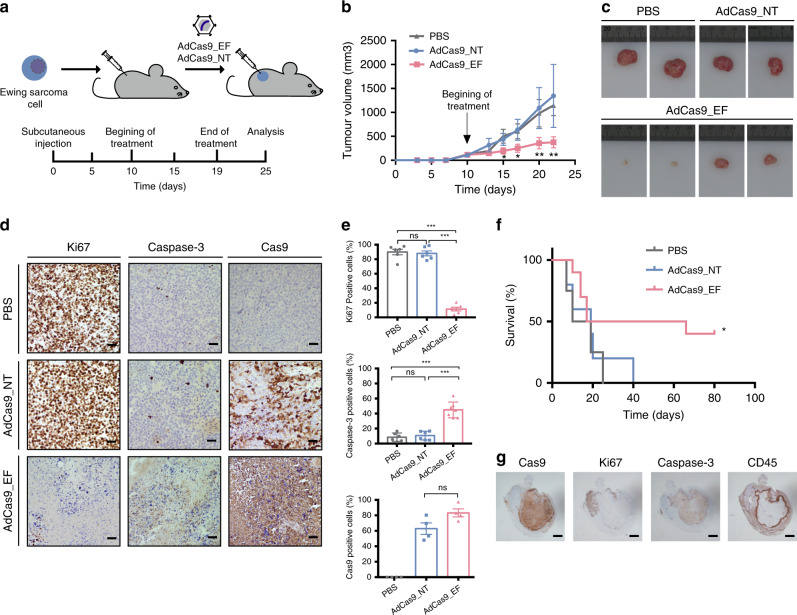
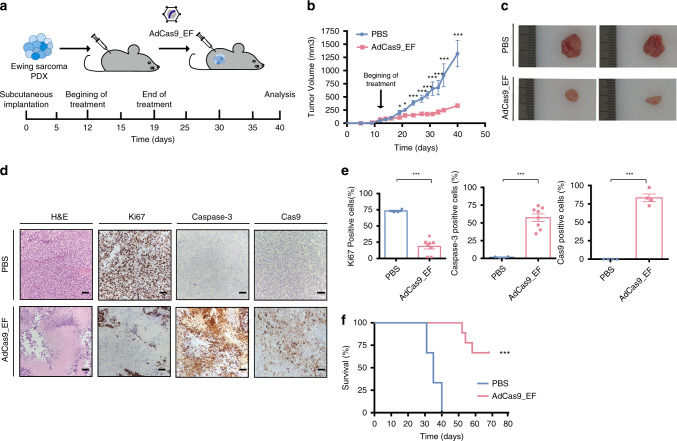
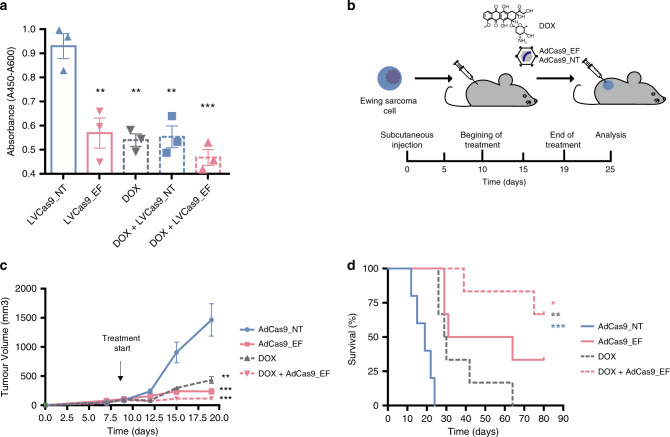
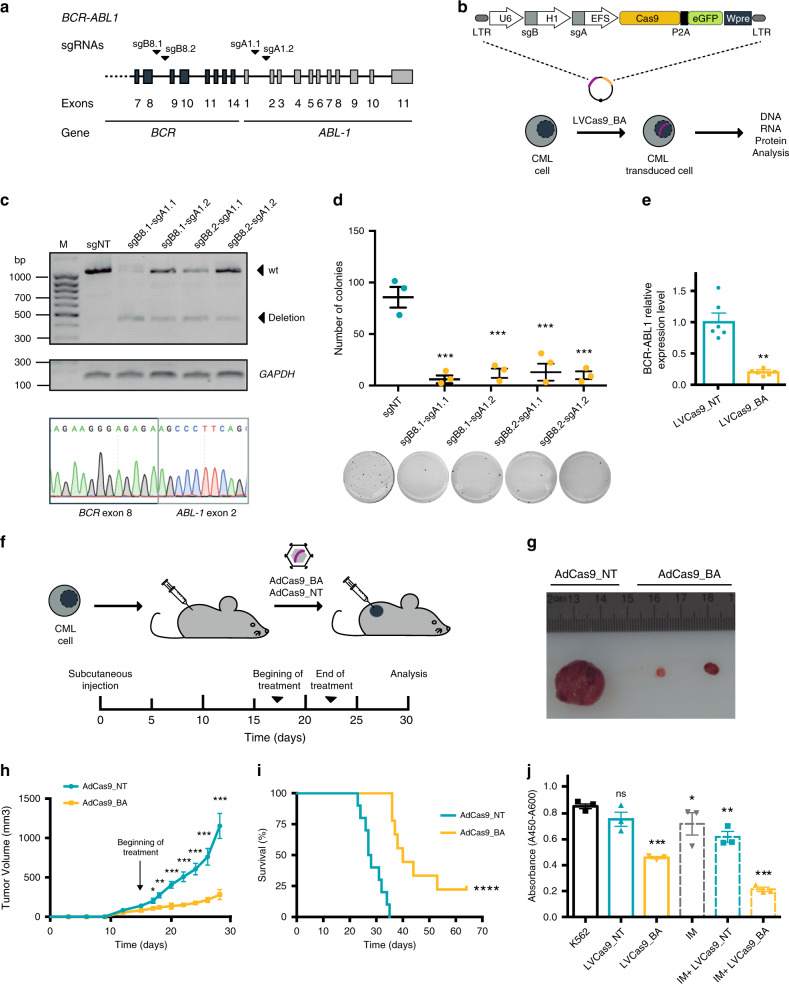
Fusion oncogenes (FOs) are common in many cancer types and are powerful drivers of tumor development. Because their expression is exclusive to cancer cells and their elimination induces cell apoptosis in FO-driven cancers, FOs are attractive therapeutic targets. However, specifically targeting the resulting chimeric products is challenging. Based on CRISPR/Cas9 technology, here we devise a simple, efficient and non-patient-specific gene-editing strategy through targeting of two introns of the genes involved in the rearrangement, allowing for robust disruption of the FO specifically in cancer cells. As a proof-of-concept of its potential, we demonstrate the efficacy of intron-based targeting of transcription factors or tyrosine kinase FOs in reducing tumor burden/mortality in in vivo models. The FO targeting approach presented here might open new horizons for the selective elimination of cancer cells.


Conflict of interest statement

A patent has been filed relating to the data presented in this research study by S.R-P., R.T-R. and M.M-L. (EP18382746.8). The remaining authors declare no competing interests.

Figures

Fig. 1
Fig. 1. Strategy and in vitro CRISPR-mediated disruption of EWSR1-FLI1.
a Scheme representing type 1 and 2 EWSR1-FLI1 FOs, illustrating the genomic structure with exon arrangement and sites of fusion. sgRNAs targeting introns 3 and 6 of EWSR1 and 6 and 8 of FLI1 are indicated. b Schematic representation of the all-in-one lentiviral vector for simultaneous expression of two sgRNAs, Cas9 and eGFP regulated by the U6, H1, and EFS promoters. c, Genomic PCR analysis of edited and control A673 cells using oligonucleotides flanking the DNA targeted by sgE3 and sgF8 (n = 3, independent studies). The 300 bp PCR product denotes deletion of the DNA fragment between the loci targeted by sgE3 and sgF8. PCR analysis was performed on extracted DNA of cells at day 2, 4, and 6 post-transduction (pt). ALBUMIN was used as an internal control of the PCR reaction. Bottom panel shows a representative Sanger sequencing chromatogram of the PCR products. d RT-PCR products from edited and control A673 Ewing sarcoma cells (n = 3, independent studies). Analysis was done using extracted RNA of cells at day 2, 4, and 6 pt. Arrows depict the sizes of wild-type (961 bp) and deleted (150 bp) RT-PCR products. GAPDH was used as an internal control of the RT-PCR reaction. Bottom panel shows a representative Sanger sequencing chromatogram of RT-PCR products. e Western blotting of EWSR1-FLI1 in A673 cells. Analysis was done using total protein extracted from cells at day 3, 6, and 10 post-transfection using an antibody specific for FLI1. GAPDH was used as an internal control of the assay. LTR: Long term repeat; P2A: porcine teschovirus-1 2A self-cleaving peptide; WPRE: Virus (WHP) posttranscriptional regulatory elements.
Fig. 2
Fig. 2. CRISPR-mediated targeting of EWSR1-FLI1 inhibits in vitro cell growth.
ac Growth rate assay curves of A673 (**p = 0.01), RD-ES (***p = 0.0005) and U2OS edited (LVCas9_EF) and control (LVCas9_NT) cells. (n = 6 independent experiments). df Representative crystal violet staining of A673 (***p = 0.0003), RD-ES (**p = 0.0017) and U2OS experimental and control cells. Bottom panels show the statistical analysis of the number of colonies. (n = 3 independent experiments). g Left panel shows DNA profile analysis by propidium iodide staining and flow cytometry. FlowJo v10.0.7 flow cytometry analysis of DNA fragmentation by subG1 population (cells with fragmented DNA) quantification. The percentage of cellular apoptosis was calculated using the percentage of the subG1 peak. Right panel shows graphical representation of subG1 analysis. (n = 4 independent experiments) *p = 0.027. h Representative images of caspase-3-immunostained A673 cells. Scale bars, 50 μm. Right panel shows the percentage of caspase-3-positive cells per field analyzed. (n = 520 (LVCas9_NT) and n = 613 (LVCas9-EF) cells examined over three independent experiments), ***p = 1.07e-9. The error bars indicate the s.e.m. for the averages across the multiple experiments; p-values are represented (ns non-significant; *p ≤ 0.05; **p ≤ 0.01; ***p ≤ 0.001). Statistical are two-tailed unpaired t-test.
Fig. 3
Fig. 3. Deletion of EWSR1-FLI1 inhibits tumor growth in xenografted models.
a Diagram showing the approach for the in vivo xenograft treatment. A673 cells were subcutaneously injected into immunodeficient mice and tumors were allowed to develop (~150 mm3 in size). Tumors were then injected with AdCas9_EF edition vector, AdCas9_NT control vector or PBS at days 10, 13, 16, and 19. Mice were sacrificed when tumor volume reached 1500 mm3. b Tumor growth over 23 days of analysis. (PBS n = 6; AdCas9_NT n = 6; AdCas9_EF n = 15 animals), **p = 0.004. c Images of representative tumors. d Representative immunostaining for Ki-67, caspase-3 and Cas9 in A673 experimental and control tumors (n = 3 independent samples). Scale bars, 50 μm. e Statistical analysis of the percentage of Ki-67- (PBS vs AdCas9_EF ***p = 1e-8, AdCas9_NT vs AdCas9_EF ***p = 6e-9), caspase-3- (PBS vs AdCas9_EF ***p = 1e-5, AdCas9_NT vs AdCas9_EF ***p = 5e-5) and Cas9-positive cells. f Kaplan–Meier survival curve comparing mice treated with experimental and control AdV or PBS. (PBS n = 4; AdCas9_NT n = 5; AdCas9_EF n = 10 animals), *p = 0.046. g Representative immunostaining for Cas9, Ki-67, caspase-3, and CD45 in an AdCas9_EF-treated xenografted tumor. The error bars indicate the s.e.m. for the averages across the multiple experiments; p-values are represented (ns non-significant; *p ≤ 0.05; **p ≤ 0.01; ***p ≤ 0.001). A two-tailed unpaired t-test was used for statistical analysis of b, d, and log-rank test for f.
Fig. 4
Fig. 4. Deletion of EWSR1-FLI1 inhibits tumor growth in PDX models.
a Diagram showing the approach for the AdV-based in vivo treatment. PDXs were implanted into immunosuppressed mice and tumors were allowed to develop (~150 mm3 in size). Tumors were then injected with AdCas9_EF edition vector or PBS control vector at days 12, 14, 16, and 19. Mice were sacrificed when tumor volume reached 1500 mm3. b Tumor growth over the 40 days following subcutaneous PDX implantation. (PBS n = 3; AdCas9_sgEF n = 9 animals) (***p = 3e-5). c Representative tumors of control and experimental mice sacrificed 40 days after PDX implantation. d Representative images of histological H&E staining, Ki-67, caspase-3, and Cas9 immunostaining of A673 experimental and control cells. Scale bars, 500 μm (4×) or 50 μm (20×). e Percentage of Ki-67-(***p = 3e-6), caspase-3-(***p = 3e-5) and Cas9-positive cells per field analyzed (***p = 4e-6). (n = 3 independent samples). f Kaplan–Meier survival curve comparing mice treated with experimental and control AdV. (PBS n = 3; AdCas9_sgEF n = 9 animals), ***p = 0.0002. Plot shows medians and ranges; error bars indicate the s.e.m. for the averages across the multiple experiments; p-values are represented (*p ≤ 0.05, **p ≤ 0.01, ***p ≤ 0.001). A two-tailed unpaired t-test was used for statistical analysis of b, e, and log-rank test for f.
Fig. 5
Fig. 5. Combined approach of EWSR1-FLI1 deletion with doxorubicin inhibits tumor growth in xenograft models.
a WST-1 cell proliferation analysis of A673 cell treated with CRISPR-deletion or doxorubicin as monotherapy, or as combined therapy and controls (n = 3 independent experiments) (LVCas9_NT vs LVCas9_EF **p = 0.01, LVCas9_NT vs Dox **p = 0.002, LVCas9_NT vs Dox + LVCas9_NT **p = 0.005, LVCas9_NT vs Dox + LVCas9_EF ***p = 0.0001). b Diagram showing the approach for the in vivo xenograft treatment. A673 cells were subcutaneously injected into immunodeficient mice and tumors were allowed to develop (~150 mm3 in size). Tumors were then injected with AdCas9_EF edition vector, doxorubicin (DOX), AdCas9_NT control vector or their combination at days 9, 12, 15, and 18. Mice were sacrificed when tumor volume reached 1500 mm3. c Tumor growth over the 19 days following subcutaneous cells implantation. (AdCas9_NT n = 5; AdCas9_sgEF n = 6; DOX n = 6, DOX + AdCas9_EF n = 6 animals) (AdCas9_NT vs DOX **p = 0.003, AdCas9_NT vs AdCas9_EF ***p = 9e-4, AdCas9_NT vs DOX + AdCas9_EF ***p = 5e-4). d Kaplan–Meier survival curve comparing mice treated with CRISPR-deletion or DOX as monotherapy, or as combined therapy and controls. (AdCas9_NT n = 5; AdCas9_sgEF n = 6; DOX n = 6, DOX + AdCas9_EF n = 6 animals) (DOX + AdCas9_EF vs AdCas9_EF *p = 0.035, DOX + AdCas9_EF vs DOX **p = 0.003, DOX + AdCas9_EF vs AdCas9_NT ***p = 0.0007). Plot shows medians and ranges; error bars indicate the s.e.m. for the averages across the multiple experiments; p-values are represented (*p ≤ 0.05, **p ≤ 0.01, ***p ≤ 0.001). A two-tailed unpaired t-test was used for statistical analysis of a, c, and Log-rank test for d.
Fig. 6
Fig. 6. Strategy validation in CML-initiating BCR-ABL model.
a Schematic representation of the BCR-ABL1 locus showing the sgRNAs targeting introns 8 of BCR and 1 of ABL1. b Schematic illustration of the vector and the approach for in vitro treatment. c Agarose gel electrophoresis of BCR-ABL RT-PCR products obtained from experimental and control K562 cells electroporated with four combinations of sgRNAs. RT-PCR analysis was done using RNA extracted from cells at day 2 post-nucleofection. Arrows depict the sizes of wild-type (1125 bp) and deleted (458 bp) RT-PCR products. GAPDH was used as an internal control of the RT-PCR reaction. Bottom panel shows a representative chromatogram of Sanger sequencing analysis of the RT-PCR products. d, Representative images and graphical representation of colony formation of K562 experimental and control cells (stained with nitrotetrazolium blue). (n = 3 independent experiments). sgNT vs sgB8.1-agA1.1 ***p = 3e-10, sgNT vs sgB8.1-agA1.2 ***p = 5e-4, sgNT vs sgB8.2-sgA1.1 ***p = 3e-4, sgNT vs sgB8.2-agA1.2 ***p = 1e-4. e BCR1-ABL expression level analysis. Relative expression level of BCR-ABL1 in control (LVCas9_NT) and treated (LVCas9_EF) K562 cells measured by qRT-PCR and normalized to GUSB (n = 6 independent experiments, **p = 0.0020). f Diagram of xenograft production, adenoviral treatment and tumor growth over the 30 days following subcutaneous cell injection and four in vivo adenoviral treatments. (AdCas9_NT n = 10; AdCAas9_sgBA n = 10). g Representative tumors of control and experimental mice. h Tumor growth curve over the 28 days of study. (AdCas9_NT n = 10; AdCas9_sgBA n = 10, ***p = 3e-4). i Kaplan–Meier survival curve comparing mice treated with experimental and control adenoviral vectors (AdCas9_NT n = 10; AdCas9_sgBA n = 10 animals, ****p < 0.0001). j WST-1 cell proliferation analysis of K562 cell treated with CRISPR-deletion or imatinib (IM) as monotherapy, or as combined therapy and controls (n = 3 independent experiments), K562 vs LVCas9_BA ***p = 3.9e-5, K562 vs IM *p = 0.043, K562 vs IM + LVCas9_NT **p = 0.006, K562 vs IM + LVCas9_BA ***p = 4e-6. Plot shows medians and ranges; error bars indicate the s.e.m. for the averages across the multiple experiments; p-values are represented (*p ≤ 0.05, **p ≤ 0.01, ***p ≤ 0.001). A two-tailed unpaired t-test was used for statistical analysis of d, e, h and j, and Log-rank test for i.

Similar articles

Cited by

References

    1. Hsu PD, Lander ES, Zhang F. Development and applications of CRISPR-Cas9 for genome engineering. Cell. 2014;157:1262–1278. doi: 10.1016/j.cell.2014.05.010. - DOI - PMC - PubMed
    1. Lu H, et al. Engineering and functional characterization of fusion genes identifies novel oncogenic drivers of cancer. Cancer Res. 2017;77:3502–3512. doi: 10.1158/0008-5472.CAN-16-2745. - DOI - PMC - PubMed
    1. Rabbitts TH. Chromosomal translocations in human cancer. Nature. 1994;372:143–149. doi: 10.1038/372143a0. - DOI - PubMed
    1. Rodriguez-García A, et al. Selective destruction of tumor cells through specific inhibition of products resulting from chromosomal translocations. Curr. Cancer Drug Targets. 2001;1:109–119. doi: 10.2174/1568009013334214. - DOI - PubMed
    1. Thomas M, Greil J, Heidenreich O. Targeting leukemic fusion proteins with small interfering RNAs: recent advances and therapeutic potentials. Acta Pharmacol. Sin. 2006;27:273–281. doi: 10.1111/j.1745-7254.2006.00282.x. - DOI - PubMed

Publication types

MeSH terms

Substances