. 2020 Oct 8;11(1):5064.
doi: 10.1038/s41467-020-18848-0.

SARS-CoV-2 exposure, symptoms and seroprevalence in healthcare workers in Sweden

Affiliations

SARS-CoV-2 exposure, symptoms and seroprevalence in healthcare workers in Sweden

Ann-Sofie Rudberg et al. Nat Commun. .

Abstract

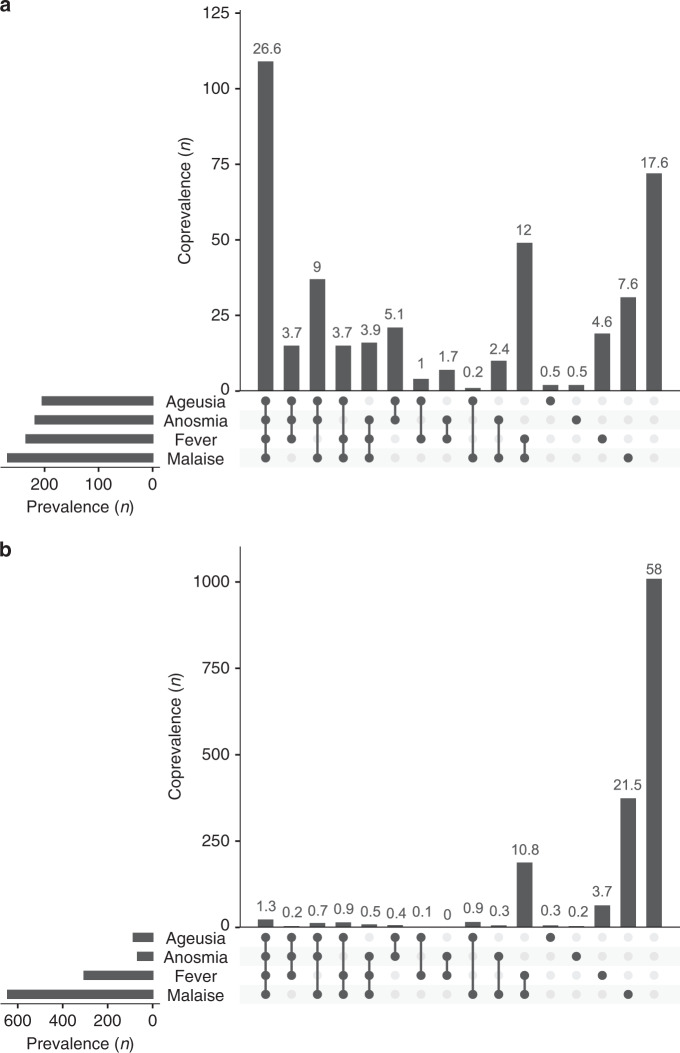
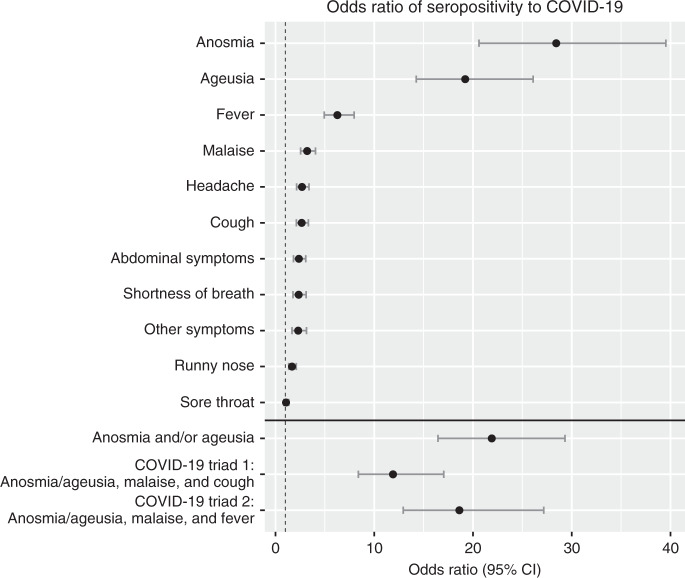
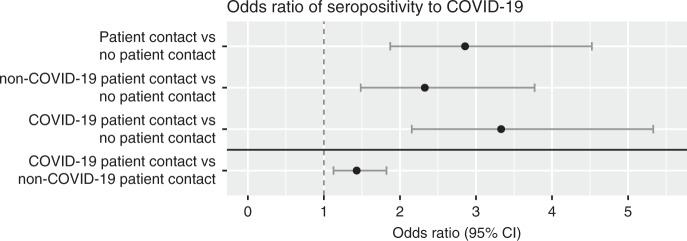
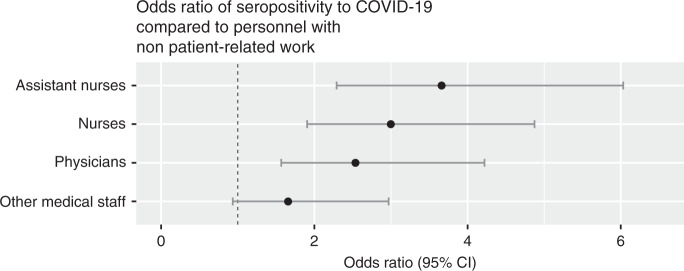
SARS-CoV-2 may pose an occupational health risk to healthcare workers. Here, we report the seroprevalence of SARS-CoV-2 antibodies, self-reported symptoms and occupational exposure to SARS-CoV-2 among healthcare workers at a large acute care hospital in Sweden. The seroprevalence of IgG antibodies against SARS-CoV-2 was 19.1% among the 2149 healthcare workers recruited between April 14th and May 8th 2020, which was higher than the reported regional seroprevalence during the same time period. Symptoms associated with seroprevalence were anosmia (odds ratio (OR) 28.4, 95% CI 20.6-39.5) and ageusia (OR 19.2, 95% CI 14.3-26.1). Seroprevalence was also associated with patient contact (OR 2.9, 95% CI 1.9-4.5) and covid-19 patient contact (OR 3.3, 95% CI 2.2-5.3). These findings imply an occupational risk for SARS-CoV-2 infection among healthcare workers. Continued measures are warranted to assure healthcare workers safety and reduce transmission from healthcare workers to patients and to the community.


Conflict of interest statement

The authors declare no competing interests.

Figures

Fig. 1
Fig. 1. Symptomatology.
Symptomatology in seropositive (a; n = 410) and seronegative (b, n = 1739) individuals. Horizontal bars to the left represent the total number of participants in each group reporting the specifically denoted symptom. Vertical bars show the total number of participants in each group reporting symptoms symbolized with black dot(s) in the corresponding column. The percentage of participants reporting symptoms symbolized with black dot(s) in the corresponding column is presented above the bars. Source data are available as Source Data file.
Fig. 2
Fig. 2. Associations between prior symptoms and seroprevalence of SARS-CoV 2 IgG antibodies.
Odds ratios of seropositivity for individually reported symptoms. Odds ratios were calculated using two-sided Fisher’s exact test with n = 2149 independent individuals. No adjustment for multiple comparisons was applied. Data are presented as odds ratios and 95% confidence intervals. Source data are available as Source Data file.
Fig. 3
Fig. 3. Association between occupational exposure and seroprevalence of SARS-CoV 2 IgG antibodies.
Odds ratios of seropositivity given patient contact, non-COVID-19 patient contact, or COVID-19 patient contact compared to no patient contact, and (under the horizontal black line) given COVID-19 patient contact compared to non-COVID-19 patient contact. Odds ratios were calculated using two-sided Fisher’s exact test with n = 2149 (patient contact vs no patient contact), n = 1107 (non-COVID-19 patient contact vs no patient contact), n = 1267 (COVID-19 patient contact vs no patient contact), and n = 1764 (COVID-19 patient contact vs non-COVID-19 patient contact) independent individuals. No adjustment for multiple comparisons was applied. Data are presented as odds ratios and 95% confidence intervals. Source data are available as Source Data file.
Fig. 4
Fig. 4. Associations between occupations and seroprevalence of SARS-CoV 2 IgG antibodies among HCW with patient contact.
Odds ratios of seropositivity for groups of HCW with patient contact, compared to personnel without patient contact. Odds ratios were calculated using two-sided Fisher’s exact test with n = 733 (assistant nurses vs no patient contact), n = 941 (nurses vs no patient contact), n = 744 (physicians vs no patient contact), and n = 559 (other medical staff vs no patient contact) independent plasma samples. No adjustment for multiple comparisons was applied. Data are presented as odds ratios and 95% confidence intervals. Source data are available as Source Data file.

Similar articles

Cited by

References

    1. Organization WH. Coronavirus disease 2019 (COVID-19): situation report-63. https://www.who.int/docs/default-source/coronaviruse/situation-reports/2... (2020)
    1. Folkhälsomyndigheten. https://www.folkhalsomyndigheten.se/smittskydd-beredskap/utbrott/aktuell... (2020)
    1. Salje, H. et al. Estimating the burden of SARS-CoV-2 in France. Science369, 208–211 (2020). - PMC - PubMed
    1. Sood, N. Seroprevalence of SARS-CoV-2-specific antibodies among adults in Los Angeles County, California, on April 10-11, 2020. JAMA323, 2425–24270 (2020). - PMC - PubMed
    1. Varia M, et al. Hospital Outbreak Investigation T. Investigation of a nosocomial outbreak of severe acute respiratory syndrome (SARS) in Toronto, Canada. CMAJ. 2003;169:285–292. - PMC - PubMed

Publication types

MeSH terms