

A cross-country database of COVID-19 testing
- PMID: 33033256
- PMCID: PMC7545176
- DOI: 10.1038/s41597-020-00688-8
A cross-country database of COVID-19 testing
Abstract
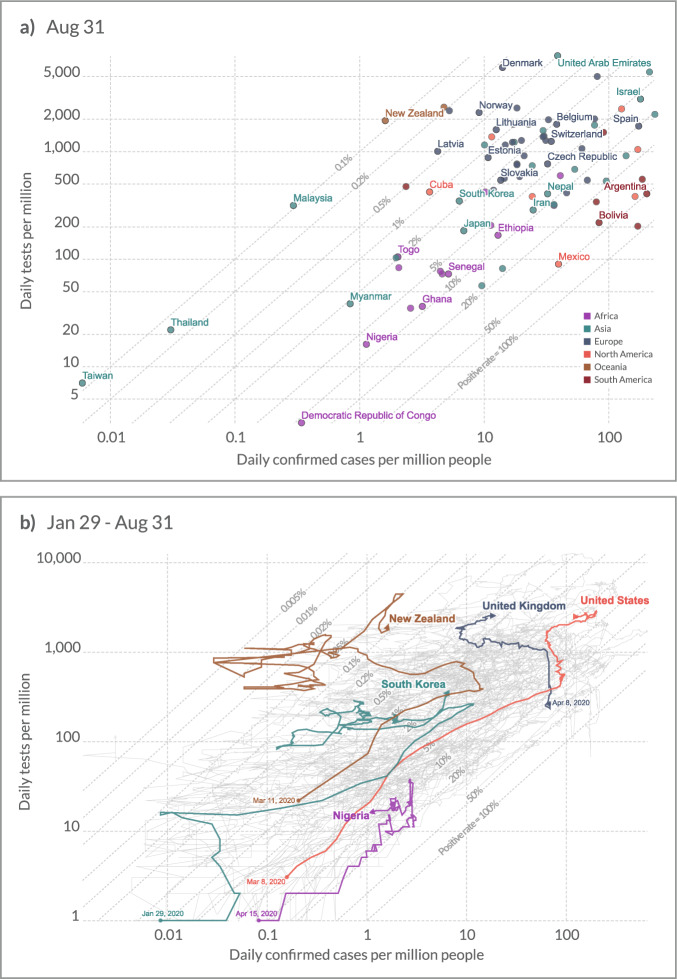
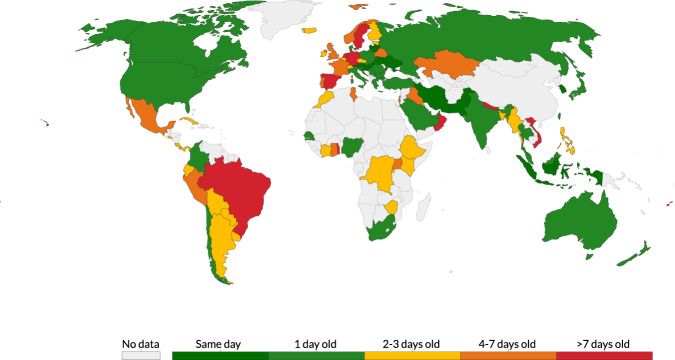
Our understanding of the evolution of the COVID-19 pandemic is built upon data concerning confirmed cases and deaths. This data, however, can only be meaningfully interpreted alongside an accurate understanding of the extent of virus testing in different countries. This new database brings together official data on the extent of PCR testing over time for 94 countries. We provide a time series for the daily number of tests performed, or people tested, together with metadata describing data quality and comparability issues needed for the interpretation of the time series. The database is updated regularly through a combination of automated scraping and manual collection and verification, and is entirely replicable, with sources provided for each observation. In providing accessible cross-country data on testing output, it aims to facilitate the incorporation of this crucial information into epidemiological studies, as well as track a key component of countries' responses to COVID-19.
Conflict of interest statement
The authors declare no competing interests.
Figures
References
-
- Onder G, Rezza G, Brusaferro S. Case-Fatality Rate and Characteristics of Patients Dying in Relation to COVID-19 in Italy. JAMA. 2020;323:1775–1776. - PubMed
-
- WHO Global. Advice on the use of point-of-care immunodiagnostic tests for COVID-19: scientific brief. WHO Reference No. WHO/2019-nCoV/Sci_Brief/POC_immunodiagnostics/2020.1 (WHO, 2020).
Publication types
MeSH terms
LinkOut - more resources
Full Text Sources
Medical
