. 2020 Oct 8;11(1):5070.
doi: 10.1038/s41467-020-18843-5.

Prostate cancer evolution from multilineage primary to single lineage metastases with implications for liquid biopsy

Affiliations

Prostate cancer evolution from multilineage primary to single lineage metastases with implications for liquid biopsy

D J Woodcock et al. Nat Commun. .

Abstract

The evolutionary progression from primary to metastatic prostate cancer is largely uncharted, and the implications for liquid biopsy are unexplored. We infer detailed reconstructions of tumor phylogenies in ten prostate cancer patients with fatal disease, and investigate them in conjunction with histopathology and tumor DNA extracted from blood and cerebrospinal fluid. Substantial evolution occurs within the prostate, resulting in branching into multiple spatially intermixed lineages. One dominant lineage emerges that initiates and drives systemic metastasis, where polyclonal seeding between sites is common. Routes to metastasis differ between patients, and likely genetic drivers of metastasis distinguish the metastatic lineage from the lineage that remains confined to the prostate within each patient. Body fluids capture features of the dominant lineage, and subclonal expansions that occur in the metastatic phase are non-uniformly represented. Cerebrospinal fluid analysis reveals lineages not detected in blood-borne DNA, suggesting possible clinical utility.


Conflict of interest statement

All authors delare no competing interests.

Figures

Fig. 1
Fig. 1. Phylogenetic trees of primary and metastatic prostate cancer evolution in ten men.
Top row—patients who still had prostate in place at time of death; bottom row—patients who had undergone radical prostatectomy (A12, A17, A21, A24) or had no discernible cancer in the prostate at time of death (A34). Patient identifiers are to the right of the root node of each tree, which represents the most recent common ancestor (MRCA) of all tumor cells. Dotted lines connect the final subclone of a lineage with a letter denoting the sample or samples in which it was observed. Samples connected to multiple lines arising from different subclones indicates subclonal intermixture in the prostate and local organs, or polyclonal seeding in the periphery. Yellow filled subclones were observed in samples taken from the prostate. Other colors denote the location of sample in which the subclone was observed as indicated in the key, where subclones consisting of multiple colors indicate that the subclone was not found in the prostate, but was observed in the metastatic locations with corresponding colors. Fresh frozen samples are denoted by bold lower case letters in ascending order from a; microdissected fixed samples are standard upper case in descending order from Z. Letters are colored by sample tissue type. Samples taken from the prostate and local organs are arranged to the left or right of each tree. Samples taken from distant metastases are arranged horizontally at the bottom of each tree. Visceral (other) includes adrenal glands (A21, A22, A31), diaphragm (A24), and sigmoid colon (A24). Corresponding sample names, time of collection, cluster information and locations are given in Supplementary Figs. 1–10 and Supplementary Data 1 and 2.
Fig. 2
Fig. 2. Subclones from distinct lineages can be spatially intermixed within the prostate.
Six samples were collected across two tissue blocks from adjacent regions of the prostate. The intra-prostatic portion of the phylogenetic tree of A31 is shown, with lines denoting the final subclone of each distinct lineage found in the corresponding regions in each slide. Numbered subclones in yellow circles correspond to the clusters shown in Supplementary Fig. 8. Subclones that correspond to over 50% of tumor cells in a region are designated high proportion, all other subclones present are low proportion. Location of slides are given in Supplementary Fig. 13.
Fig. 3
Fig. 3. Multi-clonal invasion into adjacent organs and subsequent metastatic seeding in A22.
Subclones identified in each sample were considered in conjunction with the phylogenetic trees to distinguish invasive local spread, evolutionary progression, and origins of metastatic dissemination. a A compound phylogenetic/compartmental diagram where lineages can move between compartments (dotted lines, purple = local invasion, orange = distant spread) and undergo subclonal expansion (solid black lines). Compartments were Prostate, Seminal Vesicles, Bladder and Periphery as labeled. Subclones are denoted by circles colored by tissue type, with numbers corresponding to clusters in Supplementary Fig. 5. b Spread of metastatic lineage occurred first through transprostatic migration to the base of the prostate, then to seminal vesicles and then to the bladder. At least one metastatic lineage (corresponding to subclone 2) was seeded from the bladder, and lineages identified through subclones 4, 11, and 19 may have originated from either the bladder or seminal vesicles (denoted ‘origin uncertain’). An additional metastatic lineage (subclone 9) appeared to have seeded directly from the prostate.
Fig. 4
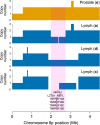
Fig. 4. Copy number alterations covering the 8p21.3-8p21.2 locus in A10.
Copy number profiles of the 8p region are shown by colored blocks, where the levels correspond to 1, 2, and 3 copies of the region, and no color indicates no copies are present. The region subject to loss of heterozygosity in all metastatic samples is highlighted in pink. Gene names of known drivers (see “Methods”) in this region are given below, with bars above detailing the corresponding genomic positions.
Fig. 5
Fig. 5. Metastasis-capable cells in multiple sites within the prostate and perineural regions in A32.
The prostate (center) was divided into 13 slices (black lines) and three regions were sampled, two from slice 10, and one from slice 6. The purple circle denotes the region that was fresh frozen and sequenced as sample c and the red circles denote regions that were ethanol/methanol fixed and paraffin embedded. Histology slides shown to left and right, with microdissected regions highlighted in cyan with adjacent sequencing sample letters. The lower pane shows the phylogenetic tree of the intra-prostatic evolution, with numbers in the circles corresponding to subclonal clusters as derived in Supplementary Fig. 9. Lines joining the miscrodissected regions to a subclonal cluster indicate the final subclone observed in each region; these are designated as high (CCF > 0.5) and low (CCF < 0.5) proportion.
Fig. 6
Fig. 6. Subclones in tissue samples can be identified in DNA obtained from liquid biopsy.
Plots showing the proportion of single nucleotide variants corresponding to each subclone (numbered on x-axis) that are observed in each sample (letters on y-axis). The area of the circle is proportional to the cancer cell fraction (CCF) of the subclone, with CCF of 1 found in the leftmost (truncal) nodes of the subplot. Anatomical location of tissue samples are also given in the sample label, and colored as in the legend. Body fluid samples are denoted by the time when the sample was taken (Aut = autopsy, dptd = the number of days prior to death), and the type of fluid (Serum; Plasma; blood, either Clotted or Whole; Cerebrospinal fluid (CSF)). Sample locations in bold are those that contain lineages represented in liquid biopsy at the highest CCF. Tissue samples in black boxes were polyclonal mixtures and contained similar subclonal CCFs to the boxed body fluid sample. Red boxes denote subclones of interest: star denotes subclones corresponding to a lineage found only in a spinal metastasis and serum, both of which were extracted 4040dptd, and dagger denotes a subclone that is only observed in a subdural metastasis and CSF.

References

    1. Ferlay J, et al. Cancer incidence and mortality patterns in Europe: estimates for 40 countries and 25 major cancers in 2018. Eur. J. Cancer. 2018;103:356–387. doi: 10.1016/j.ejca.2018.07.005. - DOI - PubMed
    1. Siegel, R. L., Miller, K. D. & Jemal, A. Cancer statistics, 2019. CA. Cancer J. Clin. 10.3322/caac.21551. (2019). - PubMed
    1. Løvf M, et al. Multifocal primary prostate cancer exhibits high degree of genomic heterogeneity. Eur. Urol. 2019;75:498–505. doi: 10.1016/j.eururo.2018.08.009. - DOI - PubMed
    1. Cooper CS, et al. Analysis of the genetic phylogeny of multifocal prostate cancer identifies multiple independent clonal expansions in neoplastic and morphologically normal prostate tissue. Nat. Genet. 2015;47:367–372. doi: 10.1038/ng.3221. - DOI - PMC - PubMed
    1. Boutros PC, et al. Spatial genomic heterogeneity within localized, multifocal prostate cancer. Nat. Genet. 2015;47:736–745. doi: 10.1038/ng.3315. - DOI - PubMed

Publication types