. 2020 Oct 8;10(1):16802.
doi: 10.1038/s41598-020-73912-5.

Neutral sphingomyelinase 2 regulates inflammatory responses in monocytes/macrophages induced by TNF-α

Affiliations

Neutral sphingomyelinase 2 regulates inflammatory responses in monocytes/macrophages induced by TNF-α

Fatema Al-Rashed et al. Sci Rep. .

Abstract

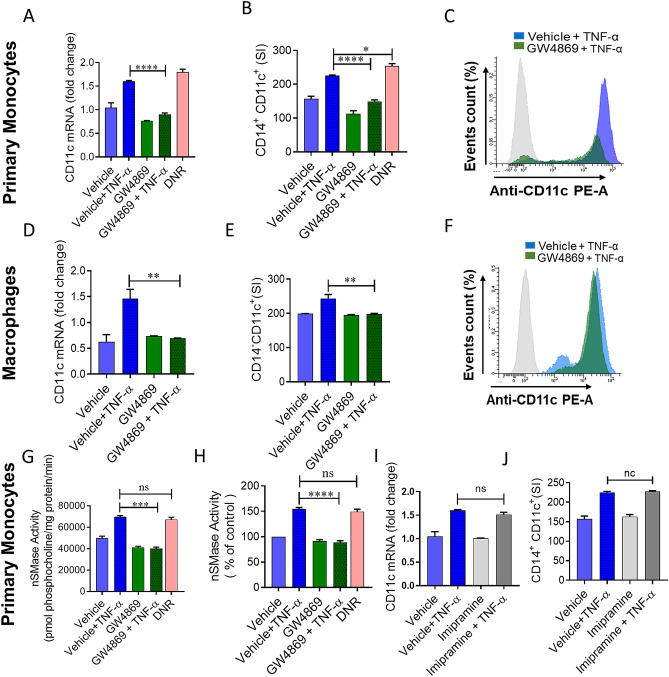
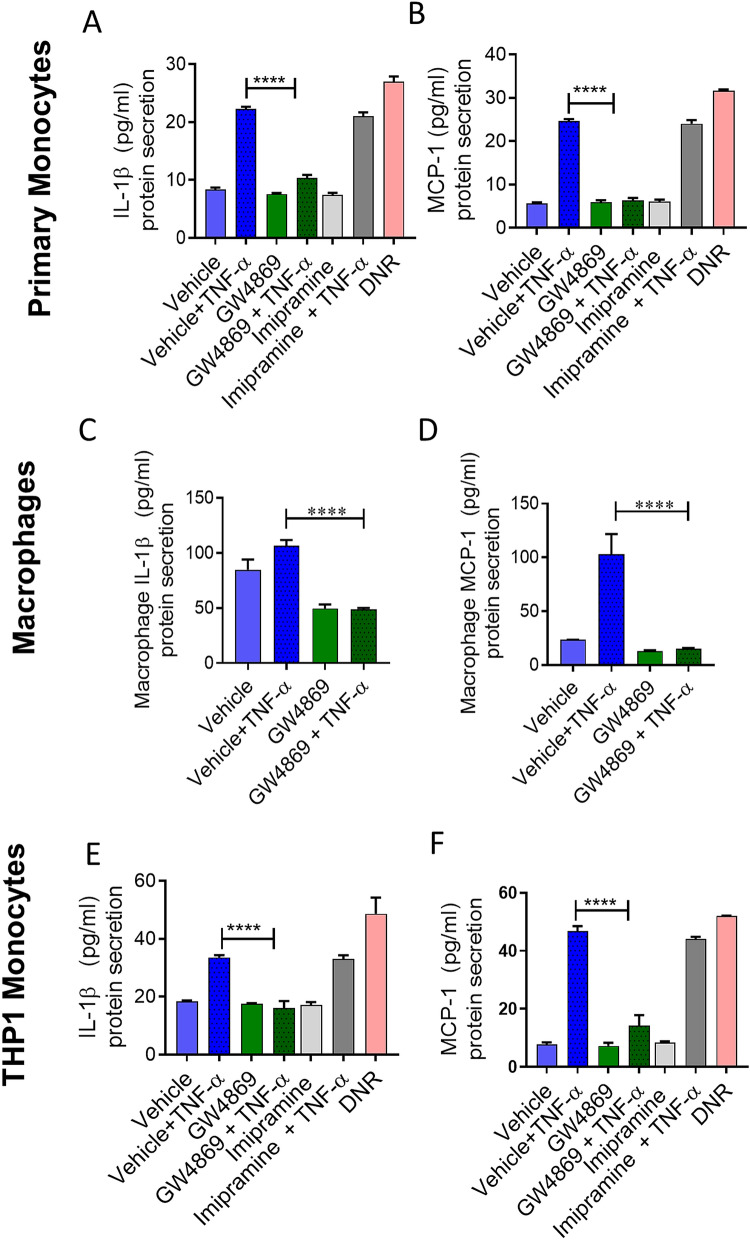
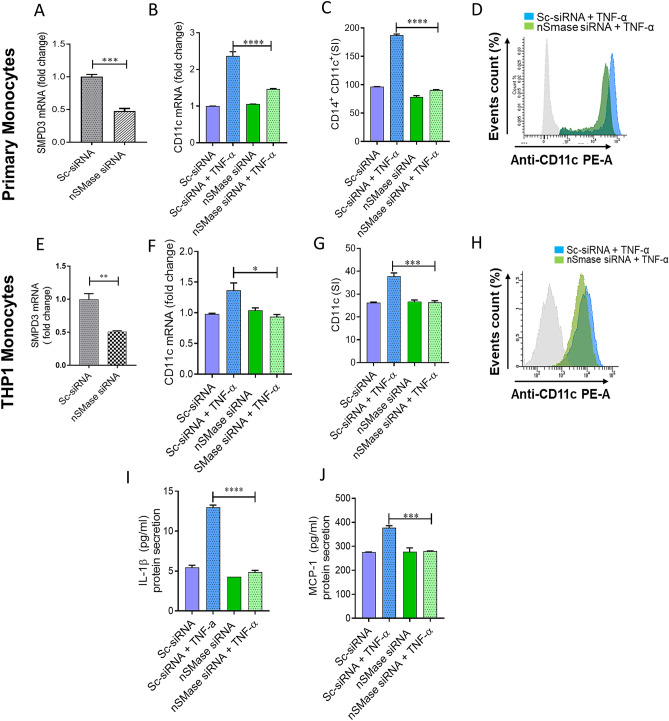
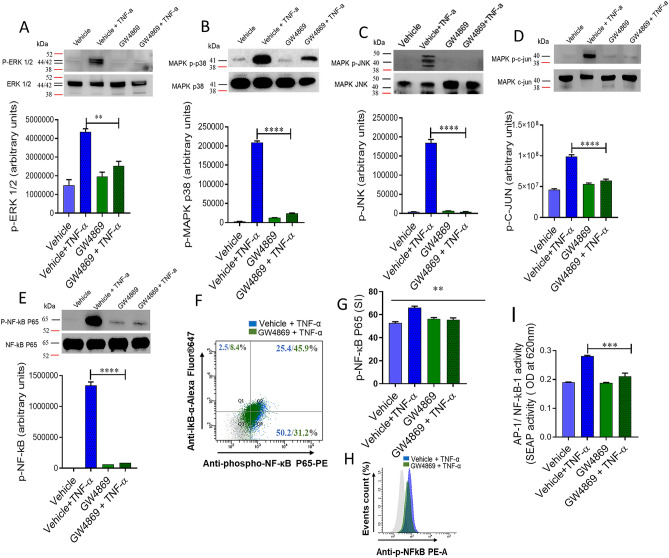
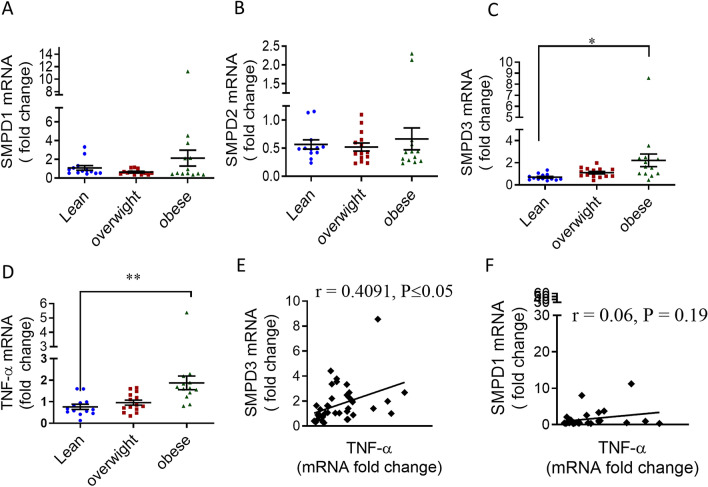
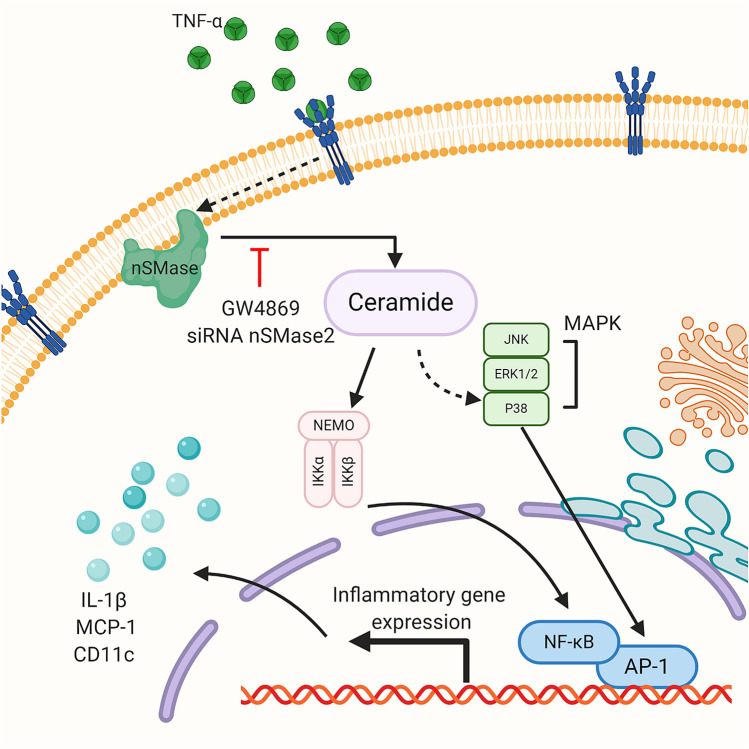
Obesity is associated with elevated levels of TNF-α and proinflammatory CD11c monocytes/macrophages. TNF-α mediated dysregulation in the plasticity of monocytes/macrophages is concomitant with pathogenesis of several inflammatory diseases, including metabolic syndrome, but the underlying mechanisms are incompletely understood. Since neutral sphingomyelinase-2 (nSMase2: SMPD3) is a key enzyme for ceramide production involved in inflammation, we investigated whether nSMase2 contributed to the inflammatory changes in the monocytes/macrophages induced by TNF-α. In this study, we demonstrate that the disruption of nSMase activity in monocytes/macrophages either by chemical inhibitor GW4869 or small interfering RNA (siRNA) against SMPD3 results in defects in the TNF-α mediated expression of CD11c. Furthermore, blockage of nSMase in monocytes/macrophages inhibited the secretion of inflammatory mediators IL-1β and MCP-1. In contrast, inhibition of acid SMase (aSMase) activity did not attenuate CD11c expression or secretion of IL-1β and MCP-1. TNF-α-induced phosphorylation of JNK, p38 and NF-κB was also attenuated by the inhibition of nSMase2. Moreover, NF-kB/AP-1 activity was blocked by the inhibition of nSMase2. SMPD3 was elevated in PBMCs from obese individuals and positively corelated with TNF-α gene expression. These findings indicate that nSMase2 acts, at least in part, as a master switch in the TNF-α mediated inflammatory responses in monocytes/macrophages.


Conflict of interest statement

The authors declare no competing interests.

Figures

Figure 1
Figure 1
nSMase inhibition blocks TNF-α mediated pro-inflammatory changes in human monocytes/macrophages. Primary monocytes were pretreated with nSMase inhibitor (GW4869: 10 µM), nSMase agonist (DNR; 1 µM) or vehicle for 1 h and then incubated with TNF-α for 2 h. Cells were harvested, and mRNA of CD11c was determined by real time RT-PCR (A). After 6 h treatment with TNF-α, cells were stained with antibodies against CD14 and CD11c along with matched isotype controls. Surface expression of CD14+CD11c+ was assessed by flow cytometry, (B) data are presented as a bar graph of mean staining index, and (C) representative histogram. Macrophages derived from monocytes were pre-incubated with (GW4869: 10 µM) for 1 h and then treated with TNF-α. (D) CD11c mRNA expression and (E,F) surface expression of CD14+CD11c+ were assessed by flow cytometry. Monocytic cells (Primary monocytes) were pretreated with nSMase inhibitor (GW4869: 10 µM) or vehicle for 1 h and then incubated with TNF-α for 10 min. (G) nSMase activity measured in in equal amount of protein (20 µg); (H) nSMase activity as percentage of expression to vehicle. Primary monocytes were pretreated with aSMase inhibitor (lim: 10 µM) or vehicle for 1 h and then incubated with TNF-α for 2 h or 6 h. (I and J) Cells were harvested, and mRNA of CD11c and surface expression of CD14+CD11c+ cells were determined. Unstimulated cells were used as controls for different treatments. The results obtained from minimum three independent experiments with three replicates of each experiment are shown. All data are expressed as mean ± SEM (n ≥ 3). *p ≤ 0.05, **p ≤ 0.01, ***p ≤ 0.001, ****p ≤ 0.0001 versus vehicle.
Figure 2
Figure 2
IL-1β and MCP-1 secreted by TNF-α activated monocytes are suppressed by nSMase inhibition. Monocytic cells (primary monocytes, macrophages, THP-1 cells) were pretreated with nSMase inhibitor (GW4869: 10 µM), nSMase agonist (DNR: 1 µM), aSMase inhibitor (imipramine: 10 µM) or vehicle for 1 h and then incubated cells with absence or presence of TNF-α for 12 h. Secreted IL-1β and MCP-1 protein in culture media was determined by ELISA. (A,B) IL-1β and MCP1 secreted by primary monocytes, (C,D) primary macrophages and (E,F) THP-1 cells. The results obtained from minimum three independent experiments with three replicates of each experiment are shown. All data are expressed as mean ± SEM (n ≥ 3). *p ≤ 0.05, **p ≤ 0.01, ***p ≤ 0.001, ****p ≤ 0.0001 versus vehicle.
Figure 3
Figure 3
TNF-α mediated pro-inflammatory monocytic responses requires nSMase2. Primary monocytes and THP-1 monocytes were transfected with scramble-siRNA (negative control; Sc) or SMPD3 siRNA and incubated for 36 h. Real-time PCR was performed to measure (A) SMPD3 expression in primary monocytes and (B) CD11c was determined by real time RT-PCR. Cells were stained with antibodies against CD14 and CD11c along with matched isotypes and were subjected to flow cytometry analysis. (C) Flow cytometry data are presented as a bar graph of mean staining index of CD14+CD11c+ cells as well as (D) representative histogram. nSMase deficient THP-1 cells were treated with TNF-α and vehicle. (E) SMPD3 expression in transfected THP-1 monocytic cells. (F) CD11c mRNA was determined by real time RT-PCR. Cells were stained with antibody against CD11c along with matched isotype controls and assessed by flow cytometry. (G) Flow cytometry data are presented as a bar graph of mean staining index as well as (H) representative histogram. (I–J) Secreted IL-1β and MCP-1 by nSMase2 deficient cells. The results obtained from minimum three independent experiments with three replicates of each experiment are shown. All data are expressed as mean ± SEM (n ≥ 3). *p ≤ 0.05, **p ≤ 0.01, ***p ≤ 0.001, ****p ≤ 0.0001 versus vehicle.
Figure 4
Figure 4
Inhibition of nSMase affects TNF-α activated MAPK and NF-κB signaling pathways in monocytic cells. Monocytic cells were pretreated with nSMase inhibitor (GW4869: 10 µM) and then incubated with TNF-α for 15 min. Cell lysates were prepared as described in Methods. Samples were run on denaturing gels. Immuno-reactive bands were developed using an Amersham ECL Plus Western Blotting Detection System (GE Healthcare, Chicago, IL, USA) and visualized by Molecular Imager ChemiDoc Imaging Systems (Bio-Rad Laboratories, Hercules, CA, USA). (A) Phosphorylated proteins of ERK1/2 (p42/44), (B) p38 MAPK, (C) JNK, (D) c-Jun and (E) NF-κB are depicted in the upper panels and total respective proteins are shown in the lower panels. Phosphorylation intensity of p38 MAPK, ERK1/2, and NF-κB was quantified using Image Lab software (version 6.0.1, Bio-Rad, Hercules, CA, USA) and are presented in arbitrary units. All data are expressed as mean ± SEM (n ≥ 3). **** P < 0.0001 versus TNF-α without respective inhibitor. NF-κB phosphorylation was also determined by flow cytometry. (F) Representative flow cytometry dot plots of p-NF-κB fluorescence versus total IκBα cells. (G) Flow cytometry data are presented as a bar graph of mean staining index as well as (H) representative histogram. Bar graphs depict mean values ± SEM of staining intensity (SI). P < 0.05 was considered as statistically significant (*P ≤ 0.05; **P ≤ 0.01, ***P ≤ 0.001, ****P ≤ 0.0001). The data in all Figures are representative of three independent experiments. (I) NF-κB reporter monocytic cells were pretreated with nSMase inhibitor (GW4869: 10 µM) or vehicle for 1 h and then incubated with TNF-α for 12 h. Cell culture media were assayed for SEAP reporter activity (degree of NF-κB activation).
Figure 5
Figure 5
Association of elevated TNF-α with SMPD3 levels in obese human PBMCs. PBMCs were isolated from human blood samples obtained from lean (n = 13), overweight (n = 13) and obese (n = 13) individuals. mRNA of SMPD1 (aSMase), SMPD2 (nSMase), SMPD3 (nSMase) and TNF-α were detected by real time RT-PCR and represented as fold change over controls. (A–D) Each dot represents the individual value of SMPD1, SMPD2, SMPD3 or TNF-α mRNA. Lines represented the mean values of PBMCs’ SMPD1, SMPD2, SMPD3 and TNF-α of each group. (E) Correlation of SMPD3 and (F) SMPD1 mRNA with TNF-α in PBMCs of obese individuals.
Figure 6
Figure 6
Schematic illustration of the role of nSMase2 in TNF-α mediated inflammatory response in monocytic cells. The pathway highlights that disruption of nSMase2 activity by GW4869 or SMPD3 suppresses TNF-α induced production of inflammatory markers (CD11c, MCP-1, IL-1β) in monocytic cells. SM, sphingomyelin.

Similar articles

Cited by

References

    1. Pecht T, et al. Circulating blood monocyte subclasses and lipid-laden adipose tissue macrophages in human obesity. PLoS ONE. 2016;11:e0159350. doi: 10.1371/journal.pone.0159350. - DOI - PMC - PubMed
    1. Wouters K, et al. Circulating classical monocytes are associated with CD11c. Sci. Rep. 2017;7:42665. doi: 10.1038/srep42665. - DOI - PMC - PubMed
    1. Braune J, et al. IL-6 regulates M2 polarization and local proliferation of adipose tissue macrophages in obesity. J. Immunol. 2017;198:2927–2934. doi: 10.4049/jimmunol.1600476. - DOI - PubMed
    1. Kapellos TS, et al. Human monocyte subsets and phenotypes in major chronic inflammatory diseases. Front Immunol. 2019;10:2035. doi: 10.3389/fimmu.2019.02035. - DOI - PMC - PubMed
    1. Ahmad R, et al. The synergy between palmitate and TNF-α for CCL2 production is dependent on the TRIF/IRF3 pathway: implications for metabolic inflammation. J. Immunol. 2018;200:3599–3611. doi: 10.4049/jimmunol.1701552. - DOI - PMC - PubMed

Publication types

Substances