. 2020 Oct 8;3(1):557.
doi: 10.1038/s42003-020-01281-w.

Lipocalin-type prostaglandin D synthase regulates light-induced phase advance of the central circadian rhythm in mice

Affiliations

Lipocalin-type prostaglandin D synthase regulates light-induced phase advance of the central circadian rhythm in mice

Chihiro Kawaguchi et al. Commun Biol. .

Abstract

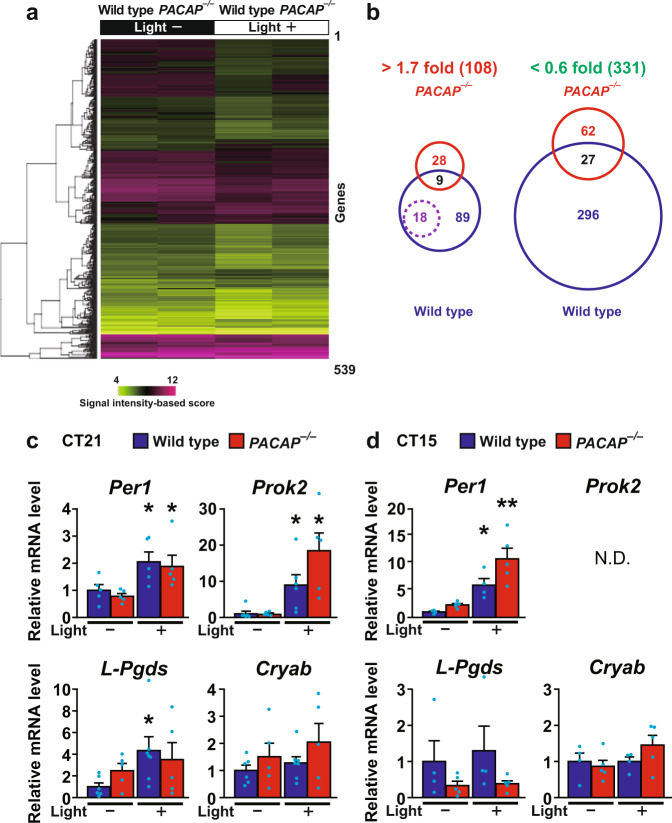
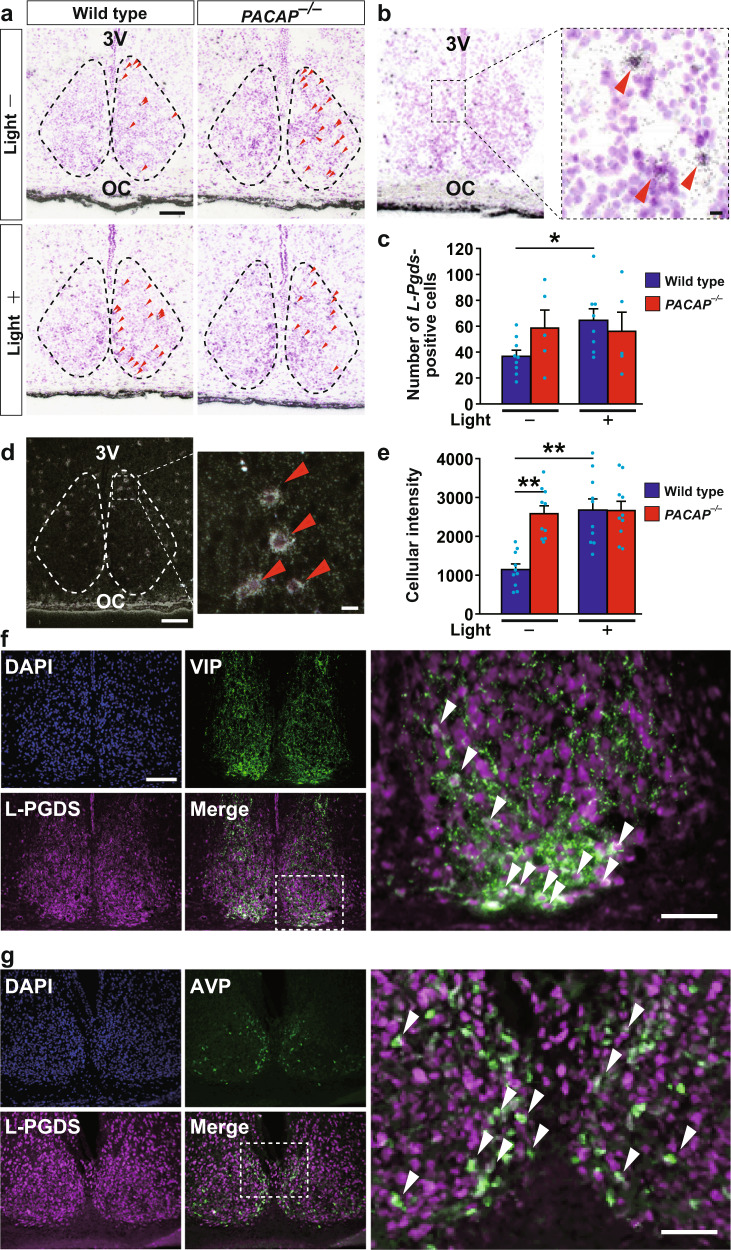
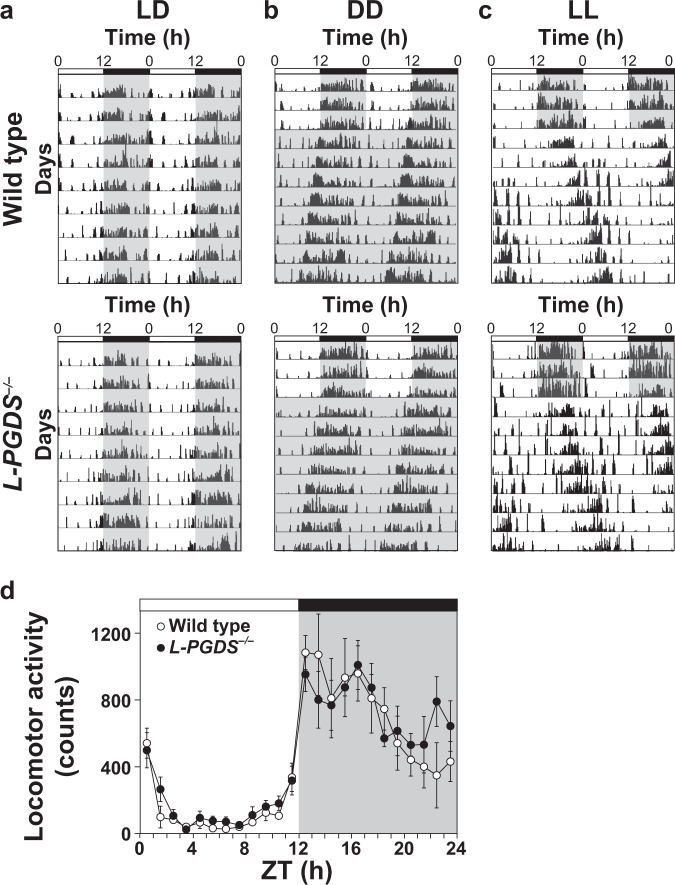
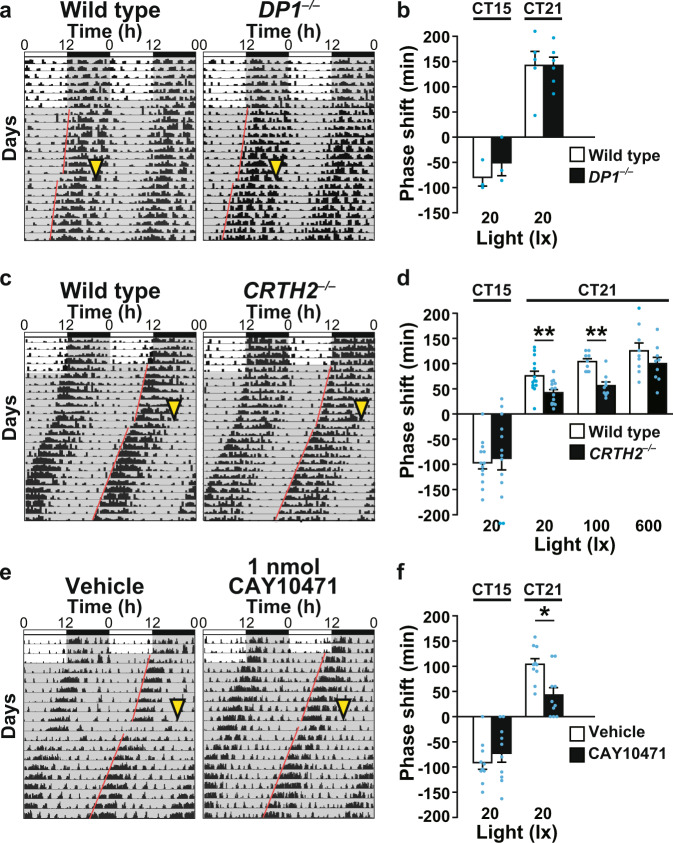
We previously showed that mice lacking pituitary adenylate cyclase-activating polypeptide (PACAP) exhibit attenuated light-induced phase shift. To explore the underlying mechanisms, we performed gene expression analysis of laser capture microdissected suprachiasmatic nuclei (SCNs) and found that lipocalin-type prostaglandin (PG) D synthase (L-PGDS) is involved in the impaired response to light stimulation in the late subjective night in PACAP-deficient mice. L-PGDS-deficient mice also showed impaired light-induced phase advance, but normal phase delay and nonvisual light responses. Then, we examined the receptors involved in the response and observed that mice deficient for type 2 PGD2 receptor DP2/CRTH2 (chemoattractant receptor homologous molecule expressed on Th2 cells) show impaired light-induced phase advance. Concordant results were observed using the selective DP2/CRTH2 antagonist CAY10471. These results indicate that L-PGDS is involved in a mechanism of light-induced phase advance via DP2/CRTH2 signaling.


Conflict of interest statement

The authors declare no competing interests.

Figures

Fig. 1
Fig. 1. Gene chip analysis of laser capture-microdissected SCNs in PACAP/− and wild-type mice illuminated or not illuminated with light in the late subjective night (CT 21).
a mRNA expression levels of the 539 differentially expressed genes as measured by hybridization signal intensity. Clustering dendrograms show the relative expression values according to the scale shown on the bottom left side (magenta, high expression level; light green, low expression level). b Venn diagram illustrating pairwise overlap of the genes. Data in each genotype comparison with light stimulation represent upregulated (>1.7-fold change) or downregulated (>0.6-fold change) genes. The 18 genes annotated to the term “extracellular region” are indicated by a purple dotted circle. These genes were upregulated by light stimulation in wild-type mice and are listed in Table 1. Real-time quantitative PCR analysis for L-Pgds and Cryab in the SCN upon light stimulation at CT 21 (c) and CT 15 (d). The Per1 and Prok2 genes were used as positive controls. ND indicates not detected. The values are shown as the mean ± SEM (n = 4–7 per group). Statistically significant differences were assessed using two-way ANOVA followed by Tukey–Kramer tests. *p < 0.05; **p < 0.01, vs kept without light stimulation.
Fig. 2
Fig. 2. L-Pgds (Ptgds) expression in the SCN in the late subjective night.
a In situ hybridization with a [35S]CTP-labeled antisense probe for L-Pgds in the SCN at CT 21. Representative bright-field photomicrographs are shown for PACAP−/− and wild-type mice, which were either light stimulated (light+) at CT 21 or kept without light (light−). 3V third ventricle; OC optic chiasma. The dotted line indicates the borders of the SCN area that contain densely aggregated cresyl violet-stained nuclei. Red arrowheads in the right SCN region indicate L-Pgds signals that were merged with counterstained neurons. Bar, 100 μm. b Wild-type mice illuminated with light. Right panel, magnification of the area marked with a black box. Red arrowheads indicate L-Pgds signals that were merged with counterstained neurons. Bars, 10 μm. c The number of L-Pgds-positive cells quantified in the SCN. To quantitatively determine the L-Pgds-expressing neurons in the whole SCN, five coronal SCN sections every four sections per mouse were used for statistical analysis. The values are shown as the mean ± SEM (n = 5–9 per group). *p < 0.05. Statistically significant differences were assessed using two-way ANOVA followed by Tukey–Kramer tests. d Representative dark-field photomicrographs. Bar, 100 μm. Right panel, magnification of the area marked with a white box. Red arrowheads indicate L-Pgds signals on individual cell bodies that were merged with Nissl-stained neurons. Bar, 10 μm. e Intensity of in situ hybridization signals for L-Pgds in each cell in the SCN. The values are shown as the mean ± SEM (n = 10 per group). **p < 0.01. Statistically significant differences were assessed using two-way ANOVA followed by Tukey–Kramer tests. Double immunohistochemical staining for L-PGDS (magenta) and VIP (green, f) or AVP (green, g) in the SCN. Right panels, magnification of the areas marked with white boxes. White arrowheads, cells that were immunoreactive for L-PGDS and VIP or AVP. Bars, 100 μm.
Fig. 3
Fig. 3. Circadian rhythms of locomotor activities in wild-type and L-PGDS−/− mice under light-dark (LD), constant dark (DD) and constant light (LL) conditions.
Representative double-plotted actograms of wild-type and L-PGDS−/− mice kept in the LD cycle (light, 12 h; dark, 12 h) (a) or transferred from LD to DD (b) or LL (c). d Daily variations in locomotor activities of wild-type and L-PGDS−/− mice under LD conditions. Intensity of illumination during the light phase, 100 lx. The values are expressed as the mean ± SEM (n = 5 per group). Statistically significant differences were assessed using two-way repeated measures ANOVA followed by Tukey–Kramer tests.
Fig. 4
Fig. 4. Impairment in light-induced phase advance in L-PGDS−/− mice.
Phase shift induced by light stimulation at CT 21 (a, b) and CT 15 (c, d) in L-PGDS−/− and wild-type mice. a, c Representative double-plotted actograms. Yellow arrowheads indicate light stimulation (20 lx, 30 min). Paired red lines represent the onset of activity. Quantification of the phase shift induced by light stimulation. The values are expressed as the mean ± SEM (n = 4–5 (b), n = 3–9 (d) per group). *p < 0.05; **p < 0.01. Statistically significant differences were assessed using two-way ANOVA followed by Tukey–Kramer tests. Resynchronization of circadian rhythms to time shifts, 8 h advance (e, f) and 8 h delay (g, h). e, g Representative patterns of wheel running activity. f, h Quantification of the phase shift. The values are expressed as the mean ± SEM (n = 6–8 per group). **p < 0.01. Statistically significant differences were assessed using two-way repeated measures ANOVA.
Fig. 5
Fig. 5. Impairment in light-induced phase advance in CRTH2−/− mice and in mice administered the CRTH2 blocker CAY10471.
Phase shift induced by light stimulation at CT 15 or CT 21 in DP1−/− (a, b) and CRTH2−/− (c, d) mice and wild-type mice of the respective genetic backgrounds. a, c Representative double-plotted actograms. Quantification of the phase shift induced by the indicated light stimulation. The values are expressed as the mean ± SEM (n = 3–6 (b), n = 9–14 (d) per group). e, f Phase shift induced by light stimulation at CT 15 or CT 21 in CD-1 wild-type mice administered the CRTH2 blocker CAY10471 or a vehicle (Riger’s solution) 30 min before light stimulation. e Representative double-plotted actograms. f Quantification of the phase shift. The values are expressed as the mean ± SEM (n = 10 per group). *p < 0.05; **p < 0.01. Statistically significant differences were assessed using two-way ANOVA followed by Tukey–Kramer tests. Yellow arrowheads indicate light stimulation (20 lx, 30 min). Paired red lines represent the onset of activity.

Similar articles

Cited by

References

    1. Bass J, Takahashi JS. Circadian integration of metabolism and energetics. Science. 2010;330:1349–1354. doi: 10.1126/science.1195027. - DOI - PMC - PubMed
    1. Golombek DA, Rosenstein RE. Physiology of circadian entrainment. Physiol. Rev. 2010;90:1063–1102. doi: 10.1152/physrev.00009.2009. - DOI - PubMed
    1. Albrecht U. Timing to perfection: the biology of central and peripheral circadian clocks. Neuron. 2012;74:246–260. doi: 10.1016/j.neuron.2012.04.006. - DOI - PubMed
    1. Takahashi JS. Transcriptional architecture of the mammalian circadian clock. Nat. Rev. Genet. 2017;18:164–179. doi: 10.1038/nrg.2016.150. - DOI - PMC - PubMed
    1. Tahara Y, Aoyama S, Shibata S. The mammalian circadian clock and its entrainment by stress and exercise. J. Physiol. Sci. 2017;67:1–10. doi: 10.1007/s12576-016-0450-7. - DOI - PMC - PubMed

Publication types

MeSH terms

Substances

LinkOut - more resources