

The specific metabolome profiling of patients infected by SARS-COV-2 supports the key role of tryptophan-nicotinamide pathway and cytosine metabolism
- PMID: 33033346
- PMCID: PMC7544910
- DOI: 10.1038/s41598-020-73966-5
The specific metabolome profiling of patients infected by SARS-COV-2 supports the key role of tryptophan-nicotinamide pathway and cytosine metabolism
Abstract
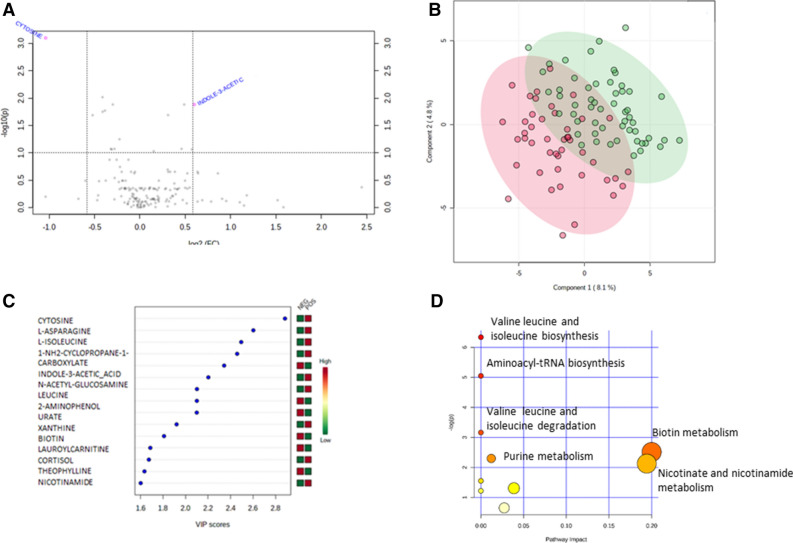
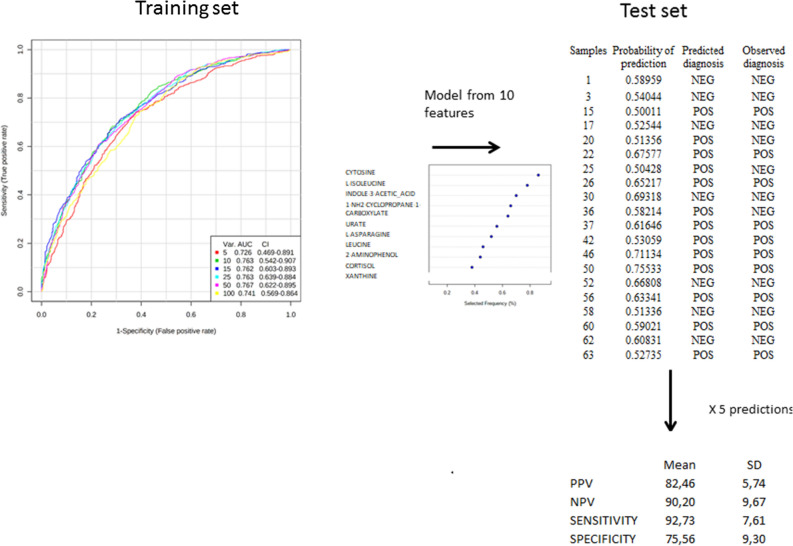
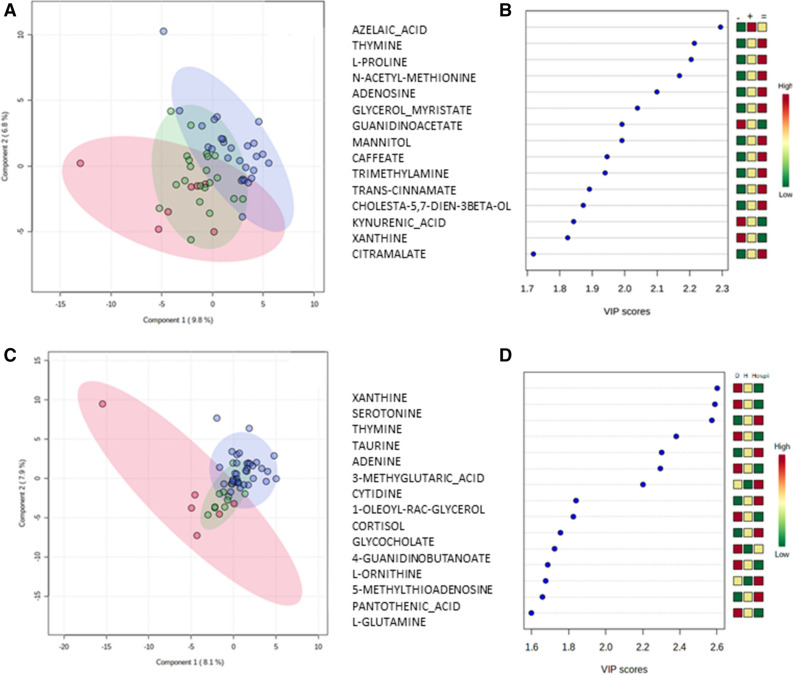
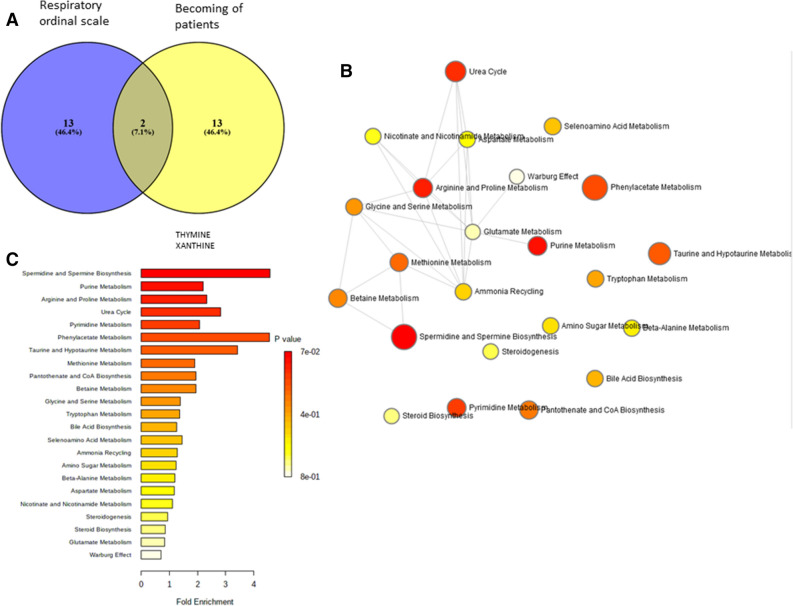
The biological mechanisms involved in SARS-CoV-2 infection are only partially understood. Thus we explored the plasma metabolome of patients infected with SARS-CoV-2 to search for diagnostic and/or prognostic biomarkers and to improve the knowledge of metabolic disturbance in this infection. We analyzed the plasma metabolome of 55 patients infected with SARS-CoV-2 and 45 controls by LC-HRMS at the time of viral diagnosis (D0). We first evaluated the ability to predict the diagnosis from the metabotype at D0 in an independent population. Next, we assessed the feasibility of predicting the disease evolution at the 7th and 15th day. Plasma metabolome allowed us to generate a discriminant multivariate model to predict the diagnosis of SARS-CoV-2 in an independent population (accuracy > 74%, sensitivity, specificity > 75%). We identified the role of the cytosine and tryptophan-nicotinamide pathways in this discrimination. However, metabolomic exploration modestly explained the disease evolution. Here, we present the first metabolomic study in SARS-CoV-2 patients which showed a high reliable prediction of early diagnosis. We have highlighted the role of the tryptophan-nicotinamide pathway clearly linked to inflammatory signals and microbiota, and the involvement of cytosine, previously described as a coordinator of cell metabolism in SARS-CoV-2. These findings could open new therapeutic perspectives as indirect targets.
Conflict of interest statement
The authors declare no competing interests.
Figures
Similar articles
-
Integrative Modeling of Quantitative Plasma Lipoprotein, Metabolic, and Amino Acid Data Reveals a Multiorgan Pathological Signature of SARS-CoV-2 Infection.J Proteome Res. 2020 Nov 6;19(11):4442-4454. doi: 10.1021/acs.jproteome.0c00519. Epub 2020 Sep 14. J Proteome Res. 2020. PMID: 32806897
-
Large-Scale Plasma Analysis Revealed New Mechanisms and Molecules Associated with the Host Response to SARS-CoV-2.Int J Mol Sci. 2020 Nov 16;21(22):8623. doi: 10.3390/ijms21228623. Int J Mol Sci. 2020. PMID: 33207699 Free PMC article.
-
Diabetes mellitus is a risk factor for prolonged SARS-CoV-2 viral shedding in lower respiratory tract samples of critically ill patients.Endocrine. 2020 Dec;70(3):454-460. doi: 10.1007/s12020-020-02465-4. Epub 2020 Sep 1. Endocrine. 2020. PMID: 32870469 Free PMC article.
-
Biochemical biomarkers alterations in Coronavirus Disease 2019 (COVID-19).Diagnosis (Berl). 2020 Nov 18;7(4):365-372. doi: 10.1515/dx-2020-0057. Diagnosis (Berl). 2020. PMID: 32589600 Review.
-
Primer design for quantitative real-time PCR for the emerging Coronavirus SARS-CoV-2.Theranostics. 2020 Jun 1;10(16):7150-7162. doi: 10.7150/thno.47649. eCollection 2020. Theranostics. 2020. PMID: 32641984 Free PMC article. Review.
Cited by
-
Breast Milk and COVID-19: From Conventional Data to "Omics" Technologies to Investigate Changes Occurring in SARS-CoV-2 Positive Mothers.Int J Environ Res Public Health. 2021 May 25;18(11):5668. doi: 10.3390/ijerph18115668. Int J Environ Res Public Health. 2021. PMID: 34070662 Free PMC article. Review.
-
Inflammatory Bowel Disease and COVID-19: How Microbiomics and Metabolomics Depict Two Sides of the Same Coin.Front Microbiol. 2022 Mar 21;13:856165. doi: 10.3389/fmicb.2022.856165. eCollection 2022. Front Microbiol. 2022. PMID: 35391730 Free PMC article. Review.
-
Amino Acid Metabolism is Significantly Altered at the Time of Admission in Hospital for Severe COVID-19 Patients: Findings from Longitudinal Targeted Metabolomics Analysis.Microbiol Spectr. 2021 Dec 22;9(3):e0033821. doi: 10.1128/spectrum.00338-21. Epub 2021 Dec 8. Microbiol Spectr. 2021. PMID: 34878333 Free PMC article.
-
Application of omics technology to combat the COVID-19 pandemic.MedComm (2020). 2021 Sep 16;2(3):381-401. doi: 10.1002/mco2.90. eCollection 2021 Sep. MedComm (2020). 2021. PMID: 34766152 Free PMC article. Review.
-
The snapshot of metabolic health in evaluating micronutrient status, the risk of infection and clinical outcome of COVID-19.Clin Nutr ESPEN. 2021 Aug;44:173-187. doi: 10.1016/j.clnesp.2021.06.011. Epub 2021 Jun 26. Clin Nutr ESPEN. 2021. PMID: 34330463 Free PMC article. Review.
References
Publication types
MeSH terms
Substances
LinkOut - more resources
Full Text Sources
Miscellaneous
