. 2020 Aug 27;11(21):6213-6225.
doi: 10.7150/jca.46155. eCollection 2020.

Nomograms predicting Overall Survival and Cancer-specific Survival for Synchronous Colorectal Liver-limited Metastasis

Affiliations

Nomograms predicting Overall Survival and Cancer-specific Survival for Synchronous Colorectal Liver-limited Metastasis

Yuqiang Li et al. J Cancer. .

Abstract

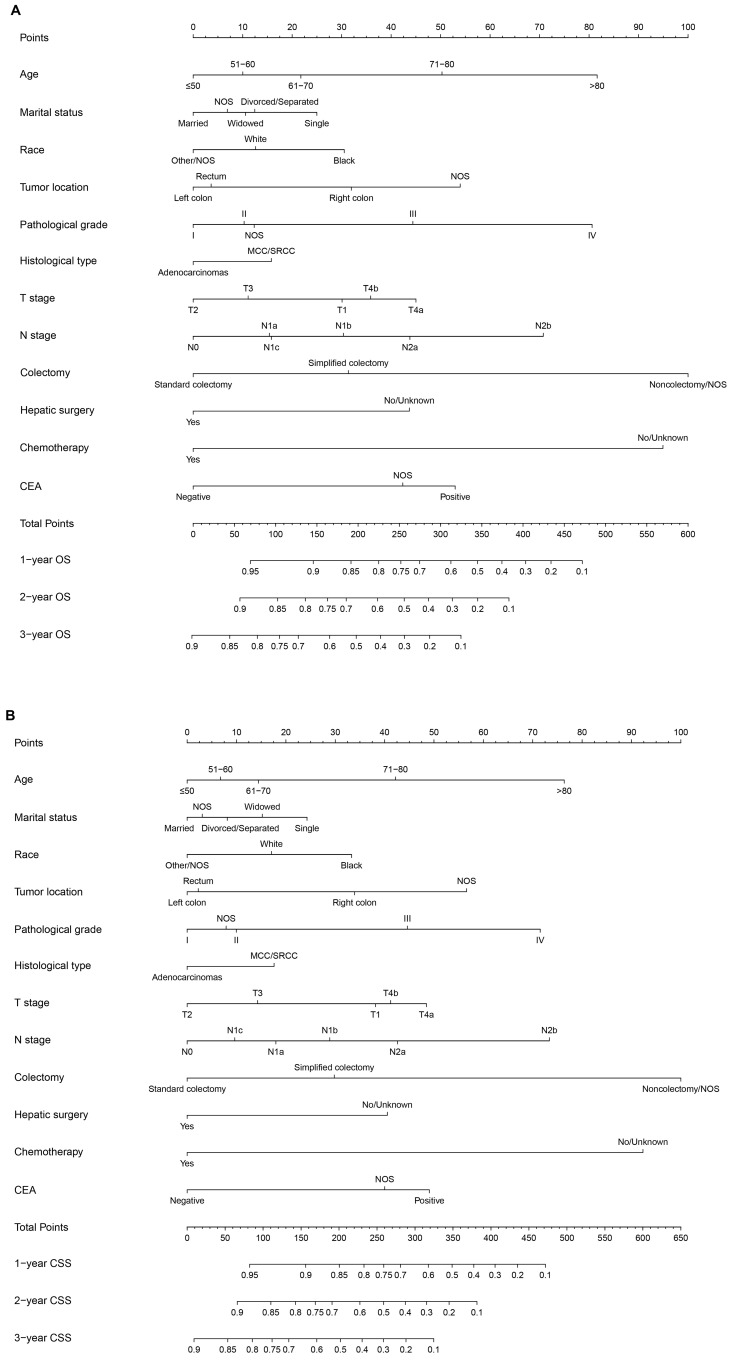
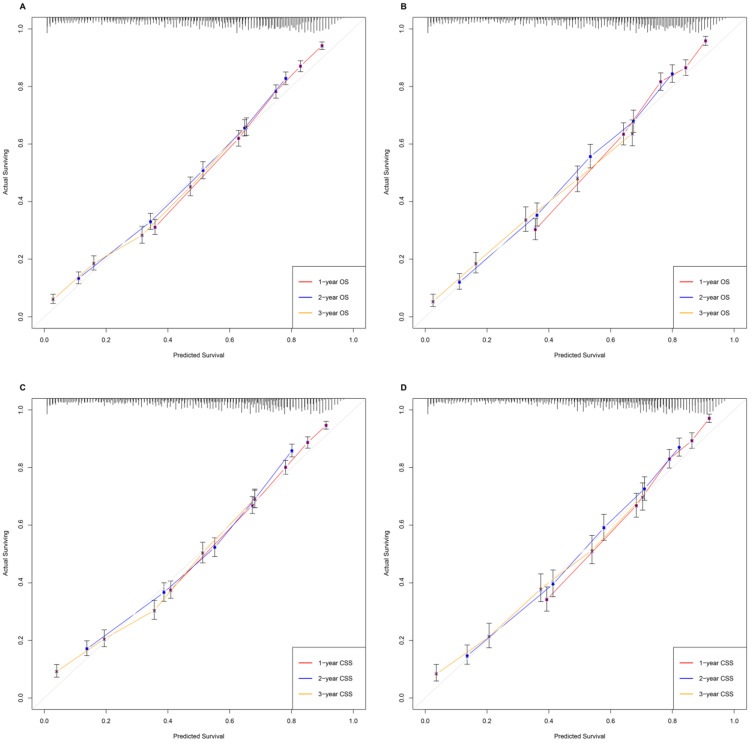
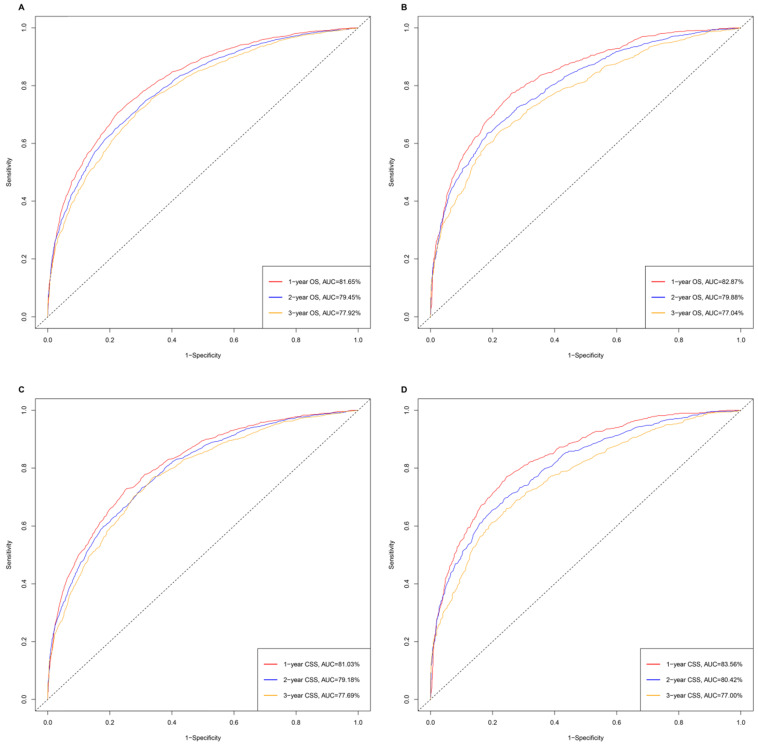
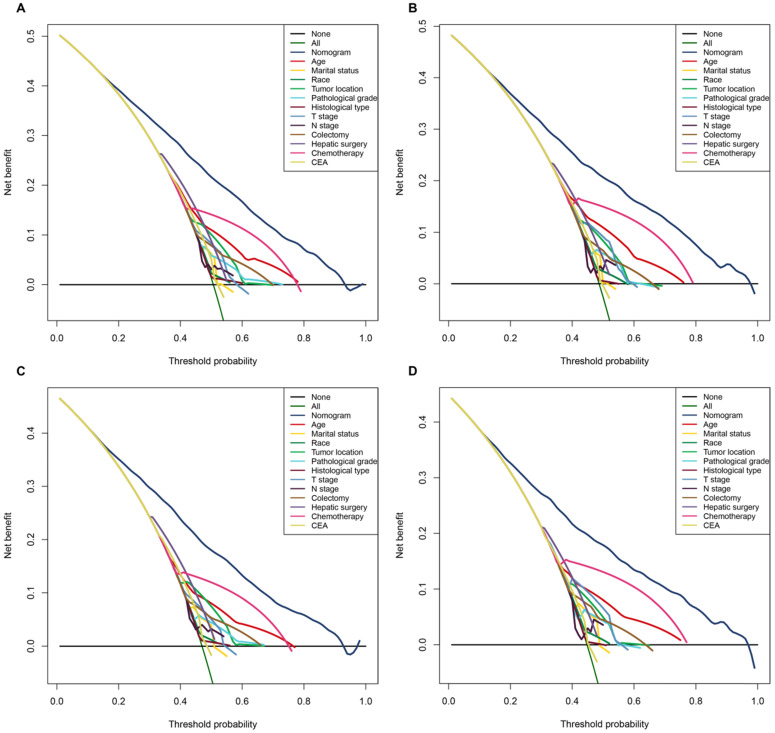
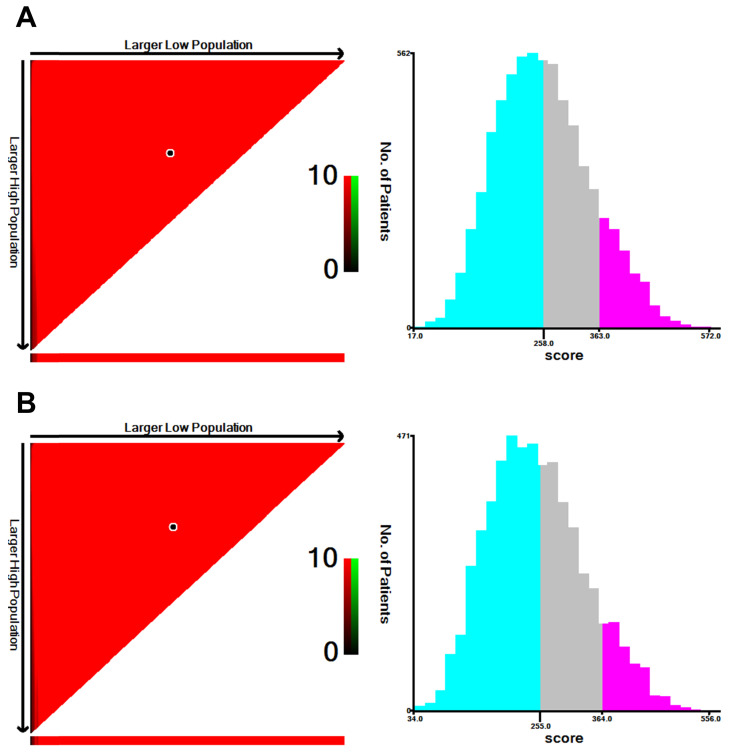
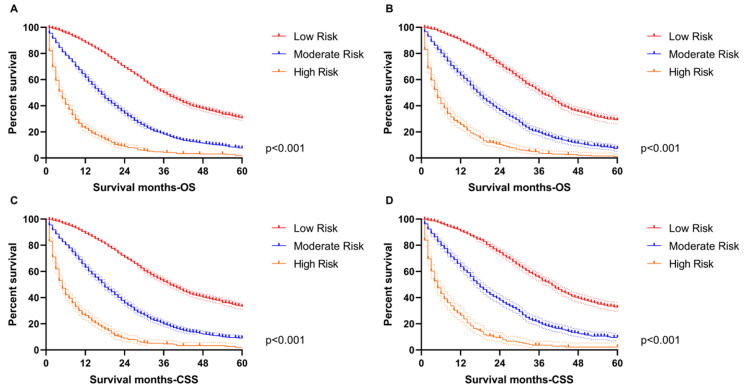
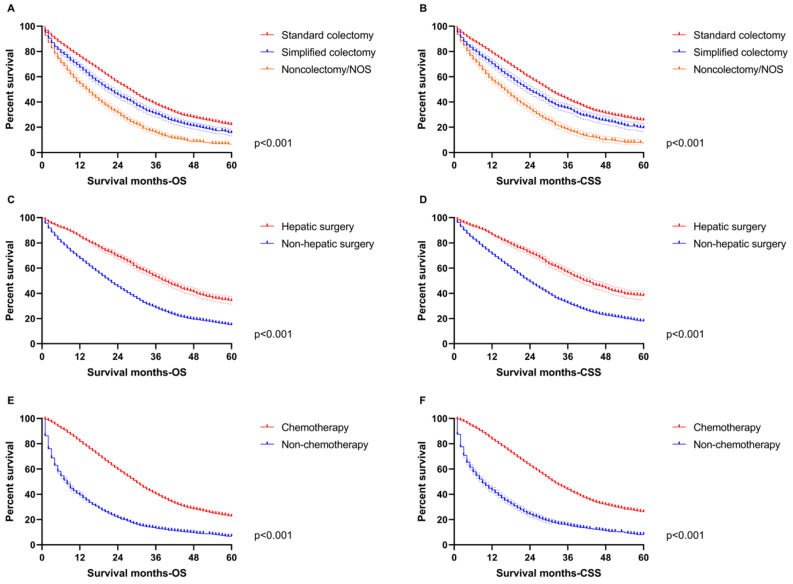
Background: Colorectal cancer (CRC) ranks as the third most frequent cancer type and the second leading cause of cancer-related death worldwide. The liver is the most common metastatic site of CRC with 20%-34% of patients suffering synchronous liver metastasis. Patients with colorectal liver-limited metastasis account for one-third of deaths from colorectal cancer. Moreover, some evidence indicated that CRC patients with synchronous liver disease encounter a worse prognosis and more disseminated disease state comparing with metastatic liver disease that develops metachronously. Methods: Data in this retrospective analysis were extracted from the Surveillance, Epidemiology, and End Results (SEER) database. Nomograms were constructed with basis from a multivariate Cox regression analysis. The prognostic nomograms were validated by C-index, time-dependent receiver operating characteristic (ROC) curve, decision curve analysis (DCA) and calibration curves. Results: A total of 9,958 CRC patients with synchronous liver-limited metastasis were extracted from the SEER database during 2010-2016. Both overall survival (OS) and cancer-specific survival (CSS) were significantly correlated with age, marital status, race, tumor location, pathological grade, histologic type, T stage, N stage, surgery for primary tumor, surgery for liver metastasis, chemotherapy and CEA. All of the significant variables were used to create the nomograms predicting OS and CSS. C-index values, time-dependent ROC curves, DCA curves and calibration curves, proved the superiority of the nomograms. Conclusions: Our research investigated a national cohort of almost 10,000 patients to create and verify nomograms based on pathological, therapeutic and demographic features to predict OS and CSS for synchronous colorectal liver-limited metastasis (SCLLM). The nomograms may act as an excellent tool to integrate clinical characteristics to guide the therapeutic choice for SCLLM patients.

Keywords: Nomogram; cancer-specific survival; colorectal cancer; liver metastasis; overall survival.


Conflict of interest statement

Competing Interests: The authors have declared that no competing interest exists.

Figures

Figure 1
Figure 1
A. Nomogram of predicting OS for patients with SCLLM; B. Nomogram of predicting CSS for patients with SCLLM.
Figure 2
Figure 2
The calibration curves, without obviously deviations from the reference line, illustrated optimal agreement between model prediction and actual observations for 1-, 2-, 3-year OS and CSS. A. Predicting patients' OS at 1-year, 2-year, 3-year in the training group. B. Predicting patients' OS at 1-year, 2-year, 3-year in the validation group. C. Predicting patients' CSS at 1-year, 2-year, 3-year in the training group. D. Predicting patients' CSS at 1-year, 2-year, 3-year in the validation group.
Figure 3
Figure 3
The time-dependent ROC curves of nomograms. A. The AUC values of ROC were 81.65%, 79.45% and 77.92% regarding nomograms predicting 1-, 2- and 3- year OS in training cohort. B. The 1-, 2-, and 3-year AUC values of the nomogram for OS were 82.87%, 79.88% and 77.04% in validation cohort. C. The AUC values of ROC were 81.03%, 79.18% and 77.69% regarding nomograms predicting 1-, 2- and 3- year CSS in training cohort. D. The 1-, 2-, and 3-year AUC values of the nomogram for CSS were 83.56%, 80.42% and 77.00% in validation cohort.
Figure 4
Figure 4
The decision curve analysis (DCA) demonstrated that the nomograms owned excellent net benefits and was superior to the any single prognostic factors across the wider range of reasonable threshold probabilities in OS and CSS. A. The DCA of the nomogram and all prognostic factors for OS in the training cohort. B. The DCA of the nomogram and all prognostic factors for OS in the validation cohort. C. DCA of the nomogram and all prognostic factors for CSS in the training cohort. D. The DCA of the nomogram and all prognostic factors for CSS in the validation cohort.
Figure 5
Figure 5
The cut-off values were calculated by using X-tile based on the total scores of patients in the training cohort. A. According to the cut-off values of the nomogram for OS, SCLLM were divided into low-risk (score < 258), moderate-risk (258 ≤ score < 363) and high-risk (score ≥ 363). B. According to the cut-off values of the nomogram for CSS, SCLLM were divided into low-risk (score < 255), moderate-risk (255 ≤ score < 364) and high-risk (score ≥ 364).
Figure 6
Figure 6
The survival analysis in the subgroup. A. The low-risk cohort owned the longest median OS (36-month) followed by the moderate-risk cohort (17-month OS) and high-risk cohort (5-month for OS) in the training group. B. The low-risk cohort owned the longest median OS (37-month) followed by the moderate-risk cohort (18-month OS) and high-risk cohort (5-month for OS) in the validation group. C. The low-risk cohort owned the longest median CSS (38-month) followed by the moderate-risk cohort (18-month CSS) and high-risk cohort (5-month for CSS) in the training group. D. The low-risk cohort owned the longest median CSS (40-month) followed by the moderate-risk cohort (18-month OS) and high-risk cohort (5-month for OS) in the validation group.
Figure 7
Figure 7
The survival analysis for therapeutic features in the total population. A. The difference of OS among standard colectomy (median OS: 28-month), simplified colectomy (median OS: 22-month) and non-colectomy/NOS (median OS: 15-month). B. The difference of CSS among standard colectomy (median CSS: 30-month), simplified colectomy (median CSS: 24-month) and non-colectomy/NOS (median CSS: 16-month). C. The difference of OS between hepatic surgery (median OS: 39-month) and non-hepatic surgery (median OS: 22-month). D. The difference of CSS between hepatic surgery (median CSS: 42-month) and non-hepatic surgery (median CSS: 24-month). E. The difference of OS between chemotherapy (median OS: 30-month) and non-chemotherapy (median OS: 8-month). F. The difference of CSS between chemotherapy (median CSS: 32-month) and non-chemotherapy (median CSS: 9-month).

References

    1. Bray F, Ferlay J, Soerjomataram I, Siegel RL, Torre LA, Jemal A. Global cancer statistics 2018: GLOBOCAN estimates of incidence and mortality worldwide for 36 cancers in 185 countries. CA: a cancer journal for clinicians. 2018;68:394–424. - PubMed
    1. Muratore A, Zorzi D, Bouzari H, Amisano M, Massucco P, Sperti E. et al. Asymptomatic colorectal cancer with un-resectable liver metastases: immediate colorectal resection or up-front systemic chemotherapy? Annals of surgical oncology. 2007;14:766–70. - PubMed
    1. Hayashi M, Inoue Y, Komeda K, Shimizu T, Asakuma M, Hirokawa F. et al. Clinicopathological analysis of recurrence patterns and prognostic factors for survival after hepatectomy for colorectal liver metastasis. BMC surgery. 2010;10:27. - PMC - PubMed
    1. Foster JH. Treatment of metastatic disease of the liver: a skeptic's view. Seminars in liver disease. 1984;4:170–9. - PubMed
    1. Kemeny N. Management of liver metastases from colorectal cancer. Oncology (Williston Park, NY) 2006;20:1161–76. 79; discussion 79-80, 85-6. - PubMed