Deep Learning to Estimate Human Epidermal Growth Factor Receptor 2 Status from Hematoxylin and Eosin-Stained Breast Tissue Images
- PMID: 33033656
- PMCID: PMC7513777
- DOI: 10.4103/jpi.jpi_10_20
Deep Learning to Estimate Human Epidermal Growth Factor Receptor 2 Status from Hematoxylin and Eosin-Stained Breast Tissue Images
Abstract
Context: Several therapeutically important mutations in cancers are economically detected using immunohistochemistry (IHC), which highlights the overexpression of specific antigens associated with the mutation. However, IHC panels can be imprecise and relatively expensive in low-income settings. On the other hand, although hematoxylin and eosin (H&E) staining used to visualize the general tissue morphology is a routine and low cost, it does not highlight any specific antigen or mutation.
Aims: Using the human epidermal growth factor receptor 2 (HER2) mutation in breast cancer as an example, we strengthen the case for cost-effective detection and screening of overexpression of HER2 protein in H&E-stained tissue.
Settings and design: We use computational methods that reliably detect subtle morphological changes associated with the over-expression of mutation-specific proteins directly from H&E images.
Subjects and methods: We trained a classification pipeline to determine HER2 overexpression status of H&E stained whole slide images. Our training dataset was derived from a single hospital containing 26 (11 HER2+ and 15 HER2-) cases. We tested the classification pipeline on 26 (8 HER2+ and 18 HER2-) held-out cases from the same hospital and 45 independent cases (23 HER2+ and 22 HER2-) from the TCGA-BRCA cohort. The pipeline was composed of a stain separation module and three deep neural network modules in tandem for robustness and interpretability.
Statistical analysis used: We evaluate our trained model through area under the curve (AUC)-receiver operating characteristic.
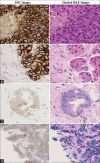
Results: Our pipeline achieved an AUC of 0.82 (confidence interval [CI]: 0.65-0.98) on held-out cases and an AUC of 0.76 (CI: 0.61-0.89) on the independent dataset from TCGA. We also demonstrate the region-level correspondence of HER2 overexpression between a patient's IHC and H&E serial sections.
Conclusions: Our work strengthens the case for automatically quantifying the overexpression of mutation-specific proteins in H&E-stained digital pathology, and it highlights the importance of multi-stage machine learning pipelines for added robustness and interpretability.
Keywords: Breast cancer; convolutional neural networks; histopathology; human epidermal growth factor receptor 2; immunohistochemistry; mutation detection; nucleus detection.
Copyright: © 2020 Journal of Pathology Informatics.
Conflict of interest statement
There are no conflicts of interest.
Figures


References
-
- Cancer of the Breast (Female) – Cancer Stat Facts. [Last accessed on 2019 Oct 02]. Available from: https://seercancergov/statfacts/html/breasthtml .
-
- American Cancer Society. Cancer Facts and Statistics. [Last accessed on 2019 Oct 02]. Available from: http://cancerstatisticscent ercancerorg/
-
- Perou CM, SÞrlie T, Eisen MB, van de Rijn M, Jeffrey SS, Rees CA, et al. Molecular portraits of human breast tumours. Nature. 2000;406:747–52. - PubMed
LinkOut - more resources
Full Text Sources
Research Materials
Miscellaneous

