. 2020 Oct 3;6(10):e05133.
doi: 10.1016/j.heliyon.2020.e05133. eCollection 2020 Oct.

Combination of Pancreastatin inhibitor PSTi8 with metformin inhibits Fetuin-A in type 2 diabetic mice

Affiliations

Combination of Pancreastatin inhibitor PSTi8 with metformin inhibits Fetuin-A in type 2 diabetic mice

Pragati Singh et al. Heliyon. .

Abstract

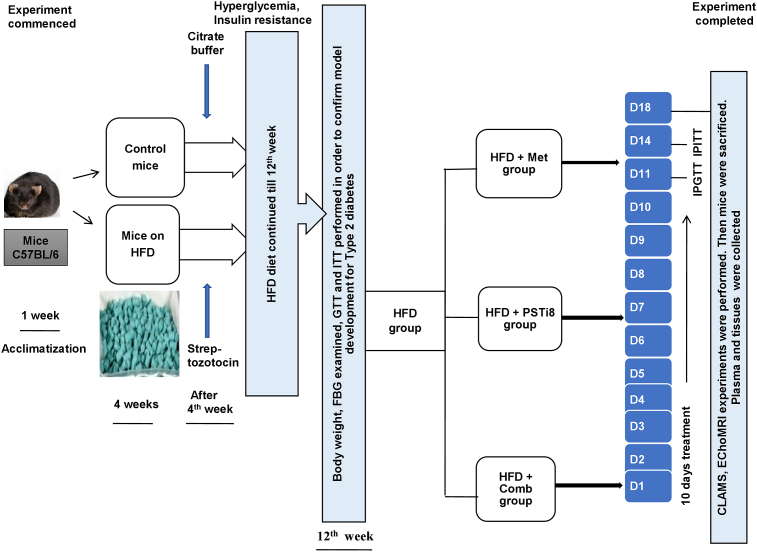
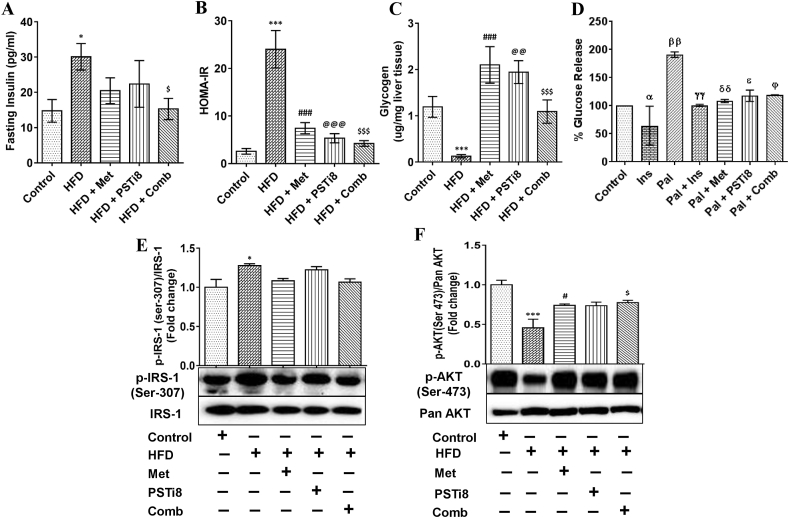
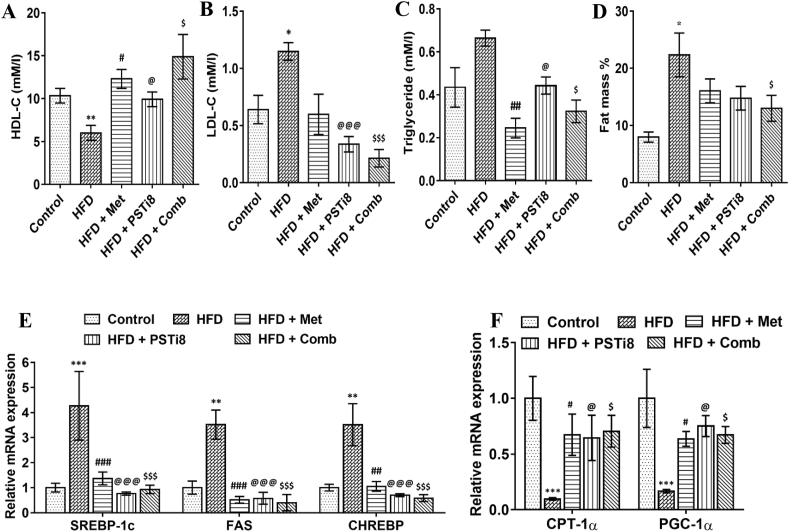
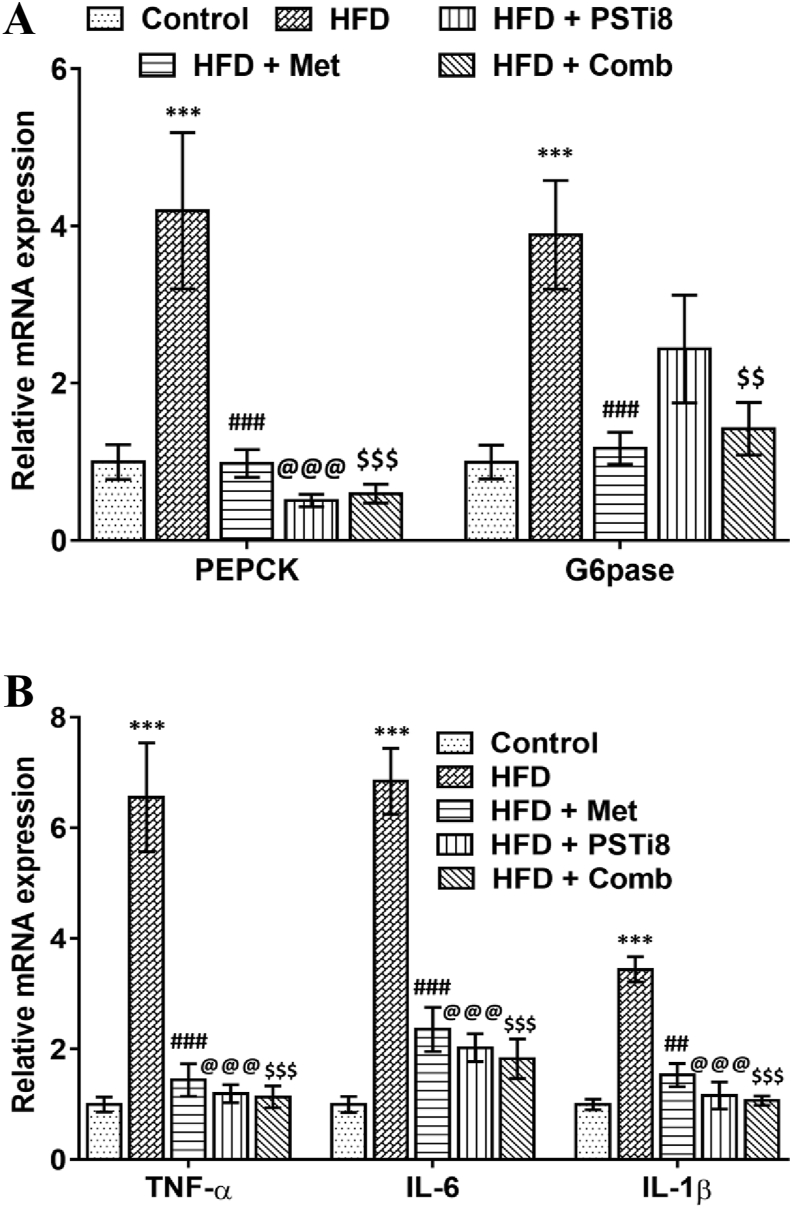
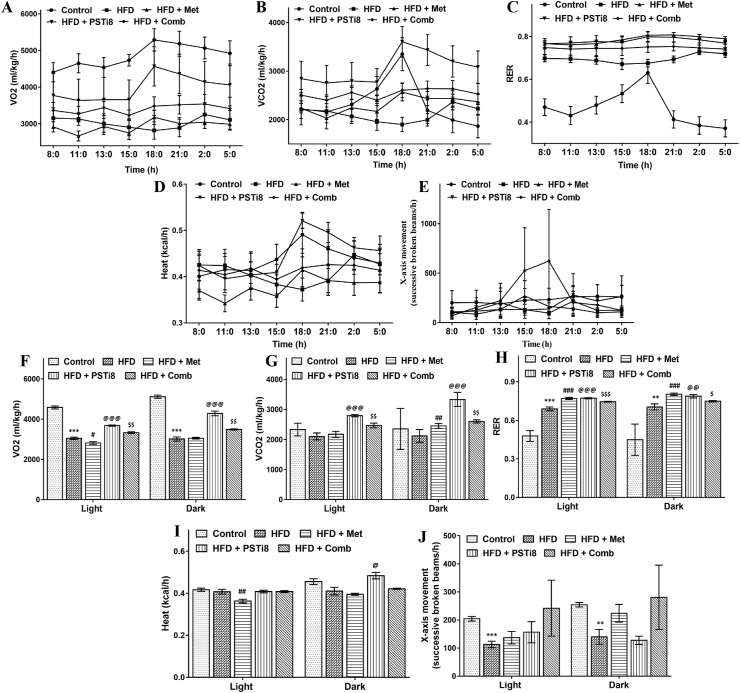
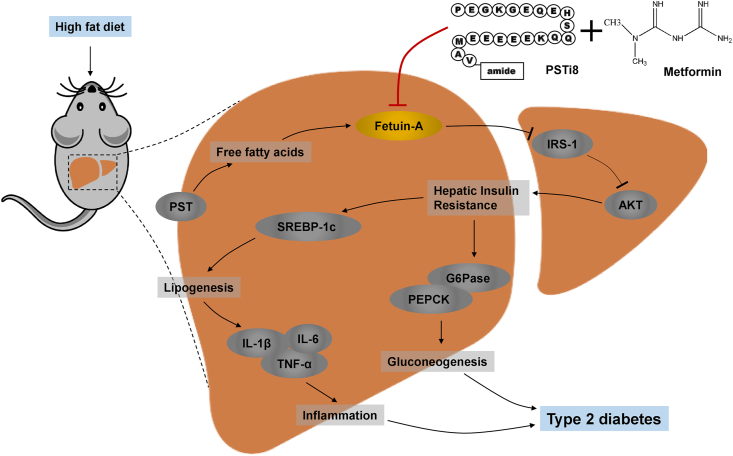
In the preceding study, we delineated that high-fat diet (HFD) consumption in mice increases the circulatory level of pancreastatin (PST), which additionally enhances the free fatty acid (FFA) concentration in circulation. Consequently, the aggravated FFA activates Fetuin-A, which facilitates hepatic lipid accumulation, insulin resistance (IR), and culminates in type 2 diabetes (T2D). Metformin (Met) is a widely known first-line drug for the treatment of T2D. We previously unveiled PSTi8, an inhibitor of PST, comprising antidiabetic property. Hence, we hypothesized that combination therapy of Met and PSTi8, at reduced therapeutic doses, would mitigate HFD-induced IR by inhibiting hepatic Fetuin-A in mice model of T2D. C57BL/6 mice were fed HFD for 12 weeks, followed by treatment with Met, PSTi8, and its combination for 10 days. Glucose and insulin tolerance tests were conducted. Circulatory levels of PST, Fetuin-A, and lipid markers were determined. Also, the mRNA and protein expression of Fetuin-A was assessed by qPCR, western blotting, and immunofluorescence. Moreover, the energy expenditure was measured by comprehensive laboratory animal monitoring system (CLAMS). Combination therapy displayed improved PST, Fetuin-A, and lipid profile in plasma. We also found reduced hepatic Fetuin-A, which reduced inhibitory phosphorylation of IRS and increased phosphorylation of AKT. Consequently, ameliorated hepatic lipogenesis, gluconeogenesis, and inflammation. Also, combination treatment attenuated Fetuin-A expression, lipid accumulation, and glucose production in palmitate-induced HepG2 cells. Altogether current study promulgates the beneficial effect of combination therapy of Met and PSTi8 (comparable to alone higher therapeutic doses) to ameliorate Fetuin-A activation, hepatic lipid accumulation, insulin resistance, and associated progressive pathophysiological alterations in T2D.

Keywords: Biochemistry; Biotechnology; Combination therapy; Diabetes; Endocrinology; Fetuin-A; Insulin resistance; Metabolic disorder; Metabolism; Metformin; Molecular biology; PSTi8; Pharmaceutical science; Pharmacology.


Figures

Figure 1
Figure 1
Experimental design of HFD model development and therapeutic intervention.
Figure 2
Figure 2
Dose selection study for combination of Met and PSTi8 with different doses of Met and PSTi8, HFD mouse model development and effect of combination therapy on glucose intolerance and reduced insulin sensitivity. (A) Glucose production assay to detect glucose production in Pal (250 μM) induced insulin resistant HepG2 cells (24 h) to select best combination of Met and PSTi8 (n = 3). (B) Glucose uptake assay to detect glucose uptake in Pal (250 μM) induced HepG2 cells (24 h) to select effective combination of Met and PSTi8 (n = 6). (C) Oil Red O staining in Pal (250 μM) induced HepG2 cells (24 h) to choose best possible combination of Met and PSTi8 (n = 5). (D) IPGTT with different combinations of Met and PSTi8 and its relevant (E) AUC. (F) Body weight and (G) fasting blood glucose measured before and after treatment. GTT and ITT were performed with optimized combination of Met and PSTi8 as (H) Acute IPGTT with relevant (I) AUC with acute treatment of Met 300 mg/kg, PSTi8 5 mg/kg and Combination Met 150 mg/kg + PSTi8 2.5 mg/kg including glucose 1 g/kg and (J) chronic IPGTT with related (K) AUC with chronic treatment of Met 300 mg/kg, PSTi8 2 mg/kg, and Combination Met 150 mg/kg + PSTi8 1 mg/kg were conducted (n = 6). We also performed (L) Acute IPITT related (M) AUC, with acute treatment of Met 300 mg/kg, PSTi8 5 mg/kg and Combination Met 150 mg/kg + PSTi8 2.5 mg/kg, including insulin 0.75 IU/kg (N) chronic IPITT and its corresponding (O) AUC with chronic treatment of Met 300 mg/kg, PSTi8 2 mg/kg, and Combination Met 150 mg/kg + PSTi8 1 mg/kg and insulin 0.75 IU/kg (n = 6). Results are shown as means ± SEM. Significance in group comparisons for (A) presented as α, Control vs Pal; β, Pal vs Pal + Met; γ, Pal vs Pal + PSTi8; Φ, Pal vs Pal + Met 50 μM + PSTi8 100 nM. Significance values depicted as α,β,γ,ɸp<0.05; αα,ββ,γγ,ɸɸp<0.01; ααα,βββ,γγγ,ɸɸɸp<0.001. For (B) significance in group comparisons followed as α, Control vs Pal; β, Pal vs Ins; γ, Pal + Met; δ Pal vs Pal + PSTi8; Φ, Pal vs Pal + Met 50 μM + PSTi8 100 nM. Significance values depicted as α,β,γ,δ,ɸp<0.05; αα,ββ,γγ,δδ,ɸɸp<0.01; ααα,βββ,γγγ,δδδ,ɸɸɸp<0.001. For (C) Results are shown as means ± SEM (n = 5). Significance in group comparisons represented as α, Control vs Pal; β, Pal vs Pal + Met; γ, Pal + PSTi8; δ, Pal vs Pal + Met 50 μM + PSTi8 50 nM; Φ, Pal vs Pal + Met 50 μM + PSTi8 100 nM. Significance values depicted as α,β,γ,δ,ɸp<0.05; αα,ββ,γγ,δδ,ɸɸp<0.01; ααα,βββ,γγγ,δδδ,ɸɸɸp<0.001. ns, non significant. For (E) Results are shown as means ± SEM (n = 6). Significance in group comparisons represented as α, Control vs HFD; β, HFD vs HFD + Met 300 mg/kg; Met; γ, HFD vs HFD + PSTi8; δ, HFD vs HFD + Met 150 mg/kg + PSTi8 1.25 mg/kg; ɸ, HFD vs HFD + Met 150 mg/kg + PSTi8 2.5 mg/kg. Significance values expressed as α,β,γ,δ,ε,ɸp<0.05; αα,ββ,γγ,δδ,εε,ɸɸp<0.01; ααα,βββ,γγγ,δδδ,εεε,ɸɸɸp<0.001. For (F–O) significance in group comparisons represented as ∗, Control vs HFD; #, HFD vs HFD + Met; @, HFD vs HFD + PSTi8; $, HFD vs HFD + Comb. Significance values expressed as ∗, #, @, $p < 0.05; ∗∗, ##, @@, $$p < 0.01; ∗∗∗, ###, @@@, $$$p < 0.001.
Figure 3
Figure 3
Effects of combination therapy on PST induced Free fatty acids and Fetuin-A. (A) Plasma levels of PST (B) NEFA and (C) Fetuin-A. (D) Real-Time PCR results showing relative mRNA expression of Fetuin-A in the liver (n = 6). (E) Immunoblotting of Fetuin-A in the liver. We further confirmed the enhanced Fetuin-A in pal-induced insulin-resistant HepG2 cells by immunofluorescence (F) and (G) quantified (Image J). Data values are shown as means ± SEM. Comparative significance for A–C, E and F represented as ∗, Control vs HFD; #, HFD vs HFD + Met; @, HFD vs HFD + PSTi8; $, HFD vs HFD + Comb. ∗, #, @, $p < 0.05; ∗∗, ##, @@, $$p < 0.01; ∗∗∗, ###, @@@, $$$p < 0.001. For G significance comparison represented as β, Control vs Pal; δ, Pal vs Pal + Met, ε, Pal vs Pal + PSTi8; Φ, Pal vs Pal + Comb. Significance values depicted as β,δ,ε,ɸp<0.05; ββ,δδ,εε,ɸɸp<0.01; βββ,δδδ,εεε,ɸɸɸp<0.001.
Figure 4
Figure 4
Combination therapy ameliorated Fetuin-A induced insulin resistance. (A) Fasting plasma insulin was detected after 6 h fasting (n = 6). (B) Analyzed HOMA-IR to determine insulin sensitivity (n = 6). (C) To envisage the results of insulin sensitivity, hepatic glycogen content was determined (n = 6). (D) Glucose production in insulin-resistant HepG2 cells (n = 3, with 2 independent experiments). To deduce the effect of combination therapy on insulin signaling, we detected the expression of (E) phospho-IRS-1 (Ser-307)/IRS-1 and (F) phospho-Akt (Ser-473)/pan-Akt (n = 3). Data values are shown as means ± SEM. Comparative significance for A–C, E and F represented as ∗, Control vs HFD; #, HFD vs HFD + Met; @, HFD vs HFD + PSTi8; $, HFD vs HFD + Comb. ∗, #, @, $p < 0.05; ∗∗, ##, @@, $$p < 0.01; ∗∗∗, ###, @@@, $$$p < 0.001. For D significance comparison represented as α, Pal vs Ins; β, Control vs Pal; γ, Pal vs Pal + Ins; δ, Pal vs Pal + Met, ε, Pal vs Pal + PSTi8; Φ, Pal vs Pal + Comb. Significance values depicted as α,β,γ,δ,ε,ɸp<0.05; αα,ββ,γγ,δδ,εε,ɸɸp<0.01; ααα,βββ,γγγ,δδδ,εεε,ɸɸɸp<0.001.
Figure 5
Figure 5
Effect of combination therapy on plasma lipid markers and unregulated lipid deposition plasma lipid markers (A) HDL-C, (B) LDL-C (C) Triglycerides were detected (n = 6). (D) Complete fat mass % was detected in body (n = 6). (E) Relative mRNA expression of lipogenic markers Srebp-1c, Fas, Chrebp and (B) important determinants of fatty acid oxidation Cpt-1α, Pgc-1α. Comparative significance for A–F represented as ∗, Control vs HFD; #, HFD vs HFD + Met; @, HFD vs HFD + PSTi8; $, HFD vs HFD + Comb. ∗, #, @, $p < 0.05; ∗∗, ##, @@, $$p < 0.01; ∗∗∗, ###, @@@, $$$p < 0.001.
Figure 6
Figure 6
Combination therapy ameliorated lipid accumulation in the liver of HFD fed mice and insulin resistant HepG2 cells. We performed (A) H&E staining of liver sections that manifested presence of steatosis (B) and (C) ballooning in HFD fed group. (D) Nile Red staining, (E) its fluorescence intensity quantification and (F) Oil Red O staining displayed increased lipid accumulation in Pal treated HepG2 cells. Comparative significance for A–C and F, represented as ∗, Control vs HFD; #, HFD vs HFD + Met; @, HFD vs HFD + PSTi8; $, HFD vs HFD + Comb. ∗, #, @, $p < 0.05; ∗∗, ##, @@, $$p < 0.01; ∗∗∗, ###, @@@, $$$p < 0.001. For D–F, significance values depicted as β,δ,ε,ɸp<0.05; ββ,δδ,εε,ɸɸp<0.01; βββ,δδδ,εεε,ɸɸɸp<0.001. Significance values represents ∗, #, @, $p < 0.05; ∗∗, ##, @@, $$p < 0.01; ∗∗∗, ###, @@@, $$$p < 0.001.
Figure 7
Figure 7
Combination therapy ameliorates glucose metabolism and expression of proinflammatory markers in liver (A) Relative mRNA levels of Pepck and G6pase were studied by qRT-PCR (n = 6). (B) Relative mRNA expression of Tnf-α, Il-6, Il-1β in liver (n = 6). Results represented as means ± SEM. Significance for Comparison among groups was represented as ∗, Control vs HFD; #, HFD vs HFD + Met; @, HFD vs HFD + PSTi8; $, HFD vs HFD + Comb. ∗, #, @, $p < 0.05; ∗∗, ##, @@, $$p < 0.01; ∗∗∗, ###, @@@, $$$p < 0.001.
Figure 8
Figure 8
Effect of Combination therapy on energy homeostasis – Study of metabolic parameters (24 h) in HFD mice may lead to emergence of new approaches regarding the consumption of metabolic fuel. Metabolic parameters (A, F) VO2 (mL/kg/h); (B, G) VCO2 (mL/kg/h); (C, H) RER (VCO2/VO2); (D, I) Heat production; (E, J) X-axis movement, were assessed in comprehensive lab animal monitoring system (CLAMS). Results obtained were shown as means ± SEM (n = 5). Significance comparison was represented as ∗, Control vs HFD; #, HFD vs HFD + Met; @, HFD vs HFD + PSTi8; $, HFD vs HFD + Comb. ∗, #, @, $p < 0.05; ∗∗, ##, @@, $$p < 0.01; ∗∗∗, ###, @@@, $$$p < 0.001.
Figure 9
Figure 9
Combination of Met and PSTi8 (at reduced therapeutic regimen) protects from T2D by inhibiting hepatic Fetuin-A and associated IR subsequently precludes comorbidities particularly lipogenesis, gluconeogenesis and inflammation in liver.

Similar articles

Cited by

References

    1. Ables G.P., Perrone C.E., Orentreich D., Orentreich N. Methionine-restricted C57BL/6J mice are resistant to diet-induced obesity and insulin resistance but have low bone density. PloS One. 2012;7 - PMC - PubMed
    1. Arulmozhi D.K., Kurian R., Bodhankar S.L., Veeranjaneyulu A. Metabolic effects of various antidiabetic and hypolipidaemic agents on a high-fat diet and multiple low-dose streptozocin (MLDS) mouse model of diabetes. J. Pharm. Pharmacol. 2008;60:1167–1173. - PubMed
    1. Bandyopadhyay G.K., Lu M., Avolio E., Siddiqui J.A., Gayen J.R., Wollam J., Vu C.U., Chi N.-W., O’Connor D.T., Mahata S.K. Pancreastatin-dependent inflammatory signaling mediates obesity-induced insulin resistance. Diabetes. 2015;64:104–116. - PubMed
    1. Benarbia M. el A., Macherel D., Faure S., Jacques C., Andriantsitohaina R., Malthièry Y. Plasmatic concentration of organochlorine lindane acts as metabolic disruptors in HepG2 liver cell line by inducing mitochondrial disorder. Toxicol. Appl. Pharmacol. 2013;272:325–334. - PubMed
    1. Boden G., She P., Mozzoli M., Cheung P., Gumireddy K., Reddy P., Xiang X., Luo Z., Ruderman N. Free fatty acids produce insulin resistance and activate the proinflammatory nuclear factor-κB pathway in rat liver. Diabetes. 2005;54:3458–3465. - PubMed

LinkOut - more resources