

Gaining Back What Is Lost: Recovering the Sense of Smell in Mild to Moderate Patients After COVID-19
- PMID: 33033827
- PMCID: PMC7665358
- DOI: 10.1093/chemse/bjaa066
Gaining Back What Is Lost: Recovering the Sense of Smell in Mild to Moderate Patients After COVID-19
Abstract
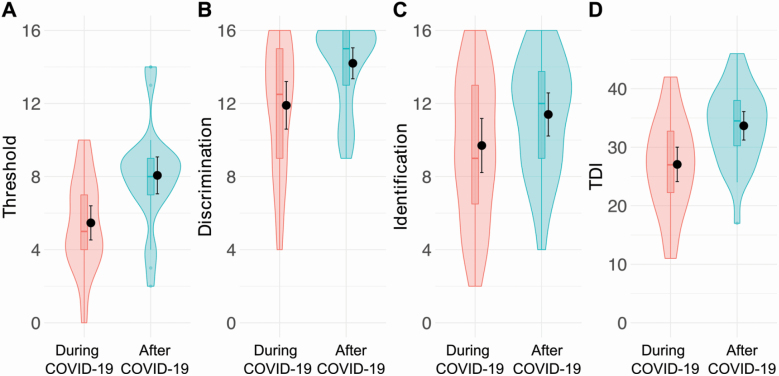
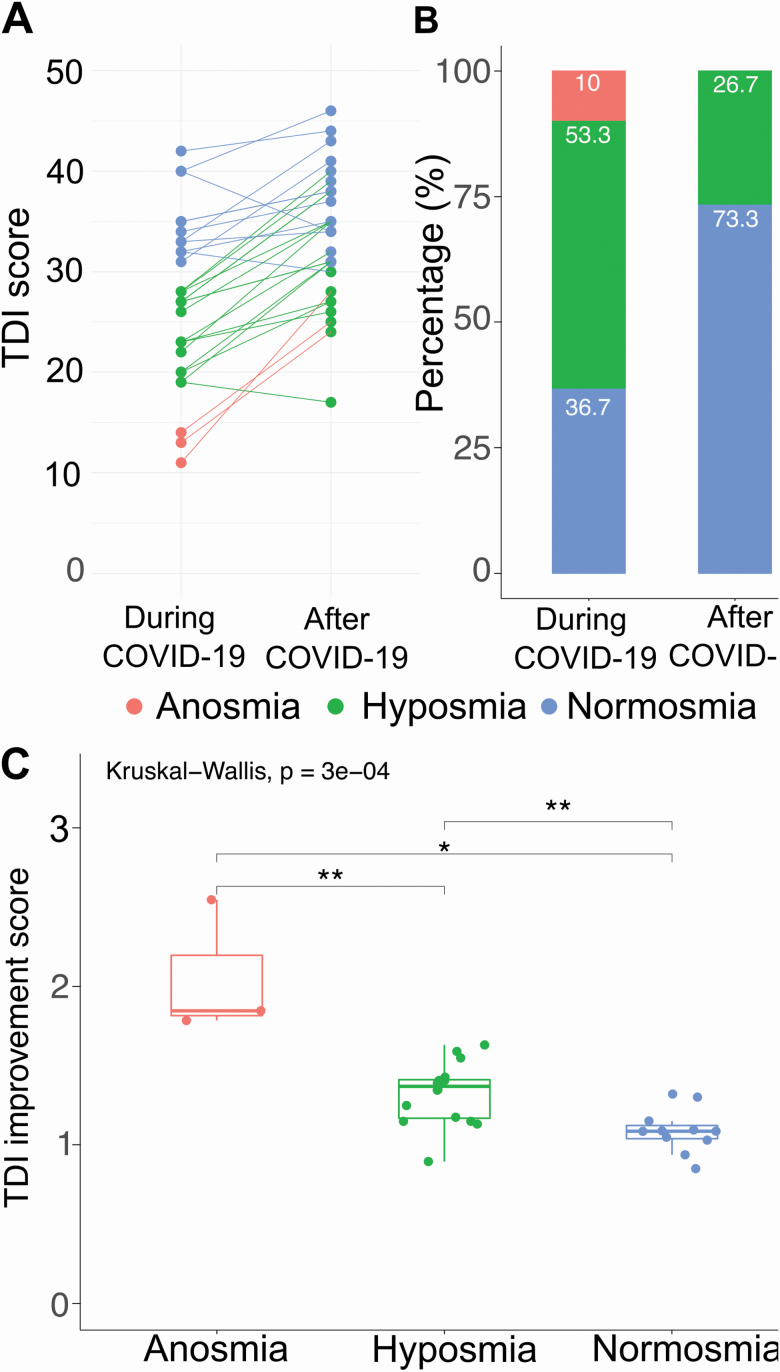
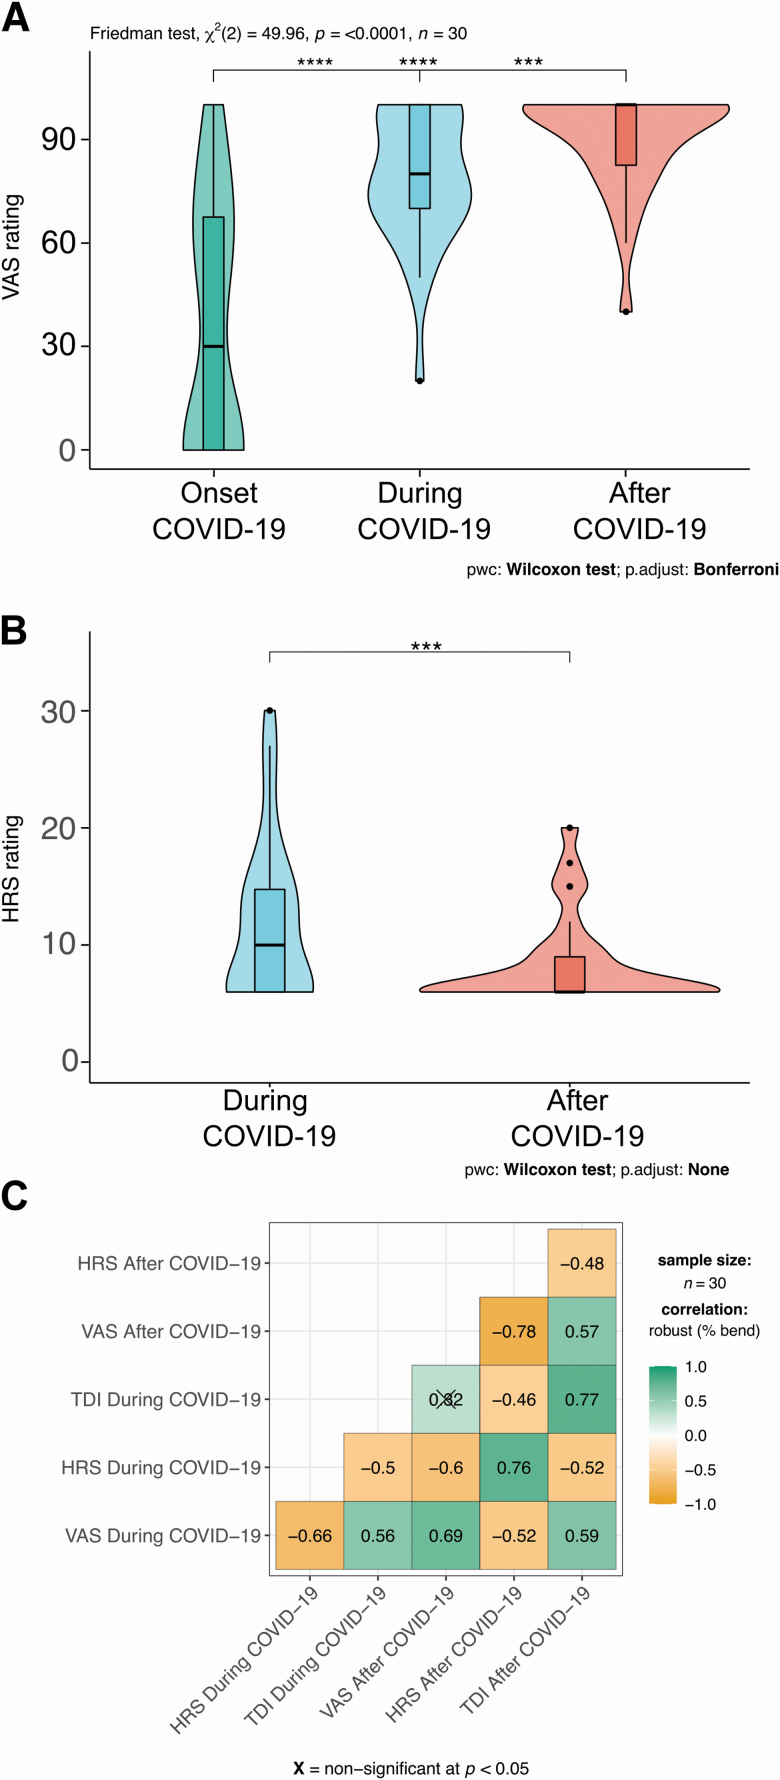
The purpose of our cohort study was to quantify olfactory deficits in Coronavirus disease 2019 (COVID-19) patients using Sniffin' Sticks and a pre-post design to evaluate olfactory recovery. Thirty adult patients with laboratory-confirmed mild to moderate forms of COVID-19 underwent a quantitative olfactory test performed with the Sniffin' Sticks test (SST; Burghardt, Wedel, Germany), considering olfactory threshold (T), odor discrimination (D), and odor identification (I). Results were presented as a composite TDI score (range 1-48) that used to define functional anosmia (TDI ≤ 16.5), hyposmia (16.5 < TDI < 30.5), or functionally normal ability to smell (TDI ≥ 30.5). Patients also self-evaluated their olfactory function by rating their ability to smell on a visual analogue scale (Visual Analog Scale rating) and answering a validated Italian questionnaire (Hyposmia Rating Scale). Patients were tested during hospitalization and about 2 months after symptoms onset. During the hospitalization, the overall TDI score indicated that our cohort had impairments in their olfactory ability (10% was diagnosed with anosmia and more than 50% were hyposmic). Almost all patients showed a significant improvement at around 1 month following the first test and for all the parts of the SST except for odor identification. None of the subjects at 1 month was still diagnosed with anosmia. We also quantified the improvement in the TDI score based on initial diagnosis. Anosmic subjects showed a greater improvement than hyposmic and normosmic subjects. In conclusion, within a month time window and 2 months after symptoms' onset, in our cohort of patients we observed a substantial improvement in the olfactory abilities.
Keywords: COVID-19; Sniffin’ Sticks test—SST; olfactory deficits; olfactory test.
© The Author(s) 2020. Published by Oxford University Press. All rights reserved. For permissions, please e-mail: journals.permissions@oup.com.
Figures
Similar articles
-
Clinical significance of results from olfactory testing.Laryngoscope. 2006 Oct;116(10):1858-63. doi: 10.1097/01.mlg.0000234915.51189.cb. Laryngoscope. 2006. PMID: 17003712 Clinical Trial.
-
Determination of Retronasal Olfactory Threshold Values.Laryngoscope. 2021 Jul;131(7):1608-1614. doi: 10.1002/lary.29395. Epub 2021 Feb 3. Laryngoscope. 2021. PMID: 33533495
-
[Clinical application of Sniffin' Sticks olfactory psychophysical measurements].Zhonghua Er Bi Yan Hou Tou Jing Wai Ke Za Zhi. 2013 Sep;48(9):741-5. Zhonghua Er Bi Yan Hou Tou Jing Wai Ke Za Zhi. 2013. PMID: 24330876 Chinese.
-
Objective Sensory Testing Methods Reveal a Higher Prevalence of Olfactory Loss in COVID-19-Positive Patients Compared to Subjective Methods: A Systematic Review and Meta-Analysis.Chem Senses. 2020 Dec 5;45(9):865-874. doi: 10.1093/chemse/bjaa064. Chem Senses. 2020. PMID: 33245136 Free PMC article.
-
Olfactory changes after endoscopic sinus surgery for chronic rhinosinusitis: A meta-analysis.Clin Otolaryngol. 2021 Jan;46(1):41-51. doi: 10.1111/coa.13639. Epub 2020 Sep 23. Clin Otolaryngol. 2021. PMID: 32865350
Cited by
-
The Adaptive Olfactory Measure of Threshold (ArOMa-T): a rapid test of olfactory function.Chem Senses. 2022 Jan 1;47:bjac036. doi: 10.1093/chemse/bjac036. Chem Senses. 2022. PMID: 36469087 Free PMC article.
-
The Effects of Medications and the Roles of Pharmacists on the Recovery of Patients with COVID-19 Infection: An Epidemiological Study from the United Arab Emirates.Healthcare (Basel). 2023 Feb 6;11(4):467. doi: 10.3390/healthcare11040467. Healthcare (Basel). 2023. PMID: 36833001 Free PMC article.
-
Shedding light on human olfaction: Electrophysiological recordings from sensory neurons in acute slices of olfactory epithelium.iScience. 2023 Jun 21;26(7):107186. doi: 10.1016/j.isci.2023.107186. eCollection 2023 Jul 21. iScience. 2023. PMID: 37456832 Free PMC article.
-
Effect of drug therapies on self-reported chemosensory outcomes after COVID-19.World J Otorhinolaryngol Head Neck Surg. 2024 May 13;10(2):88-96. doi: 10.1002/wjo2.183. eCollection 2024 Jun. World J Otorhinolaryngol Head Neck Surg. 2024. PMID: 38855284 Free PMC article.
-
International consensus statement on allergy and rhinology: Olfaction.Int Forum Allergy Rhinol. 2022 Apr;12(4):327-680. doi: 10.1002/alr.22929. Int Forum Allergy Rhinol. 2022. PMID: 35373533 Free PMC article. Review.
References
-
- World Health Organization n.d. Coronavirus disease 2019 (COVID-19). Situation Report Available from: https://www.who.int/docs/default-source/coronaviruse/situation-reports/2....
-
- Butowt R, Bilinska K. 2020. SARS-CoV-2: olfaction, brain infection, and the urgent need for clinical samples allowing earlier virus detection. ACS Chem Neurosci. 11(9):1200–1203. - PubMed
MeSH terms
LinkOut - more resources
Full Text Sources
Medical
