

Hepatic magnetic resonance T1-mapping and extracellular volume fraction compared to shear-wave elastography in pediatric Fontan-associated liver disease
- PMID: 33033916
- PMCID: PMC7796890
- DOI: 10.1007/s00247-020-04805-y
Hepatic magnetic resonance T1-mapping and extracellular volume fraction compared to shear-wave elastography in pediatric Fontan-associated liver disease
Abstract
Background: Children with Fontan circulation are at risk of developing hepatic fibrosis/cirrhosis. Reliable noninvasive monitoring techniques are lacking or under development.
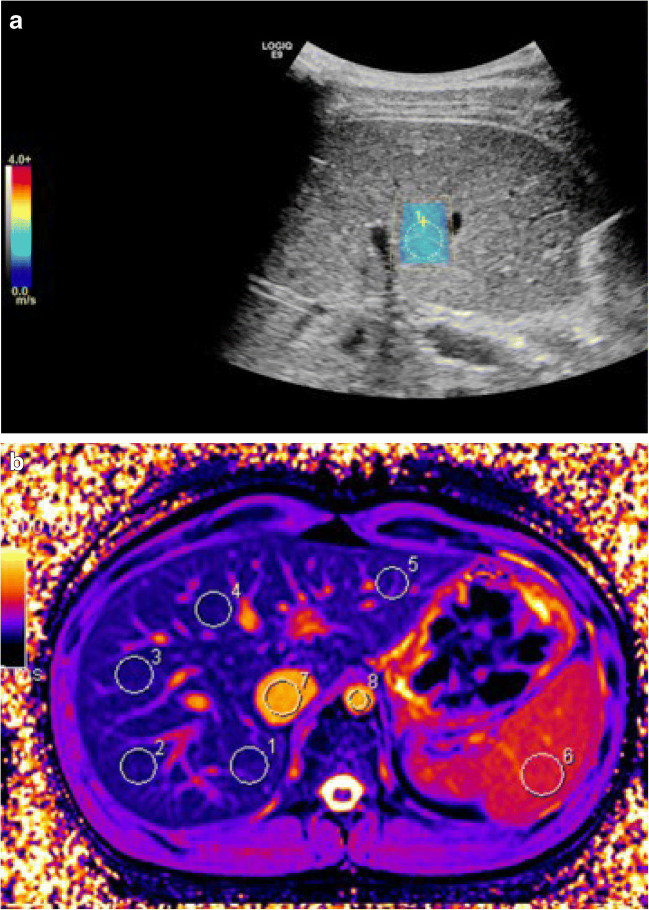
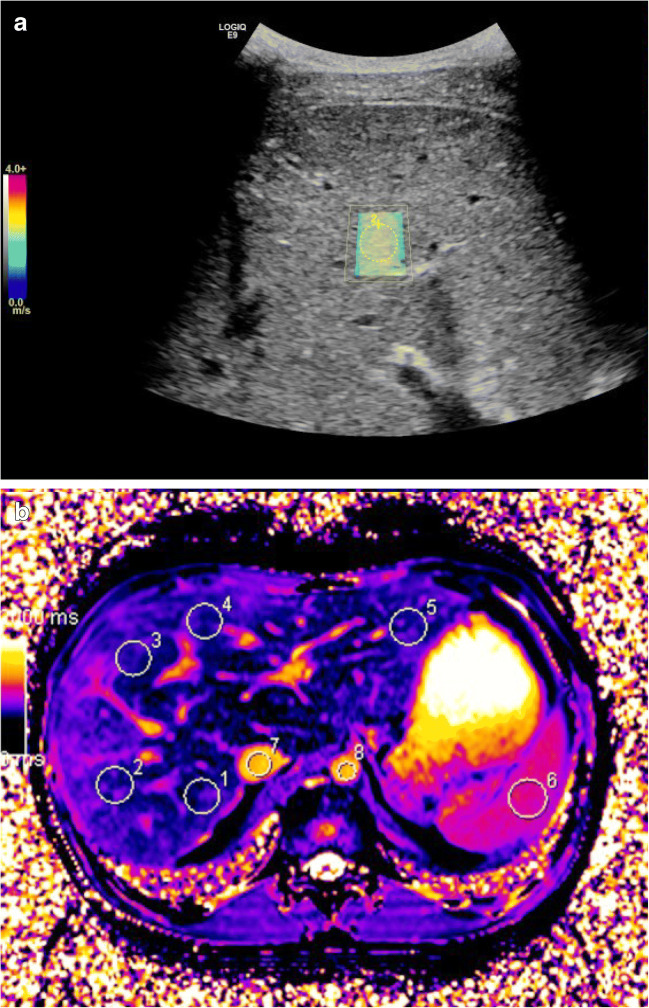
Objective: To investigate surrogate indicators of hepatic fibrosis in adolescents with Fontan circulation by evaluating hepatic magnetic resonance (MR) T1 mapping and extracellular volume fraction measurements compared to US shear-wave elastography.
Materials and methods: We analyzed hepatic native T1 times and extracellular volume fractions with modified Look-Locker inversion recovery. Liver stiffness was analyzed with shear-wave elastography. We compared results between 45 pediatric patients ages 16.7±0.6 years with Fontan circulation and 15 healthy controls ages 19.2±1.2 years. Measurements were correlated to clinical and hemodynamic data from cardiac catheterization.
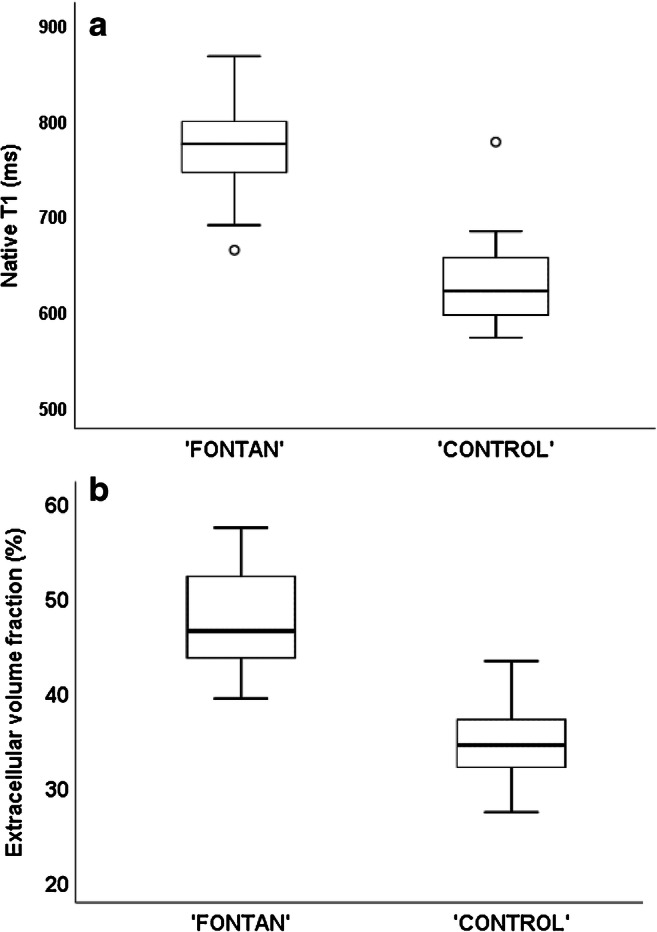
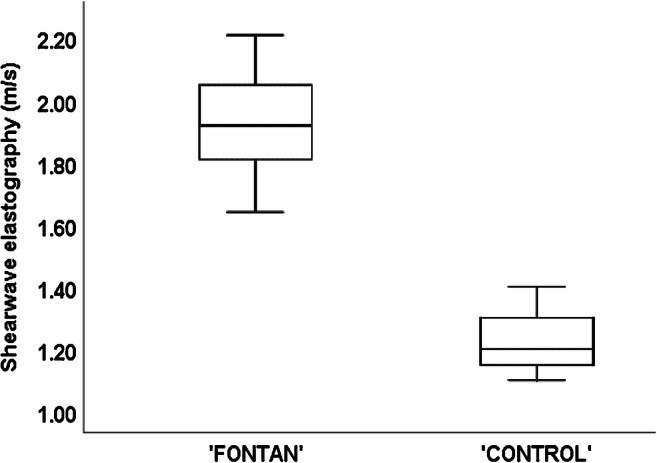
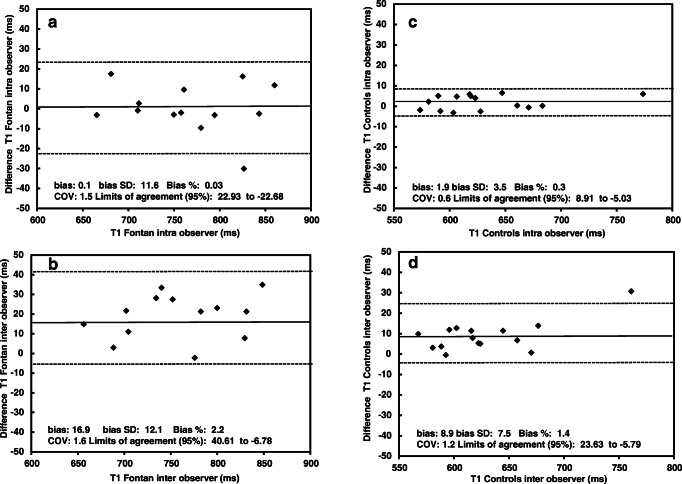
Results: MR mapping was successful in 35/45 patients, revealing higher hepatic T1 times (774±44 ms) than in controls (632±52 ms; P<0.001) and higher extracellular volume fractions (47.4±5.0%) than in controls (34.6±3.8%; P<0.001). Liver stiffness was 1.91±0.13 m/s in patients vs. 1.20±0.10 m/s in controls (P<0.001). Native T1 times correlated with central venous pressures (r=0.5, P=0.007). Native T1 was not correlated with elastography in patients (r=0.2, P=0.1) or controls (r = -0.3, P=0.3). Extracellular volume fraction was correlated with elastography in patients (r=0.5, P=0.005) but not in controls (r=0.2, P=0.6).
Conclusion: Increased hepatic MR relaxometry and shear-wave elastography values in adolescents with Fontan circulation suggested the presence of hepatic fibrosis or congestion. Central venous pressure was related to T1 times. Changes were detected differently with MR relaxometry and elastography; thus, these techniques should not be used interchangeably in monitoring hepatic fibrosis.
Keywords: Adolescents; Chronic liver disease; Fontan procedure; Liver; Magnetic resonance imaging; Ultrasonographic elastography.
Conflict of interest statement
None
Figures
References
-
- Rychik J, Atz AM, Celermajer DS et al (2019) Evaluation and management of the child and adult with Fontan circulation: a scientific statement from the American Heart Association. Circulation. 10.1161/CIR.0000000000000696 - PubMed
MeSH terms
LinkOut - more resources
Full Text Sources
Medical
