. 2021 Mar;73(3):426-439.
doi: 10.1002/art.41552. Epub 2021 Feb 8.

MicroRNA-34a-5p Promotes Joint Destruction During Osteoarthritis

Affiliations

MicroRNA-34a-5p Promotes Joint Destruction During Osteoarthritis

Helal Endisha et al. Arthritis Rheumatol. 2021 Mar.

Abstract

Objective: MicroRNA-34a-5p (miR-34a-5p) expression is elevated in the synovial fluid of patients with late-stage knee osteoarthritis (OA); however, its exact role and therapeutic potential in OA remain to be fully elucidated. This study was undertaken to examine the role of miR-34a-5p in OA pathogenesis.

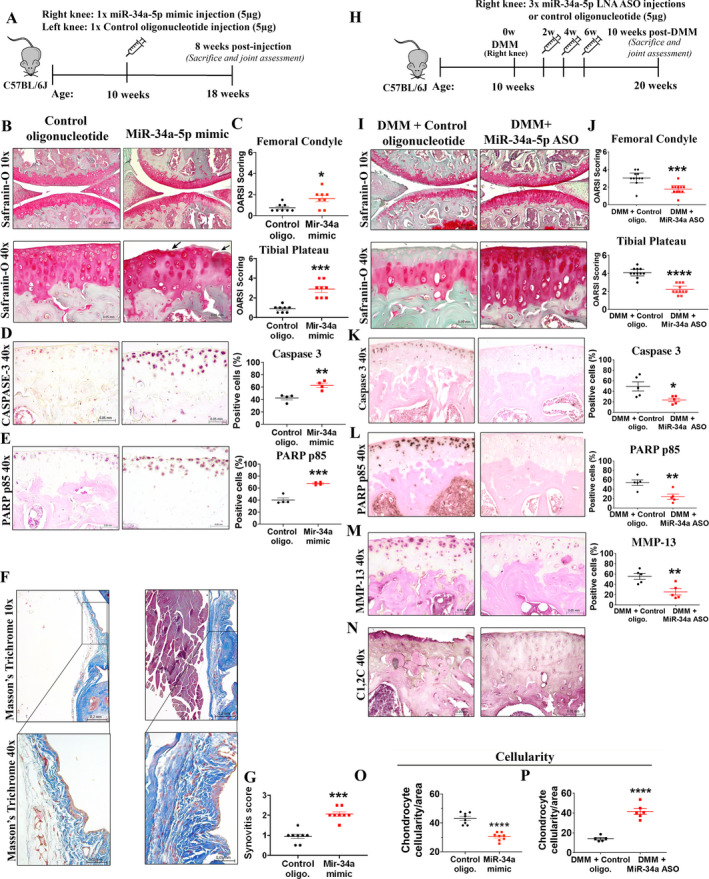
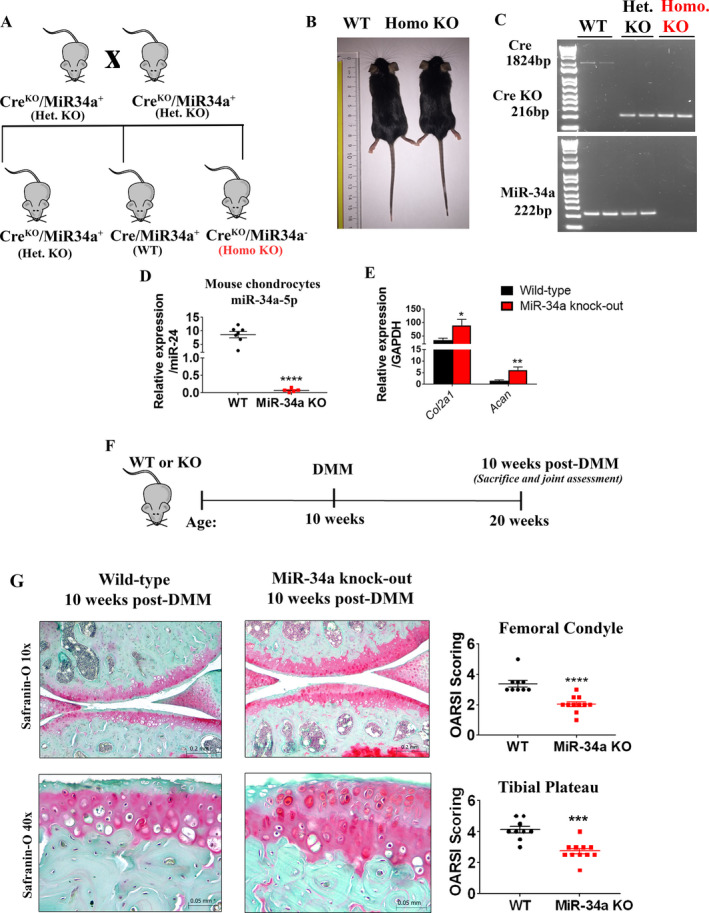
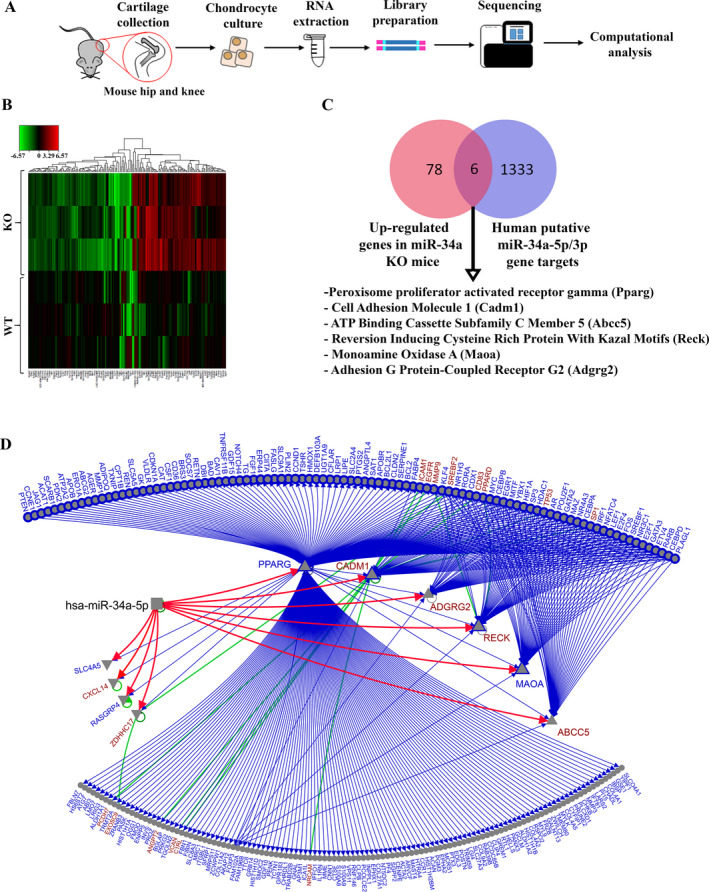
Methods: Expression of miR-34a-5p was determined in joint tissues and human plasma (n = 71). Experiments using miR-34a-5p mimic or antisense oligonucleotide (ASO) treatment were performed in human OA chondrocytes, fibroblast-like synoviocytes (FLS) (n = 7-9), and mouse OA models, including destabilization of the medial meniscus (DMM; n = 22) and the accelerated, more severe model of mice fed a high-fat diet and subjected to DMM (n = 11). Wild-type (WT) mice (n = 9) and miR-34a-knockout (KO) mice (n = 11) were subjected to DMM. Results were expressed as the mean ± SEM and analyzed by t-test or analysis of variance, with appropriate post hoc tests. P values less than 0.05 were considered significant. RNA sequencing was performed on WT and KO mouse chondrocytes.

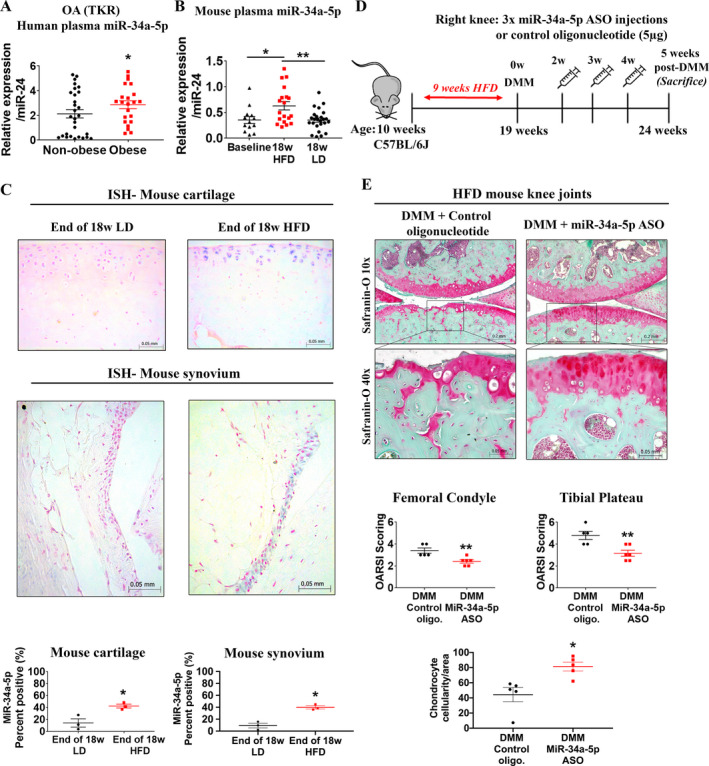
Results: Expression of miR-34a-5p was significantly increased in the plasma, cartilage, and synovium of patients with late-stage OA and in the cartilage and synovium of mice subjected to DMM. Plasma miR-34a-5p expression was significantly increased in obese patients with late-stage OA, and in the plasma and knee joints of mice fed a high-fat diet. In human OA chondrocytes and FLS, miR-34a-5p mimic increased key OA pathology markers, while miR-34a-5p ASO improved cellular gene expression. Intraarticular miR-34a-5p mimic injection induced an OA-like phenotype. Conversely, miR-34a-5p ASO injection imparted cartilage-protective effects in the DMM and high-fat diet/DMM models. The miR-34a-KO mice exhibited protection against DMM-induced cartilage damage. RNA sequencing of WT and KO chondrocytes revealed a putative miR-34a-5p signaling network.

Conclusion: Our findings provide comprehensive evidence of the role and therapeutic potential of miR-34a-5p in OA.


Figures

Figure 1
Figure 1
Local and systemic increases in microRNA‐34a‐5p (miR‐34a‐5p) in patients with late‐stage radiographic knee osteoarthritis (OA; who underwent total knee replacement [TKR]) and in the knee joints of mice with OA induced by destabilization of the medial meniscus (DMM). A, Expression of miR‐34a‐5p in plasma from healthy controls (n = 34) and patients with late‐stage knee OA (TKR; n = 37), as determined by quantitative reverse transcriptase–polymerase chain reaction. B, Expression of miR‐34a‐5p in normal cadaveric cartilage (n = 8) and knee OA (TKR) articular cartilage (n = 11). C, Expression of miR‐34a‐5p in synovial tissue from patients with early radiographic knee OA (Kellgren/Lawrence [K/L] grade 0 or 1; n = 7) and patients with OA with a K/L grade of 3 or 4 (TKR; n = 7). D, Safranin O histologic staining (top) and in situ hybridization (ISH; bottom) of miR‐34a‐5p in control non‐degenerated and degenerated knee OA cartilage from TKR patients. E, ISH quantification of the percentage of miR‐34a‐5p positively stained cells from control non‐degenerated (n = 4) and degenerated (n = 4) human knee cartilage. F, ISH of miR‐34a‐5p in knee sections obtained from mice 10 weeks after sham or DMM surgery. Bottom rows show higher‐magnification views (original magnification × 40) of the 2 boxed areas in the top row (original magnification x 4) showing regions of the tibial plateau articular cartilage; top right panels show higher‐magnification views (original magnification × 10) of the boxed area showing the medial anterior aspect of the synovial lining. Arrows indicate miR‐34a‐5p positively stained chondrocytes. G, ISH quantification of percentage of miR‐34a‐5p positively stained cells in mouse knee articular cartilage, synovium, and the meniscus 10 weeks after sham surgery (n = 4) or DMM surgery (n = 4). In AC, E, and G, data were log‐transformed prior to analysis. Each symbol represents an individual subject; horizontal lines and error bars show the mean ± SEM. * = P < 0.05; ** = P < 0.01, by Student’s unpaired 2‐tailed t‐test.
Figure 2
Figure 2
Modulation of the expression of key OA markers in chondrocytes and fibroblast‐like synoviocytes (FLS) in vitro by miR‐34a‐5p. A and B, Expression of mRNA for anabolic markers (COL2A1 and ACAN), autophagy markers (ATG5, ATG3, and ULK1), catabolic markers (MMP13 and ADAMTS5), an inflammatory marker (IL1B), and a hypertrophy marker (COL10A1) in human OA chondrocytes treated with 100 nM miR‐34a‐5p mimic (A) or miR‐34a‐5p antisense oligonucleotide (ASO) (B) for 24 hours compared to human OA chondrocytes treated with control oligonucleotide, as determined by quantitative reverse transcriptase–polymerase chain reaction (qRT‐PCR). C and D, Expression of mRNA for an extracellular matrix component (COL1A1), a myofibroblast marker (ACTA2), autophagy markers (ATG5, ATG3, and ULK1), a profibrotic cytokine (TGFB), and proinflammatory cytokines (TNF and IL6) in human OA FLS treated with 100 nM miR‐34a‐5p mimic (C) or miR‐34a‐5p ASO (D) for 24 hours compared to human OA FLS treated with control oligonucleotides, as determined by qRT‐PCR. Relative expression data were log‐transformed prior to analysis. Each symbol represents an individual patient sample; horizontal lines and error bars show the mean ± SEM (n = 7–9 patients per group). * = P < 0.05; ** = P < 0.01, by Student’s unpaired 2‐tailed t‐test. See Figure 1 for other definitions.
Figure 3
Figure 3
Intraarticular injection of miR‐34a‐5p mimic promotes knee OA development in mice, while intraarticular delivery of miR‐34a‐5p locked nucleic acid (LNA)–antisense oligonucleotide (ASO) protects against DMM‐induced OA. A, Schematic illustration showing the experimental design for injection of in vivo–grade miR‐34a‐5p mimic or control oligonucleotide (control oligo) into the knees of male C57BL/6J mice. B and C, Safranin O staining of (B) and Osteoarthritis Research Society International (OARSI) scores for (C) the femoral condyle and tibial plateau obtained from mice 8 weeks after injection with control oligonucleotide or miR‐34a‐5p mimic. Arrows show cartilage fissuring and fibrillation. D and E, Immunohistochemical (IHC) staining and quantification of caspase 3 (D) and poly(ADP‐ribose) polymerase (PARP) p85 (E) in knee joints from mice injected with control oligonucleotide or miR‐34a‐5p mimic. F and G, Masson’s trichrome histologic staining of the medial anterior aspect of the mouse synovium (F) and synovitis scores for (G) mice injected with control oligonucleotide or miR‐34a‐5p mimic. Bottom row in F shows higher‐magnification views of the boxed areas in the top row. H, Schematic illustration showing the experimental design for injection of in vivo–grade miR‐34a‐5p LNA‐ASO or control oligonucleotide into the knees of mice subjected to DMM. I and J, Safranin O staining of (I) and OARSI scores for (J) the medial femoral condyle and tibial plateau of mice subjected to DMM and injected with control oligonucleotide or miR‐34a‐5p LNA‐ASO. Mice were assessed 10 weeks after DMM. KM, IHC staining and quantification of caspase 3 (K), PARP p85 (L), and matrix metalloproteinase 13 (MMP‐13) (M) in the knee joints of mice subjected to DMM and injected with control oligonucleotide or miR‐34a‐5p LNA‐ASO. N, IHC staining for C1,2C in the knee joints of mice subjected to DMM and injected with control oligonucleotide (n = 5) or miR‐34a‐5p LNA‐ASO (n = 5). O and P, Chondrocyte cellularity per unit area in mice injected with control oligonucleotide or miR‐34a‐5p mimic (O) and in mice subjected to DMM and injected with control oligonucleotide or LNA‐ASO (P). In CE, G, JM, O, and P, each symbol represents an individual mouse; horizontal lines and error bars show the mean ± SEM (n = 8 mice per group in C, G, and O; 4 mice per group in D and E; 11 mice per group in J; 5 mice per group in KM; and 6 mice per group in P). * = P < 0.05; ** = P < 0.01; *** = P < 0.001; **** = P < 0.0001, by Mann‐Whitney U test in C, G, and J and by Student’s unpaired 2‐tailed t‐test in D, E, K, L, M, O, and P. See Figure 1 for other definitions.
Figure 4
Figure 4
Expression of miR‐34a‐5p is increased during obesity in humans and mice, and miR‐34a‐5p locked nucleic acid (LNA)–antisense oligonucleotide (ASO) treatment imparts cartilage‐protective effects in a high‐fat diet (HFD)–induced accelerated knee OA model in mice. A, Expression of miR‐34a‐5p in the plasma of nonobese patients (n = 29) and obese patients (n = 22) with knee OA (TKR), as determined by quantitative reverse transcriptase–polymerase chain reaction. B, Expression of miR‐34a‐5p in the plasma of 10‐week‐old C57BL/6J mice (baseline; n = 13), mice fed a high‐fat diet for 18 weeks (n = 19), and mice fed a lean diet (LD) for 18 weeks (n = 25). In A and B, relative expression data were log‐transformed prior to analysis. Each symbol represents an individual mouse; horizontal lines and error bars show the mean ± SEM. * = P < 0.05; ** = P < 0.01, by two‐way analysis of variance and Tukey’s multiple comparisons test. C, ISH and percentage of miR‐34a‐5p positively stained cells in mouse articular cartilage and synovium (medial compartment of the knee) at the end of 18 weeks of a lean diet or a high‐fat diet. Data were log‐transformed prior to analysis. Each symbol represents an individual mouse; horizontal lines and error bars show the mean ± SEM (n = 3 mice per group). * = P < 0.05, by Student’s unpaired 2‐tailed t‐test. D, Schematic illustration showing the experimental design for intraarticular injection of miR‐34a‐5p LNA‐ASO or control oligonucleotide into mice fed a high‐fat diet and subjected to DMM surgery. E, Safranin O staining of and Osteoarthritis Research Society International (OARSI) scores for the medial femoral condyle and tibial plateau from mice fed a high‐fat diet, subjected to DMM, and injected with control oligonucleotide or miR‐34a‐5p LNA‐ASO. The chondrocyte cellularity per unit area of mice fed a high‐fat diet, subjected to DMM, and injected with control oligonucleotide or miR‐34a‐5p LNA‐ASO is also shown. Mice were assessed 5 weeks after DMM surgery. Each symbol represents an individual mouse; horizontal lines and error bars show the mean ± SEM (n = 5 mice injected with control oligonucleotide and 6 mice injected with miR‐34a‐5p LNA‐ASO). * = P < 0.05; ** = P < 0.01, by Mann‐Whitney U test for OARSI score; by Student’s unpaired 2‐tailed t‐test for chondrocyte cellularity. See Figure 1 for other definitions.
Figure 5
Figure 5
Genetic ablation of miR‐34a protects mice against DMM‐induced cartilage damage. A, Schematic illustration of the breeding strategy used to generate miR‐34a homozygous (homo)–knockout (KO) and wild‐type (WT) mice. het = heterozygous. B, Lengths of 10‐week‐old WT and miR‐34a homozygous–KO mice. C, Cre and miR‐34a genotyping of mouse genomic DNA by polymerase chain reaction. D, Relative expression of miR‐34a‐5p in mouse chondrocytes isolated from articular cartilage of 5‐week‐old WT and miR‐34a homozygous–KO mice, determined by quantitative reverse transcriptase–polymerase chain reaction (qRT‐PCR). Relative expression data were log‐transformed. Each symbol represents an individual mouse; horizontal lines and error bars show the mean ± SEM (n = 7 WT mice and 5 KO mice). **** = P < 0.0001, by Student’s unpaired 2‐tailed t‐test. E, Relative expression of Col2a1 and Acan in chondrocytes from 5‐week‐old WT mice and miR‐34a homozygous–KO mice, determined by qRT‐PCR. Relative expression data were log‐transformed. Bars show the mean ± SEM (n = 7 WT mice and 9 KO mice). * = P < 0.05; ** = P < 0.01, by Student’s unpaired 2‐tailed t‐test. F, Schematic illustration of the experimental design for DMM surgery of male WT or miR‐34a–KO mice. G, Safranin O staining of and Osteoarthritis Research Society International (OARSI) scores for the medial femoral condyle and tibial plateau from WT mice and KO mice 10 weeks after DMM surgery. Each symbol represents an individual mouse; horizontal lines and error bars show the mean ± SEM (n = 9 WT mice and 11 KO mice). *** = P < 0.001; **** = P < 0.0001, by Mann‐Whitney test. See Figure 1 for other definitions.
Figure 6
Figure 6
RNA sequencing of wild‐type (WT) and microRNA‐34a–knockout (miR‐34a–KO) mouse chondrocytes identifies a miR‐34a‐5p signaling network. A, Schematic illustration of the experimental design for chondrocyte collection from mouse hip and knee articular cartilage, sample preparation, and RNA sequencing. B, Heatmap representing differentially expressed genes in miR‐34a–KO mouse chondrocytes compared to WT mouse chondrocytes. Each row represents an individual sample (n = 3 WT mice and 3 KO mice), and each column represents a gene transcript. The scale represents log fold‐change of KO transcript expression relative to the corresponding mean of the WT group in each gene. C, Venn diagram illustrating the overlap of 6 genes between 84 up‐regulated miR‐34a–KO mouse chondrocyte genes identified from RNA sequencing and 1,339 mirDIP‐derived human putative miR‐34a‐5p and miR‐34a‐3p direct gene targets. The 6 overlapping genes identified are all predicted targets of miR‐34a‐5p in humans. D, Combined transcription factor (TF) and protein–protein interaction (PPI) and miR‐34a‐5p target network for the differentially expressed genes in miR‐34a–KO mouse chondrocytes. Red directed lines are from mirDIP, blue directed lines are from the TF network, and green (undirected) lines are PPIs. Blue nodes are genes from the TF network only, while red nodes are connected by both TF and PPIs. Outlined nodes are linked by validated edges. Triangles pointing up represent up‐regulated genes, while triangles pointing down represent down‐regulated genes.

References

    1. Grotle M, Hagen KB, Natvig B, Dahl FA, Kvien TK. Obesity and osteoarthritis in knee, hip and/or hand: an epidemiological study in the general population with 10 years follow‐up. BMC Musculoskelet Disord 2008;9:132. - PMC - PubMed
    1. Kapoor M, Martel‐Pelletier J, Lajeunesse D, Pelletier JP, Hassan F. Role of proinflammatory cytokines in the pathophysiology of osteoarthritis. Nat Rev Rheumatol 2011;7:33–42. - PubMed
    1. Caramés B, Taniguchi N, Otsuki S, Blanco FJ, Lotz M. Autophagy is a protective mechanism in normal cartilage, and its aging‐related loss is linked with cell death and osteoarthritis. Arthritis Rheum 2010;62:791–801. - PMC - PubMed
    1. Thomas CM, Fuller CJ, Whittles CE, Sharif M. Chondrocyte death by apoptosis is associated with cartilage matrix degradation. Osteoarthritis Cartilage 2007;15:27–34. - PubMed
    1. Kim HA, Lee YJ, Soong SC, Choe KW, Song YW. Apoptotic chondrocyte death in human osteoarthritis. J Rheumatol 2000;27:455–62. - PubMed

Publication types

MeSH terms