

Multi-ethnic GWAS and meta-analysis of sleep quality identify MPP6 as a novel gene that functions in sleep center neurons
- PMID: 33034629
- PMCID: PMC7953222
- DOI: 10.1093/sleep/zsaa211
Multi-ethnic GWAS and meta-analysis of sleep quality identify MPP6 as a novel gene that functions in sleep center neurons
Abstract
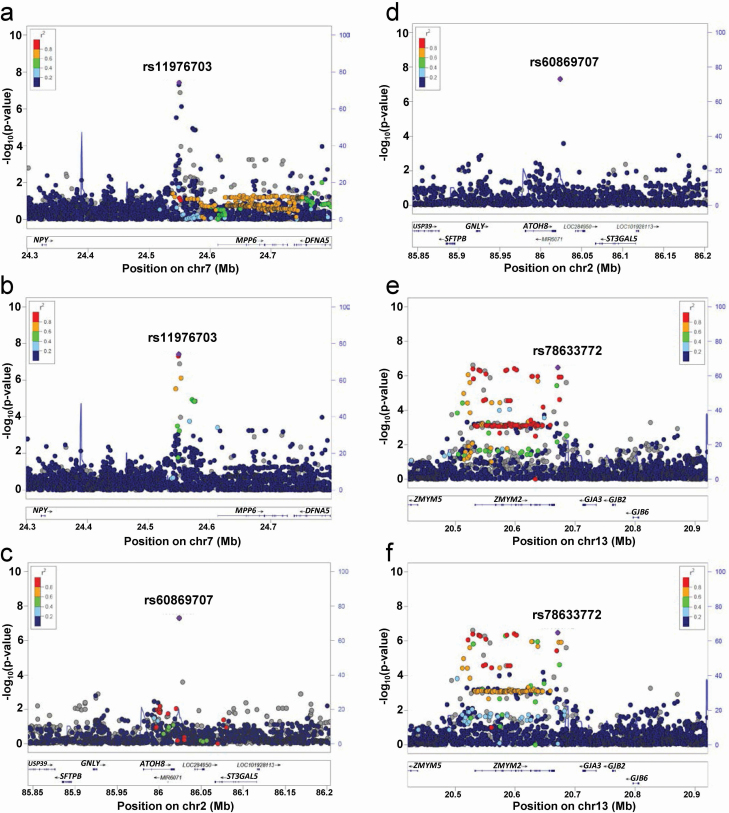
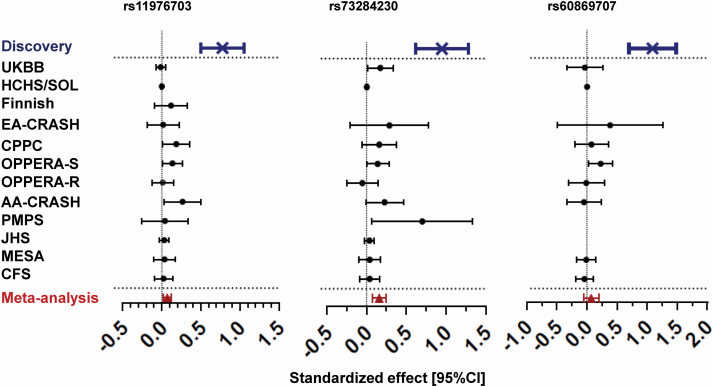
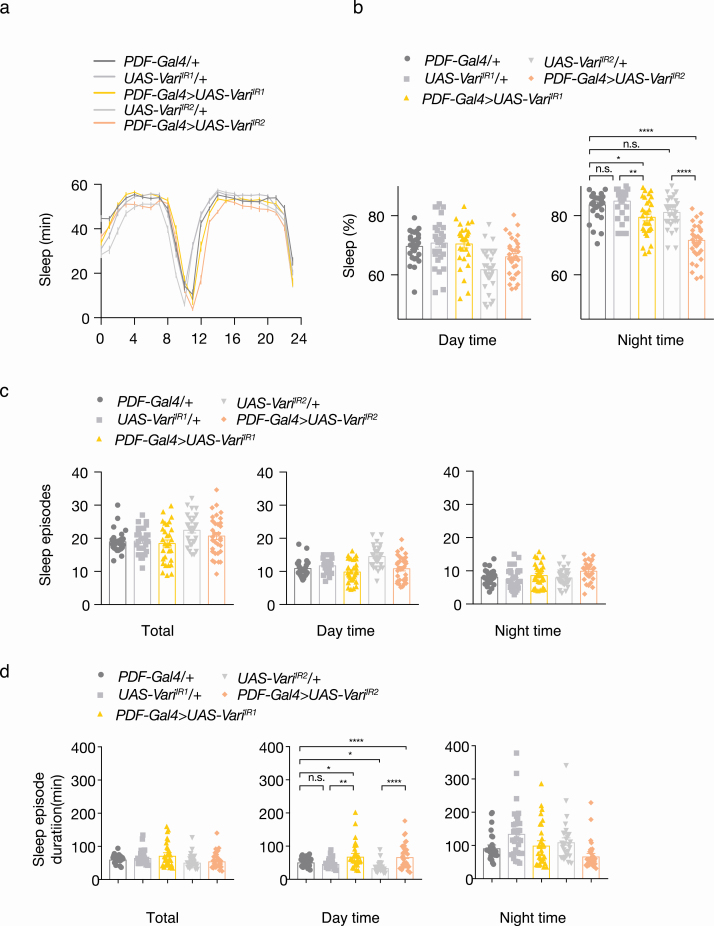
Poor sleep quality can have harmful health consequences. Although many aspects of sleep are heritable, the understandings of genetic factors involved in its physiology remain limited. Here, we performed a genome-wide association study (GWAS) using the Pittsburgh Sleep Quality Index (PSQI) in a multi-ethnic discovery cohort (n = 2868) and found two novel genome-wide loci on chromosomes 2 and 7 associated with global sleep quality. A meta-analysis in 12 independent cohorts (100 000 individuals) replicated the association on chromosome 7 between NPY and MPP6. While NPY is an important sleep gene, we tested for an independent functional role of MPP6. Expression data showed an association of this locus with both NPY and MPP6 mRNA levels in brain tissues. Moreover, knockdown of an orthologue of MPP6 in Drosophila melanogaster sleep center neurons resulted in decreased sleep duration. With convergent evidence, we describe a new locus impacting human variability in sleep quality through known NPY and novel MPP6 sleep genes.
Keywords: MPP6; genome-wide association study; sleep centers; sleep quality.
© Sleep Research Society 2020. Published by Oxford University Press on behalf of the Sleep Research Society. All rights reserved. For permissions, please e-mail journals.permissions@oup.com.
Figures
References
-
- Hobson JA. Sleep is of the brain, by the brain and for the brain. Nature. 2005;437(7063):1254–1256. - PubMed
-
- Lin X, et al. Night-shift work increases morbidity of breast cancer and all-cause mortality: a meta-analysis of 16 prospective cohort studies. Sleep Med. 2015;16(11):1381–1387. - PubMed
-
- Andersen ML, et al. Sleep disturbance and pain: a tale of two common problems. Chest. 2018;154(5):1249–1259. - PubMed
-
- Hertenstein E, et al. Insomnia as a predictor of mental disorders: a systematic review and meta-analysis. Sleep Med Rev. 2019;43:96–105. - PubMed
Publication types
MeSH terms
Substances
Grants and funding
- HHSN268201000031C/HL/NHLBI NIH HHS/United States
- R01 HL046380/HL/NHLBI NIH HHS/United States
- U19 CA203654/CA/NCI NIH HHS/United States
- N01 HC065233/HL/NHLBI NIH HHS/United States
- N01 HC065236/HL/NHLBI NIH HHS/United States
- N01 HC065235/HL/NHLBI NIH HHS/United States
- R01 HL113338/HL/NHLBI NIH HHS/United States
- HHSN268201200008C/HL/NHLBI NIH HHS/United States
- N01 HC065234/HL/NHLBI NIH HHS/United States
- HHSN268201800013I/MD/NIMHD NIH HHS/United States
- K12 DE022793/DE/NIDCR NIH HHS/United States
- P01 NS045685/NS/NINDS NIH HHS/United States
- HHSN261201300005I/CA/NCI NIH HHS/United States
- HHSN268201800012I/HB/NHLBI NIH HHS/United States
- HHSN268201800012C/HL/NHLBI NIH HHS/United States
- HHSN261201300004I/CA/NCI NIH HHS/United States
- HHSN268201000021C/HL/NHLBI NIH HHS/United States
- P30 AG028740/AG/NIA NIH HHS/United States
- R35 HL135818/HL/NHLBI NIH HHS/United States
- N01 HC065237/HL/NHLBI NIH HHS/United States
- HHSN268201200008I/HL/NHLBI NIH HHS/United States
LinkOut - more resources
Full Text Sources
Molecular Biology Databases
Miscellaneous
