

Comparison of pulmonary artery dimensions in swine obtained from catheter angiography, multi-slice computed tomography, 3D-rotational angiography and phase-contrast magnetic resonance angiography
- PMID: 33034866
- PMCID: PMC7545377
- DOI: 10.1007/s10554-020-02043-9
Comparison of pulmonary artery dimensions in swine obtained from catheter angiography, multi-slice computed tomography, 3D-rotational angiography and phase-contrast magnetic resonance angiography
Abstract
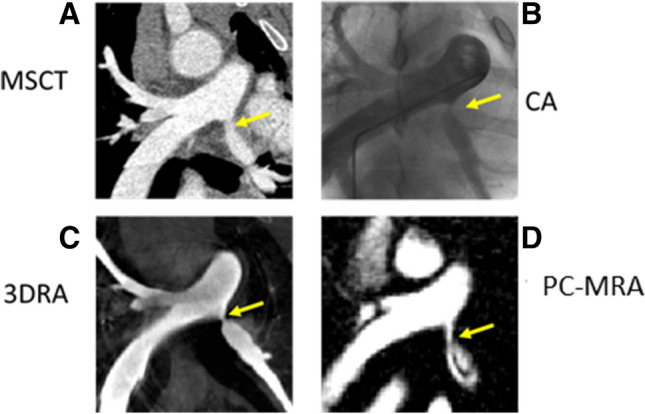
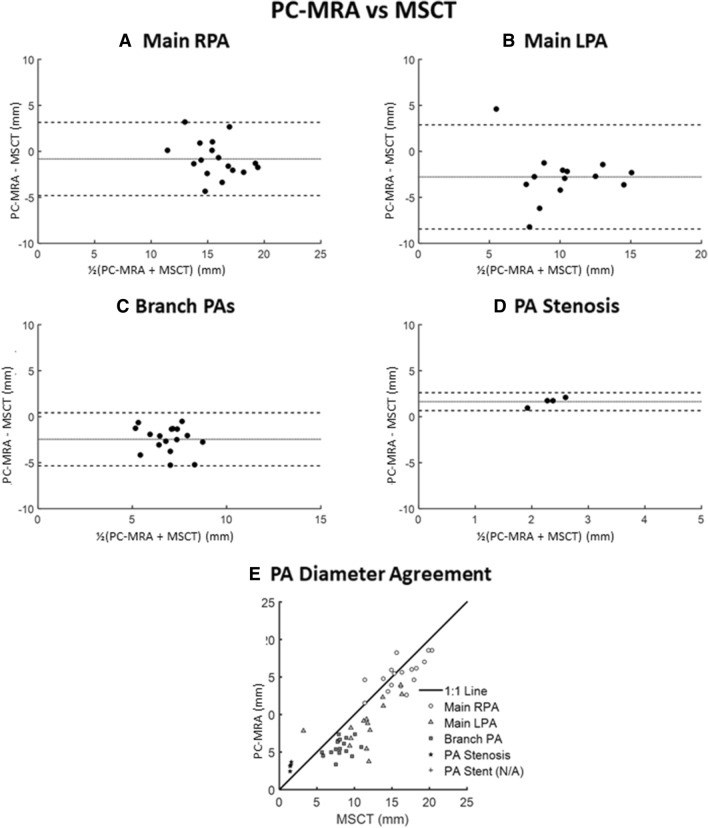
Accurate pulmonary artery (PA) imaging is necessary for management of patients with complex congenital heart disease (CHD). The ability of newer imaging modalities such as 3D rotational angiography (3DRA) or phase-contrast magnetic resonance angiography (PC-MRA) to measure PA diameters has not been compared to established angiography techniques. Measurements of PA diameters (including PA stenosis and PA stents) from 3DRA and non-contrast-enhanced PC-MRA were compared to 2D catheter angiography (CA) and multi-slice computed tomography (MSCT) in a swine CHD model (n = 18). For all PA segments 3DRA had excellent agreement with CA and MSCT (ICC = 0.94[0.91-0.95] and 0.92[0.89-0.94]). 3DRA PA stenosis measures were similar to CA and MSCT and 3DRA was on average within 5% of 10.8 ± 1.3 mm PA stent diameters from CA and MSCT. For compliant PA segments, 3DRA was on average 3-12% less than CA (p < 0.05) and MSCT (p < 0.01) for 6-14 mm vessels. PC-MRA could not reliably visualize stents and distal PA vessels and only identified 34% of all assigned measurement sites. For measured PA segments, PC-MRA had good agreement to CA and MSCT (ICC = 0.87[0.77-0.92] and 0.83[0.72-0.90]) but PC-MRA overestimated stenosis diameters and underestimated compliant PA diameters. Excellent CA-MSCT PA diameter agreement (ICC = 0.95[0.93-0.96]) confirmed previous data in CHD patients. There was little bias in PA measurements between 3DRA, CA and MSCT in stenotic and stented PAs but 3DRA underestimates measurements of compliant PA regions. Accurate PC-MRA imaging was limited to unstented proximal PA anatomy.
Keywords: Congenital heart disease; Pulmonary artery imaging; Pulmonary artery stenosis.
Figures


Similar articles
-
Stent interventions for pulmonary artery stenosis improve bi-ventricular flow efficiency in a swine model.J Cardiovasc Magn Reson. 2021 Feb 25;23(1):13. doi: 10.1186/s12968-021-00709-4. J Cardiovasc Magn Reson. 2021. PMID: 33627121 Free PMC article.
-
Consequences of an early catheter-based intervention on pulmonary artery growth and right ventricular myocardial function in a pig model of pulmonary artery stenosis.Catheter Cardiovasc Interv. 2018 Jul;92(1):78-87. doi: 10.1002/ccd.27593. Epub 2018 Mar 30. Catheter Cardiovasc Interv. 2018. PMID: 29602248
-
The use of three-dimensional rotational angiography to assess the pulmonary circulation following cavo-pulmonary connection in patients with single ventricle.Catheter Cardiovasc Interv. 2012 Nov 15;80(6):922-30. doi: 10.1002/ccd.23461. Epub 2012 Mar 14. Catheter Cardiovasc Interv. 2012. PMID: 22419358
-
Cross-sectional imaging of congenital pulmonary artery anomalies.Int J Cardiovasc Imaging. 2019 Aug;35(8):1535-1548. doi: 10.1007/s10554-019-01643-4. Epub 2019 Jun 7. Int J Cardiovasc Imaging. 2019. PMID: 31175525 Review.
-
[Diagnosis of renal artery stenosis with magnetic resonance angiography and stenosis quantification].J Mal Vasc. 2000 Dec;25(5):312-320. J Mal Vasc. 2000. PMID: 11148391 Review. French.
Cited by
-
Application and Evaluation of Spiral CT in the Diagnosis of Congenital Heart Disease in Children.Int J Gen Med. 2025 Apr 23;18:2217-2224. doi: 10.2147/IJGM.S506437. eCollection 2025. Int J Gen Med. 2025. PMID: 40291397 Free PMC article.
-
Non-invasive MRI Derived Hemodynamic Simulation to Predict Successful vs. Unsuccessful Catheter Interventions for Branch Pulmonary Artery Stenosis: Proof-of-Concept and Experimental Validation in Swine.Cardiovasc Eng Technol. 2021 Oct;12(5):494-504. doi: 10.1007/s13239-021-00543-w. Epub 2021 May 18. Cardiovasc Eng Technol. 2021. PMID: 34008077 Free PMC article.
-
Accelerated Estimation of Pulmonary Artery Stenosis Pressure Gradients with Distributed Lumped Parameter Modeling vs. 3D CFD with Instantaneous Adaptive Mesh Refinement: Experimental Validation in Swine.Ann Biomed Eng. 2021 Sep;49(9):2365-2376. doi: 10.1007/s10439-021-02780-5. Epub 2021 May 4. Ann Biomed Eng. 2021. PMID: 33948748 Free PMC article.
-
MSCTA imaging analysis of autologous arteriovenous fistula dysfunction in maintenance hemodialysis patients.Am J Transl Res. 2024 Mar 15;16(3):955-963. doi: 10.62347/YEGN9292. eCollection 2024. Am J Transl Res. 2024. PMID: 38586097 Free PMC article.
-
Pulmonary 4D-flow MRI imaging in landrace pigs under rest and stress.Int J Cardiovasc Imaging. 2024 Jul;40(7):1511-1524. doi: 10.1007/s10554-024-03132-9. Epub 2024 May 31. Int J Cardiovasc Imaging. 2024. PMID: 38819601 Free PMC article.
References
-
- Elzenga NJ, von Suylen RJ, Frohn-Mulder I, Essed CE, Bos E, Quaegebeur JM. Juxtaductal pulmonary artery coarctation. An underestimated cause of branch pulmonary artery stenosis in patients with pulmonary atresia or stenosis and a ventricular septal defect. J Thorac Cardiovasc Surg. 1990;100(3):416–24. doi: 10.1016/S0022-5223(19)35534-5. - DOI - PubMed
Publication types
MeSH terms
Grants and funding
LinkOut - more resources
Full Text Sources
Medical
