. 2020 Oct;128(10):107004.
doi: 10.1289/EHP7246. Epub 2020 Oct 9.

Fine Particulate Matter Exposure and Cancer Incidence: Analysis of SEER Cancer Registry Data from 1992-2016

Affiliations

Fine Particulate Matter Exposure and Cancer Incidence: Analysis of SEER Cancer Registry Data from 1992-2016

Nathan C Coleman et al. Environ Health Perspect. 2020 Oct.

Abstract

Background: Previous research has identified an association between fine particulate matter (PM2.5) air pollution and lung cancer. Most of the evidence for this association, however, is based on research using lung cancer mortality, not incidence. Research that examines potential associations between PM2.5 and incidence of non-lung cancers is limited.

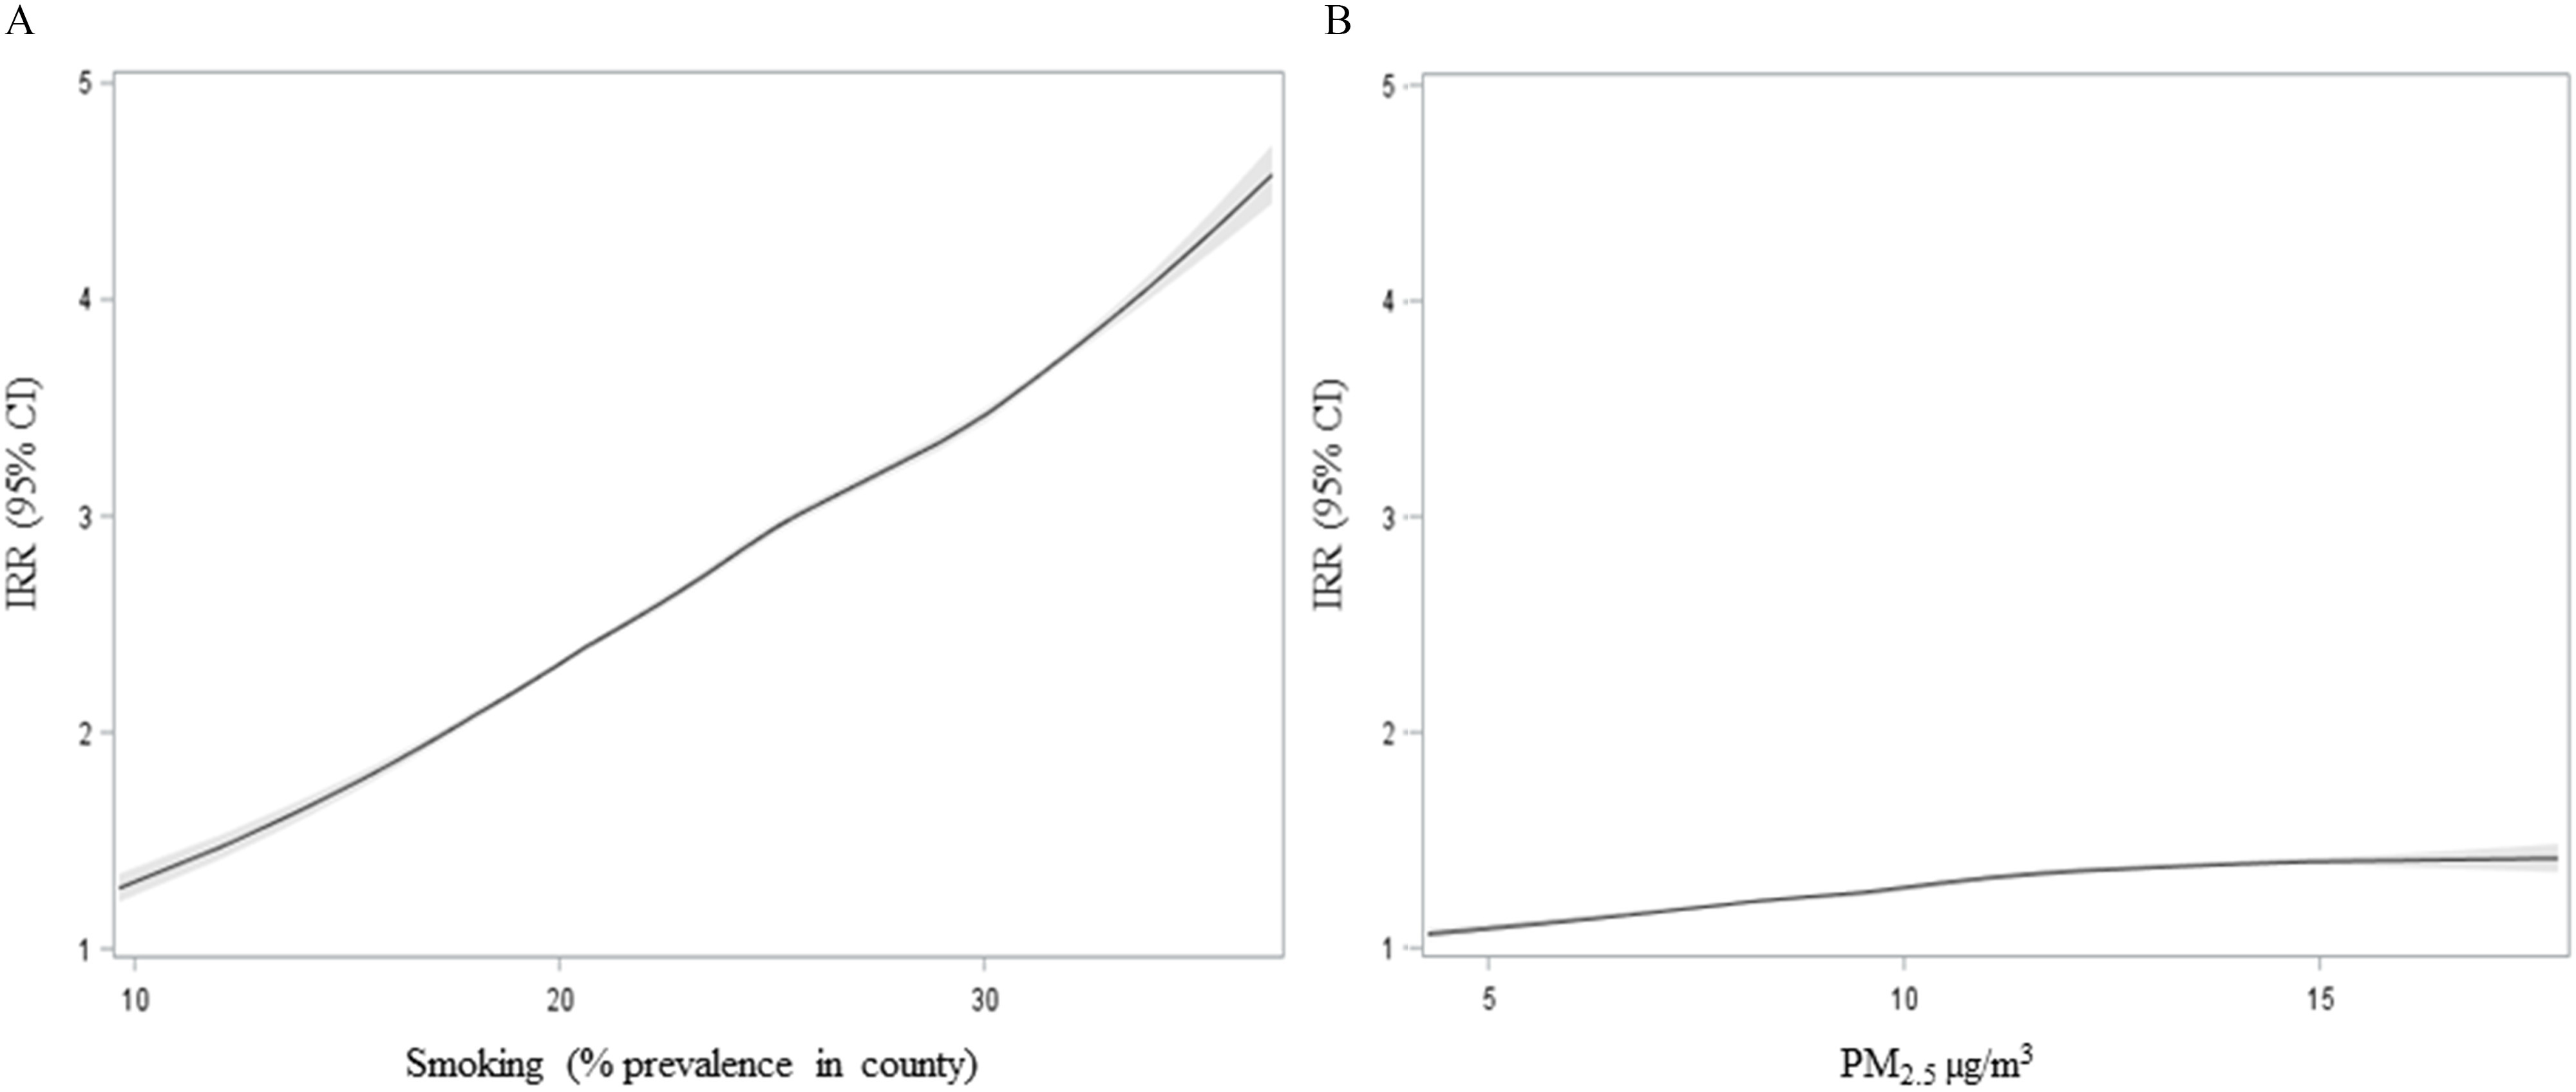
Objectives: The primary purpose of this study was to evaluate the association between the incidence of cancer and exposure to PM2.5 using >8.5 million cases of cancer incidences from U.S. registries. Secondary objectives include evaluating the sensitivity of the associations to model selection, spatial control, and latency period as well as estimating the exposure-response relationship for several cancer types.

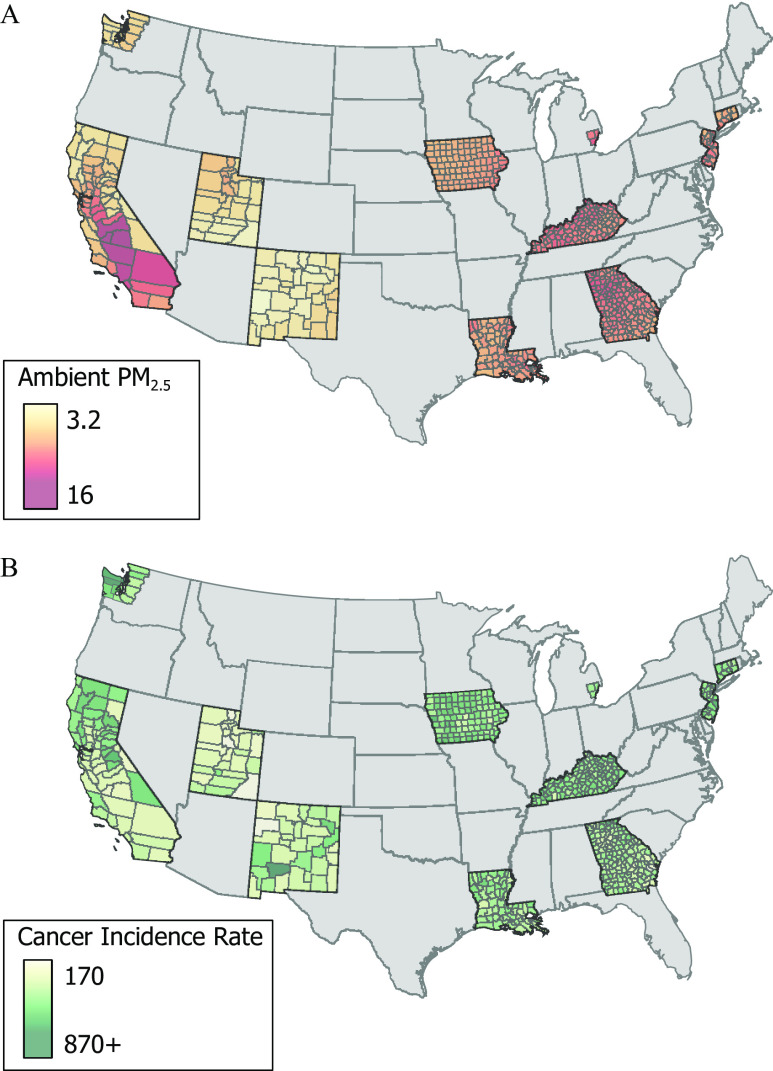
Methods: Surveillance, Epidemiology, and End Results (SEER) program data were used to calculate incidence rates for various cancer types in 607 U.S. counties. County-level PM2.5 concentrations were estimated using integrated empirical geographic regression models. Flexible semi-nonparametric regression models were used to estimate associations between PM2.5 and cancer incidence for selected cancers while controlling for important county-level covariates. Primary time-independent models using average incidence rates from 1992-2016 and average PM2.5 from 1988-2015 were estimated. In addition, time-varying models using annual incidence rates from 2002-2011 and lagged moving averages of annual estimates for PM2.5 were also estimated.

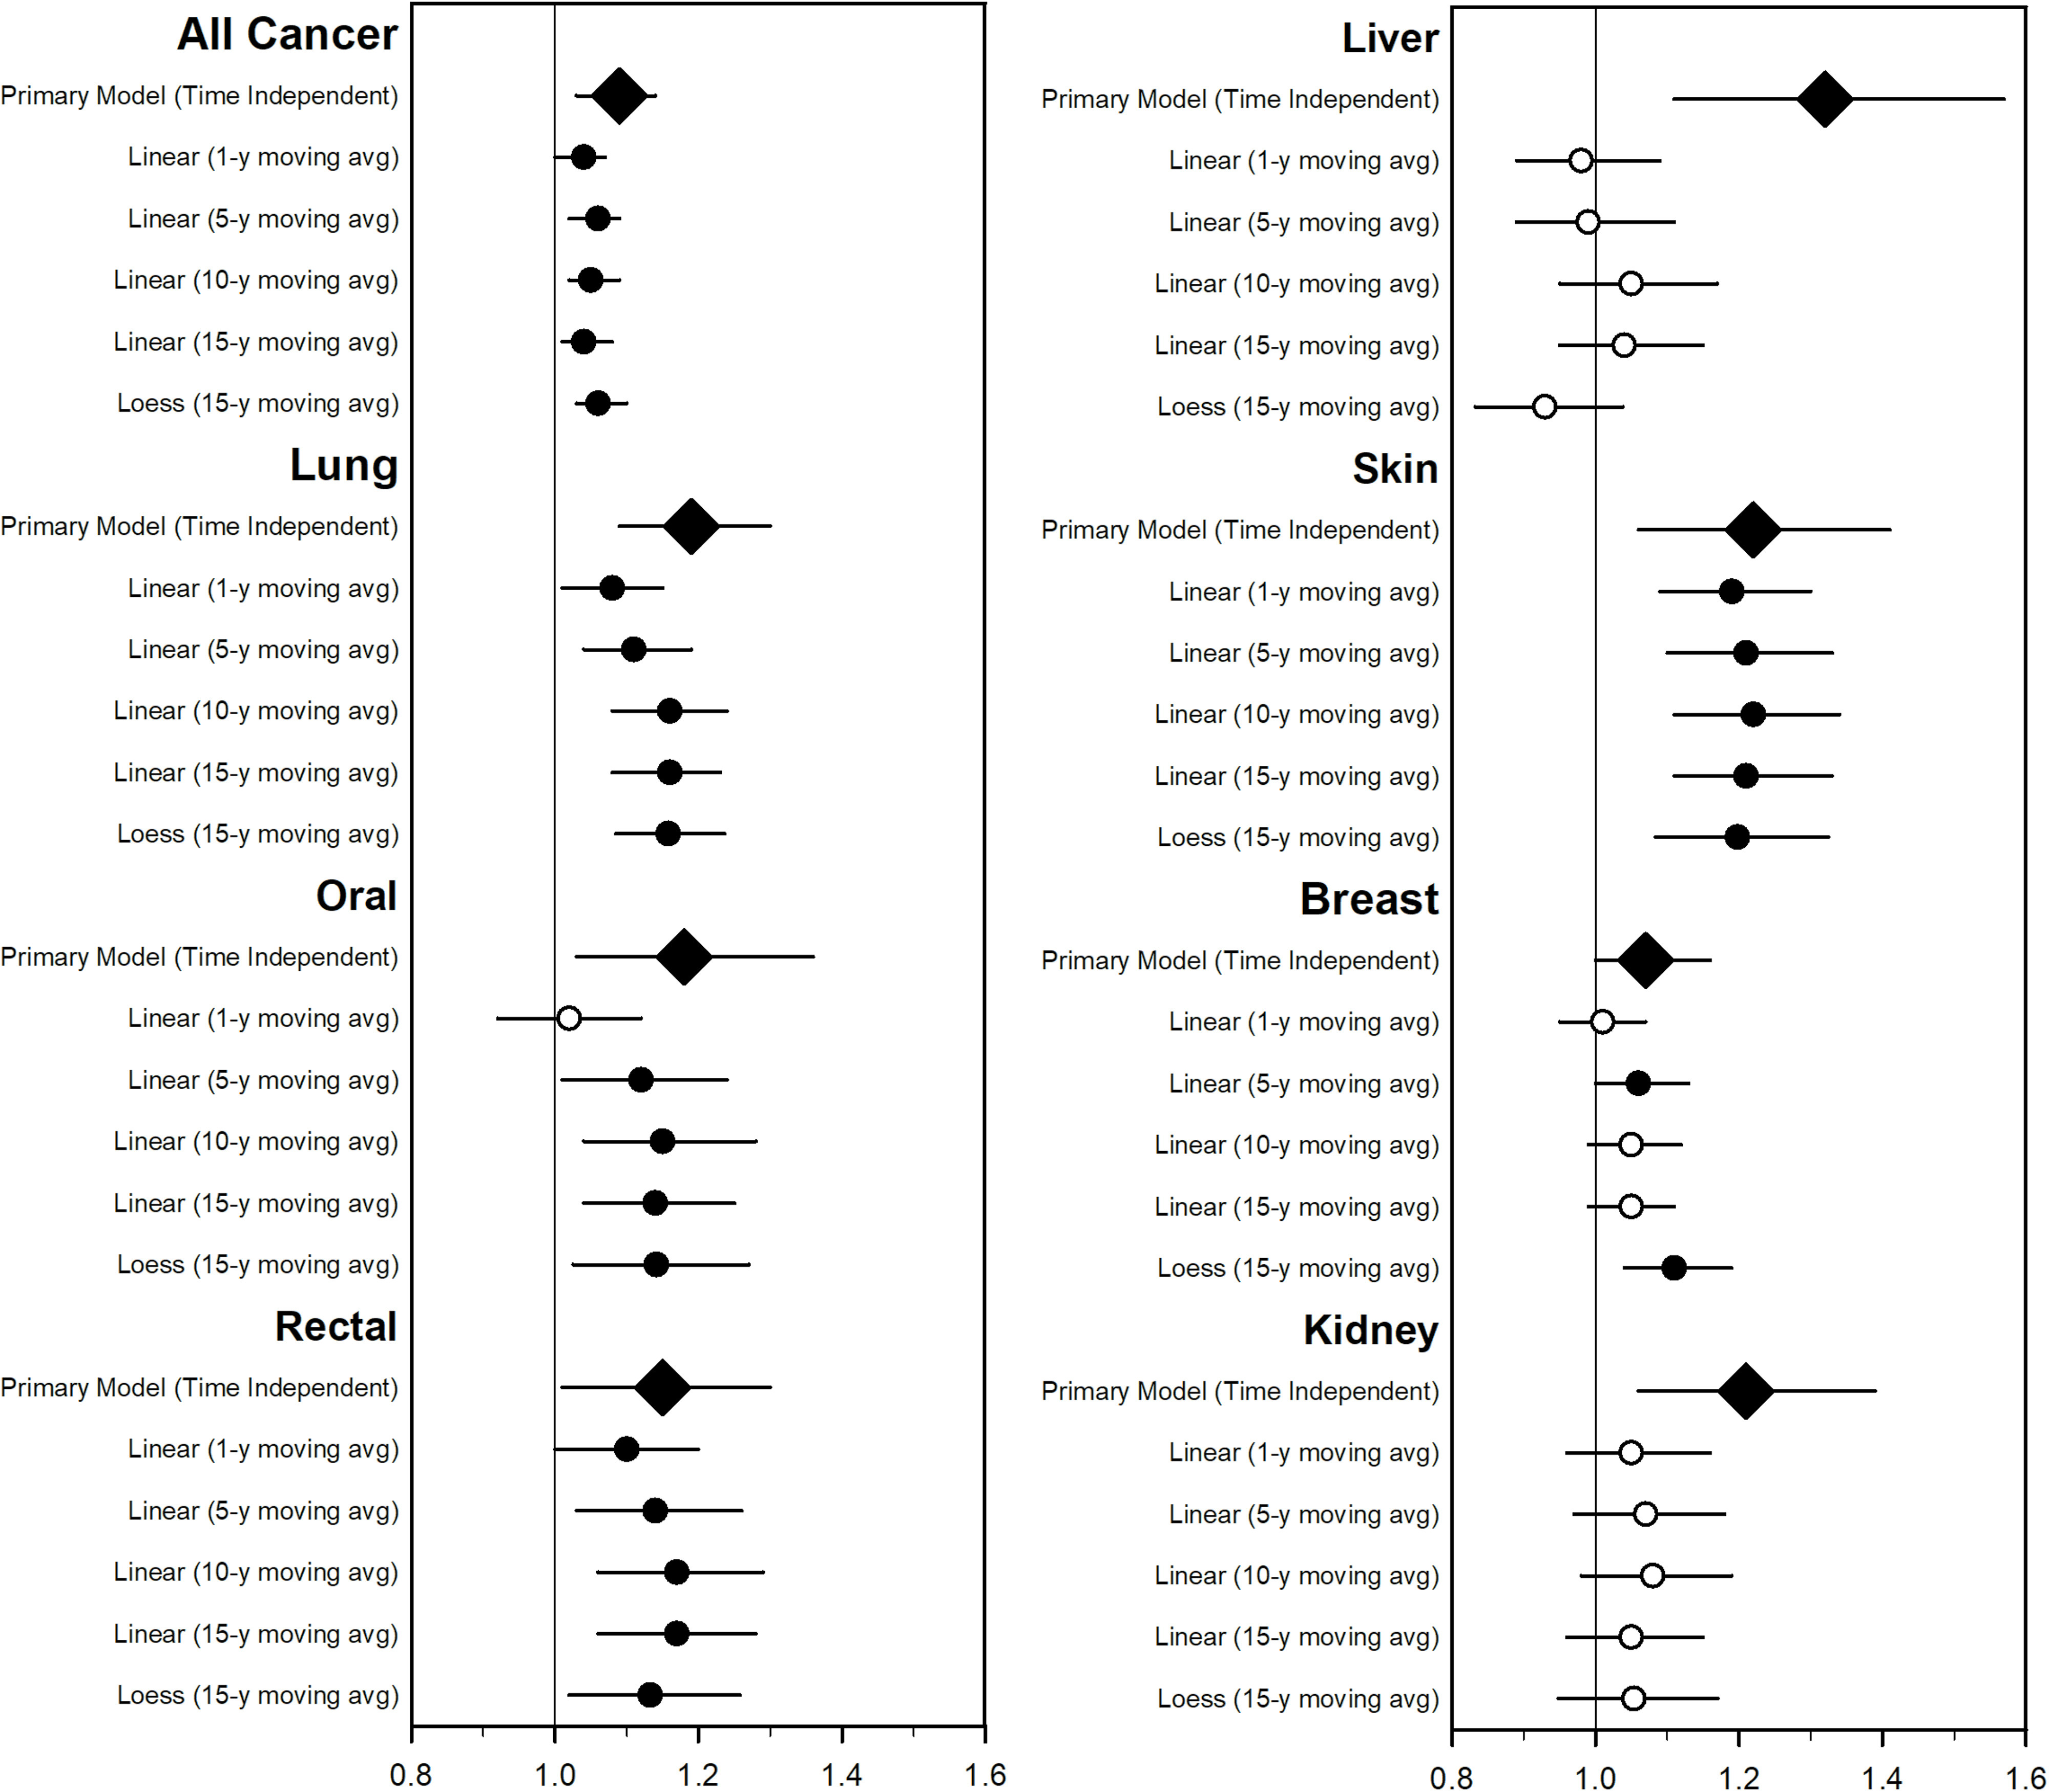
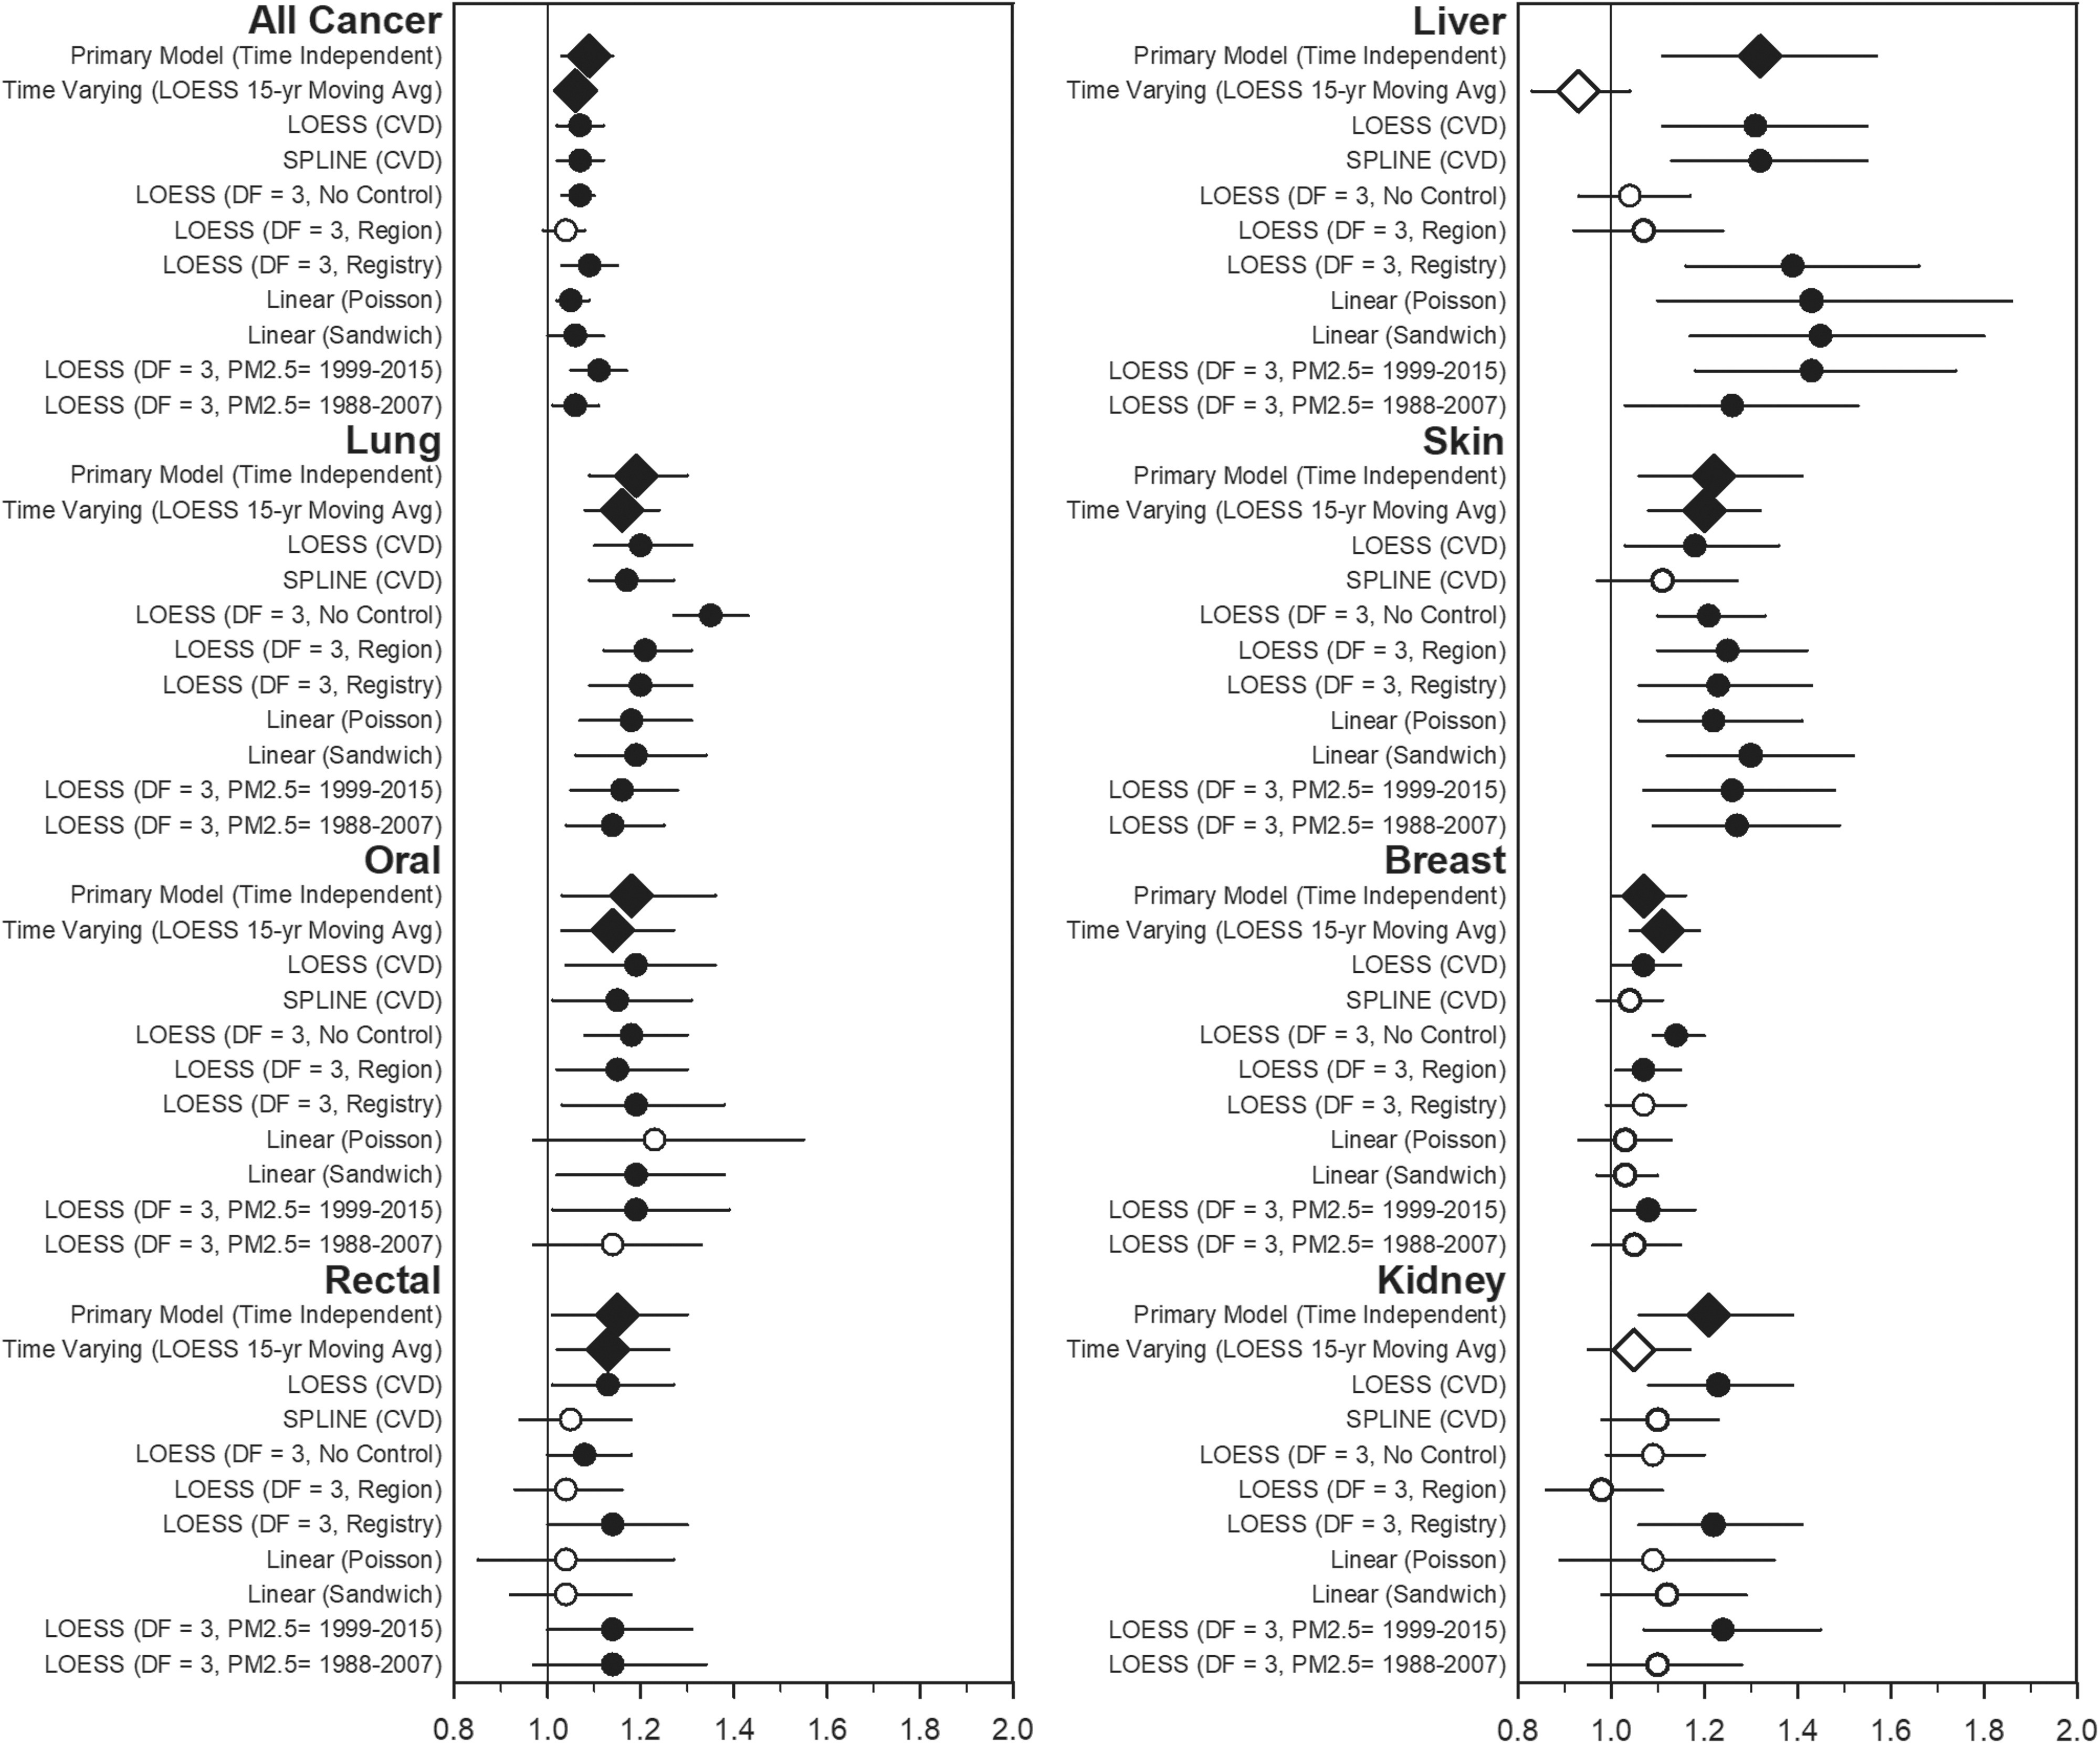
Results: The incidences of all cancer and lung cancer were consistently associated with PM2.5. The incident rate ratios (IRRs), per 10-μg/m3 increase in PM2.5, for all and lung cancer were 1.09 (95% CI: 1.03, 1.14) and 1.19 (95% CI: 1.09, 1.30), respectively. Less robust associations were observed with oral, rectal, liver, skin, breast, and kidney cancers.

Discussion: Exposure to PM2.5 air pollution contributes to lung cancer incidence and is potentially associated with non-lung cancer incidence. https://doi.org/10.1289/EHP7246.


Figures

Figure 1A depicts estimated population weighted mean for 1988 to 2015 for counties in the Surveillance Epidemiology End Results database for Ambient particulate matter 2.5, in micrograms per meter cubed, ranging from 3.2 to 16 in increments of 12.8. Figure 1B depicts average incidents rate of all cancer for counties in the Surveillance Epidemiology End Results database for Cancer Incidence Rate, ranging from 170 to 870 plus in increments of 700.
Figure 1.
Estimated (A) population-weighted mean (1988–2015) PM2.5 concentrations (μg/m3) and (B) average incidents rate of all cancer for counties in the SEER database. Note: PM2.5, particles <2.5μm in aerodynamic diameter; SEER, Surveillance, Epidemiology, and End Results (SEER) program.
Figure 2 is a set of two forest plots compares the incident rate ratios estimates for the base model with estimates from time-varying models using various lagged moving average estimates (1-, 5-, 10-, and 15-y) of exposure for all cancers that were nominally significant at a 0.05 level in the primary analysis (all, lung, oral, rectal, liver, skin, breast, and kidney cancers).
Figure 2.
Estimated incident rate ratios (95% CIs) associated with a 10-μg/m3 increase of PM2.5 and selected cancer type incidence from 2002–2011 using time-varying models and compared with the base (time-independent) model. Numerical estimates are included in Table S2. Open circles represent that estimates were not statistically significant at a 0.05 level. Diamonds represent the base (time-independent) model. Models adjusted for percentage of the county in various age buckets; percentage male; percentage white, black, Hispanic, and other; percentage who did not graduate high school, graduated high school, or obtained more education than high school; median income, rent, and home value; percentage below 150% poverty; percentage working class; percentage unemployed; percentage living in a rural area; percentage smokers; percentage alcohol consumption; percentage who are physically active; and percentage of individuals in a county who are obese as well as indicator variables for urban/rural, state, and year. The primary (time-independent) model used a LOESS model with 3 df for all covariates. The linear models used linear yearly estimates for all covariates and 1-, 5-, 10-, and 15-y moving average estimates for PM2.5 exposure. The LOESS model was a locally weighted smoothing model with 3 df for all covariates with a 15-y moving average lagged estimate for PM2.5 exposure. Note: CI, confidence interval; df, degrees of freedom; PM2.5, particles <2.5μm in aerodynamic diameter; LOESS, locally weighted smoothing model.
Figure 3 is a set of two forest plots that illustrate the sensitivity analysis performed on those cancer sites that were statistically significant based on the nominal lowercase italic p values in the primary model.
Figure 3.
Estimated incident rate ratios and 95% CIs associated with a 10-μg/m3 increase of PM2.5 from 1988–2015 and average selected cancer type incidence in SEER counties from 1992–2016 across various models. Numerical estimates are included in Table S3. Open circles represent that estimates were not statistically significant at a 0.05 level. Diamonds represent the primary time-independent and time-varying models. Models are adjusted for percentage of the county in various age buckets; percentage male; percentage white, black, Hispanic, and other; percentage who did not graduate high school, graduated high school, or obtained more education than high school; median income, rent, and home value; percentage below 150% poverty; percentage working class; percentage unemployed; percentage living in a rural area; percentage smokers; percentage who consume alcohol; percentage who are physically active; and percentage of individuals in a county who are obese as well as indicator variables for urban/rural and state. All models use the average incidence rate from 1992–2016 (primary time-independent model) unless indicated otherwise. The models include the following: the primary (time-independent) model, a LOESS model with 3 df was used for all covariates; a time-varying mode LOESS model with 3 df for all covariates with an additional indicator variable for year that included a 15-y moving average lagged estimate for PM2.5 to estimate exposure for individuals living in SEER counties from 2002–2011; a cross-validated LOESS model for all covariates; a cross-validated spline model for all covariates; a LOESS model with 3 df for all covariates, with the state removed from the model; a LOESS model with 3 df for all covariates, with the state removed from the model and replaced with a region control; a LOESS model with 3 df for all covariates, with the state removed from the model and replaced with a SEER registry control; a linear regression model with only linear terms for the covariates, assuming a Poisson distribution; a linear regression model with only linear terms for the covariates and with the sandwich method used to estimate standard errors; a LOESS model with 3 df for all covariates, with mean PM2.5 exposure from 1999–2015; and a LOESS model with 3 df for all covariates, with mean PM2.5 exposure from 1988–2007 on SEER counties from 2008–2016. Note: CI, confidence interval; df, degrees of freedom; LOESS, locally weighted smoothing model; PM2.5, particles <2.5μm in aerodynamic diameter; SEER, Surveillance, Epidemiology, and End Results (SEER) program.
Figures 4A and 4B are two line graphs plotting incident rate ratios (95 percent Confidence Intervals), ranging from 1 to 5 in unit increments (y-axis) across Smoking (percent prevalence in county), ranging from 10 to 30 in increments of 10 and Particulate Matter begin subscript 2.5 end subscript microgram per meter cubed, ranging from 5 to 15 in increments of 5 (x-axis), respectively.
Figure 4.
Estimated response relationship between lung cancer incidence and (A) smoking and (B) PM2.5. Smoking is estimated as the average percentage of the county’s population that identified as smokers from 1996–2012. PM2.5 is measured as the population-weighted average concentration in a county from 1988–2015. A locally weighted smoothing (LOESS) model with 3 df to estimate nonlinearity is used. Note: df, degrees of freedom; PM2.5, particles <2.5μm in aerodynamic diameter.

References

    1. Ancona C, Badaloni C, Mataloni F, Bolignano A, Bucci S, Cesaroni G, et al. . 2015. Mortality and morbidity in a population exposed to multiple sources of air pollution: a retrospective cohort study using air dispersion models. Environ Res 137:467–474, PMID: 25701728, 10.1016/j.envres.2014.10.036. - DOI - PubMed
    1. Bai L, Shin S, Burnett RT, Kwong JC, Hystad P, van Donkelaar A, et al. . 2020. Exposure to ambient air pollution and the incidence of lung cancer and breast cancer in the Ontario Population Health and Environment Cohort. Int J Cancer 146(9):2450–2459, PMID: 31304979, 10.1002/ijc.32575. - DOI - PubMed
    1. Benjamini Y, Hochberg Y. 1995. Controlling the false discovery rate: a practical and powerful approach to multiple testing. J R Stat Soc Series B Stat Methodol 57(1):289–300, 10.1111/j.2517-6161.1995.tb02031.x. - DOI
    1. Chu Y-H, Kao S-W, Tantoh DM, Ko P-C, Lan S-J, Liaw Y-P. 2019. Association between fine particulate matter and oral cancer among Taiwanese men. J Investig Med 67(1):34–38, PMID: 30301867, 10.1136/jim-2016-000263. - DOI - PMC - PubMed
    1. Coleman NC, Burnett RT, Higbee JD, Lefler JS, Merrill RM, Ezzati M, et al. . 2020. Cancer mortality risk, fine particulate air pollution, and smoking in a large representative cohort of US adults. Cancer Causes Control 31(8):767–776, PMID: 32462559, 10.1007/s10552-020-01317-w. - DOI - PubMed