. 2020 Oct 15;183(2):474-489.e17.
doi: 10.1016/j.cell.2020.08.049. Epub 2020 Oct 8.

Lactate Elicits ER-Mitochondrial Mg2+ Dynamics to Integrate Cellular Metabolism

Affiliations

Lactate Elicits ER-Mitochondrial Mg2+ Dynamics to Integrate Cellular Metabolism

Cassidy C Daw et al. Cell. .

Abstract

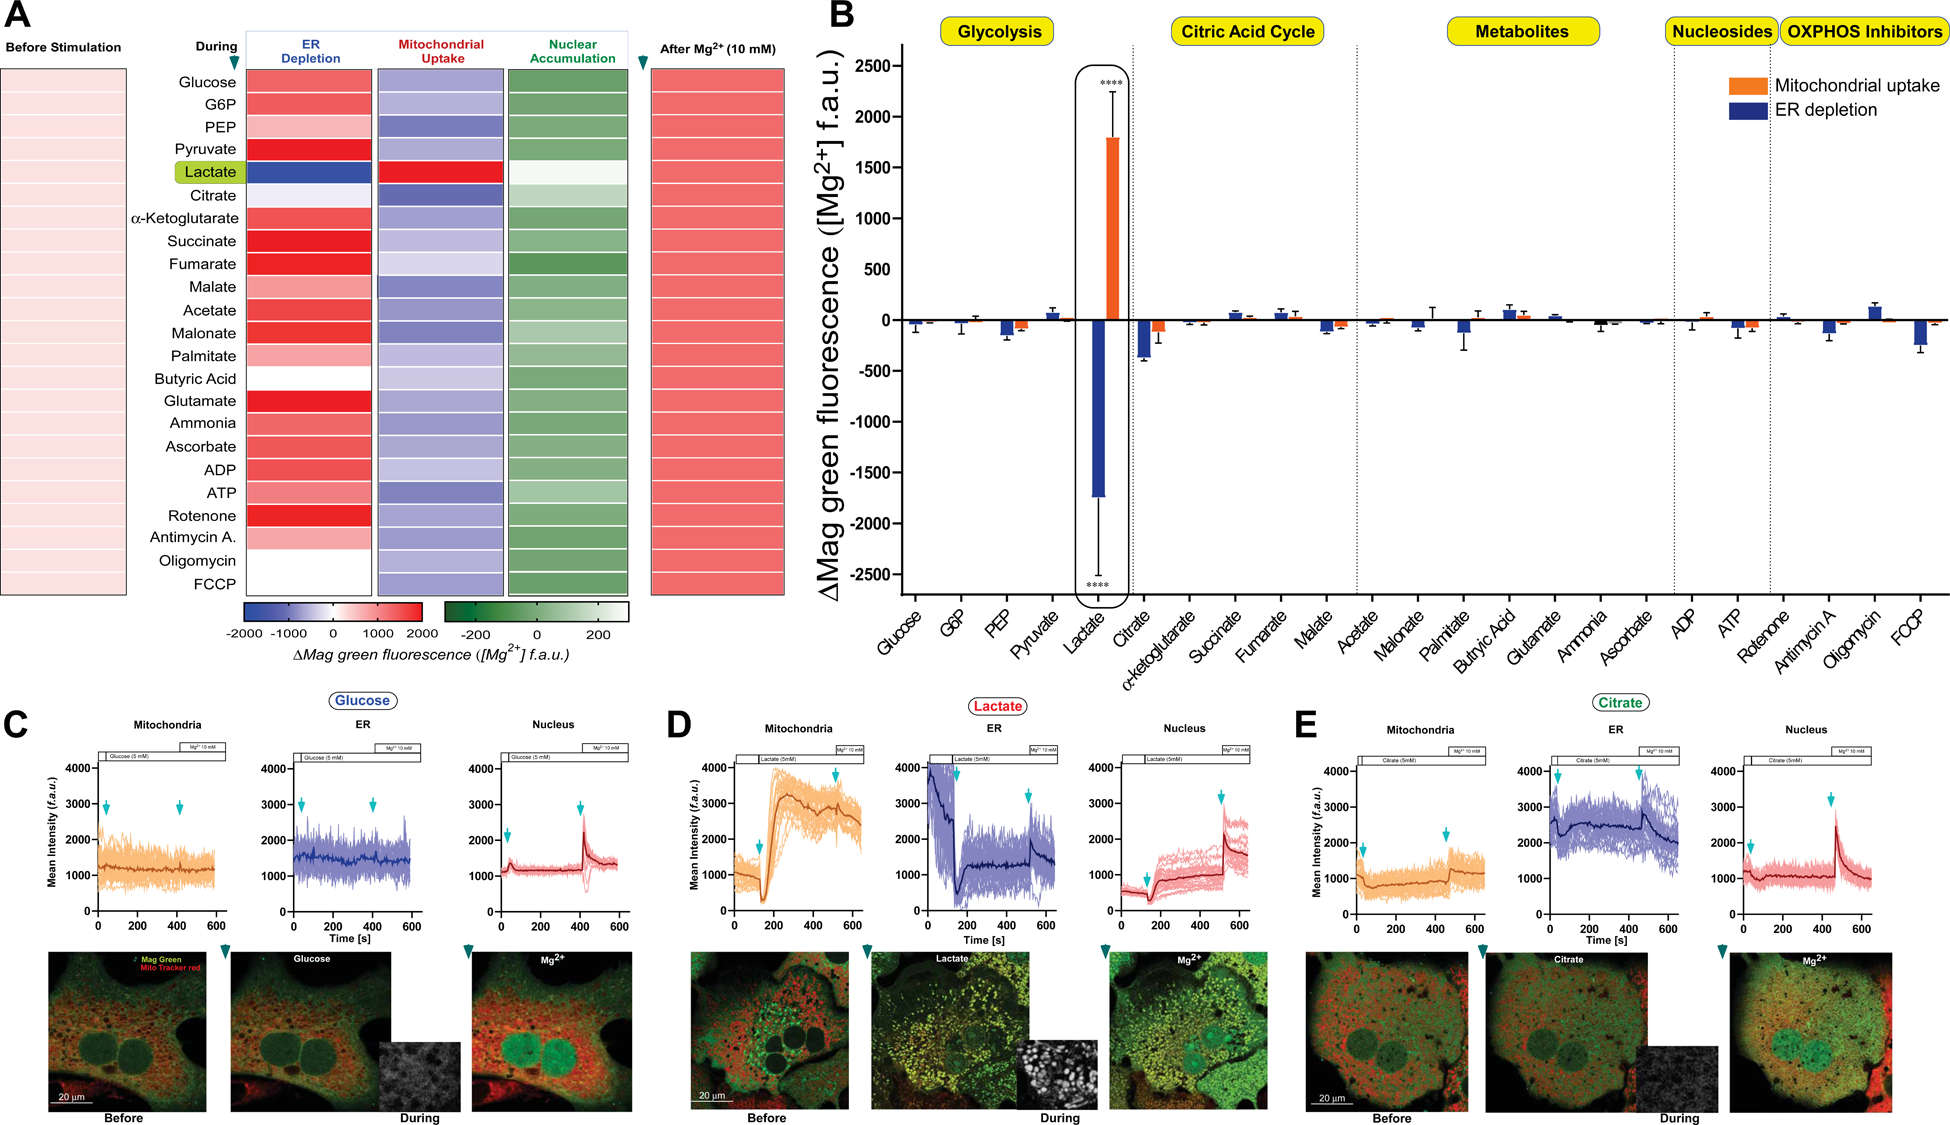
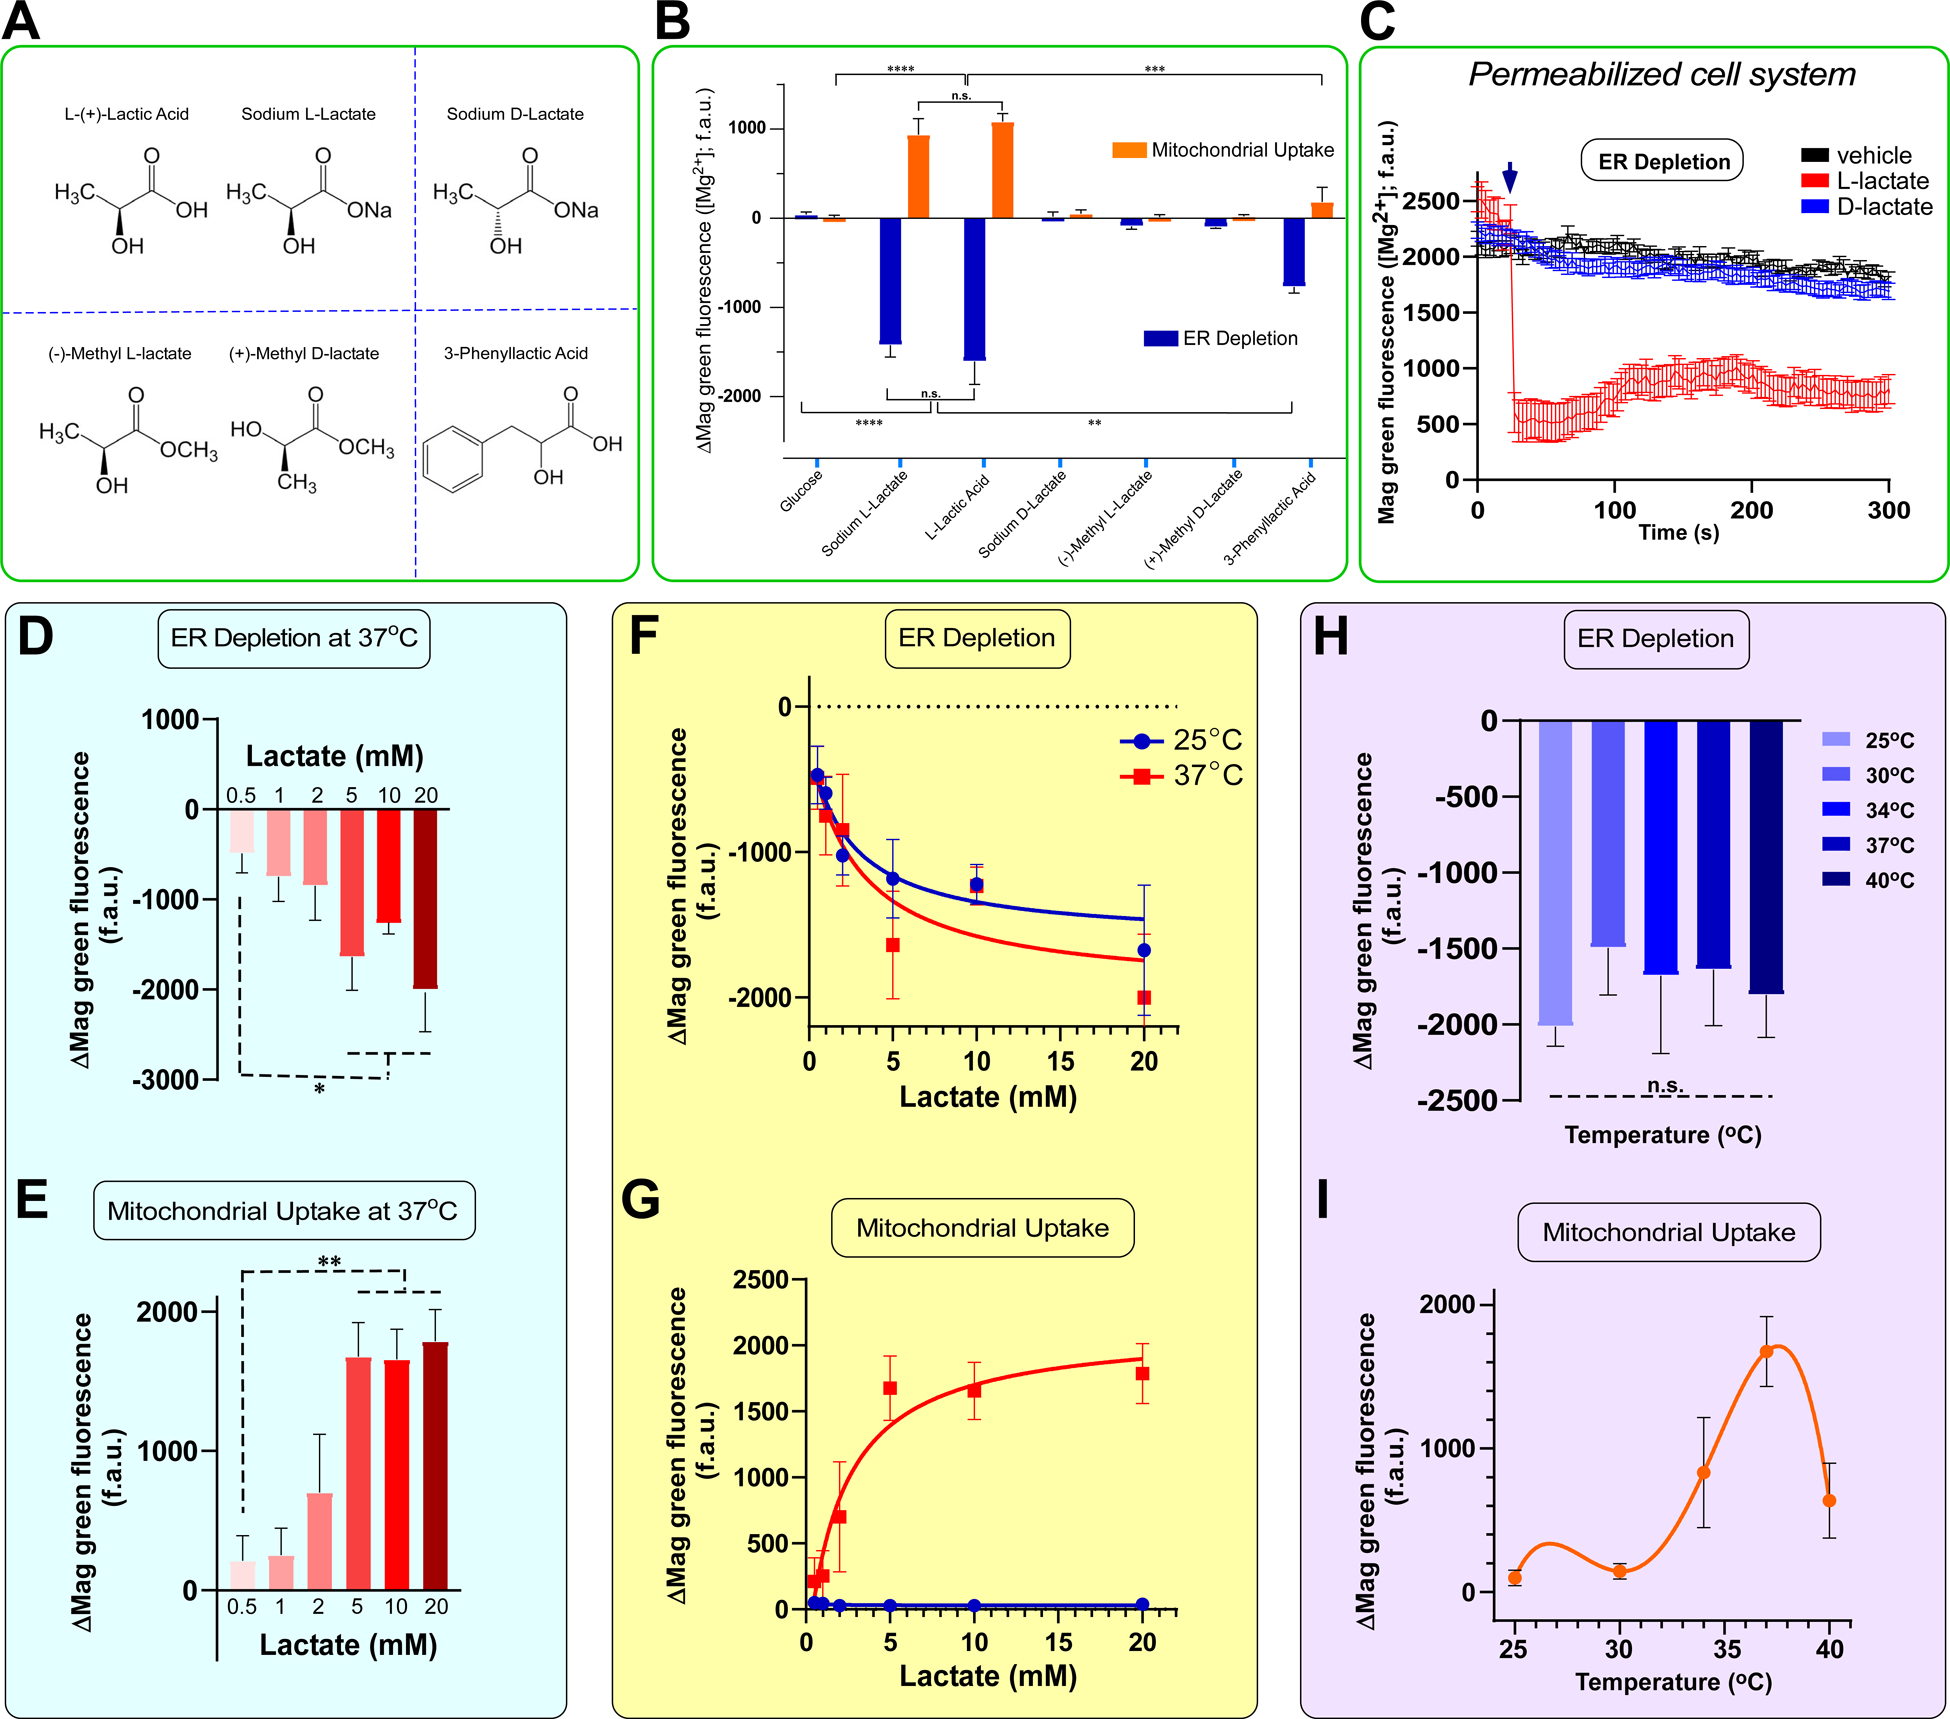
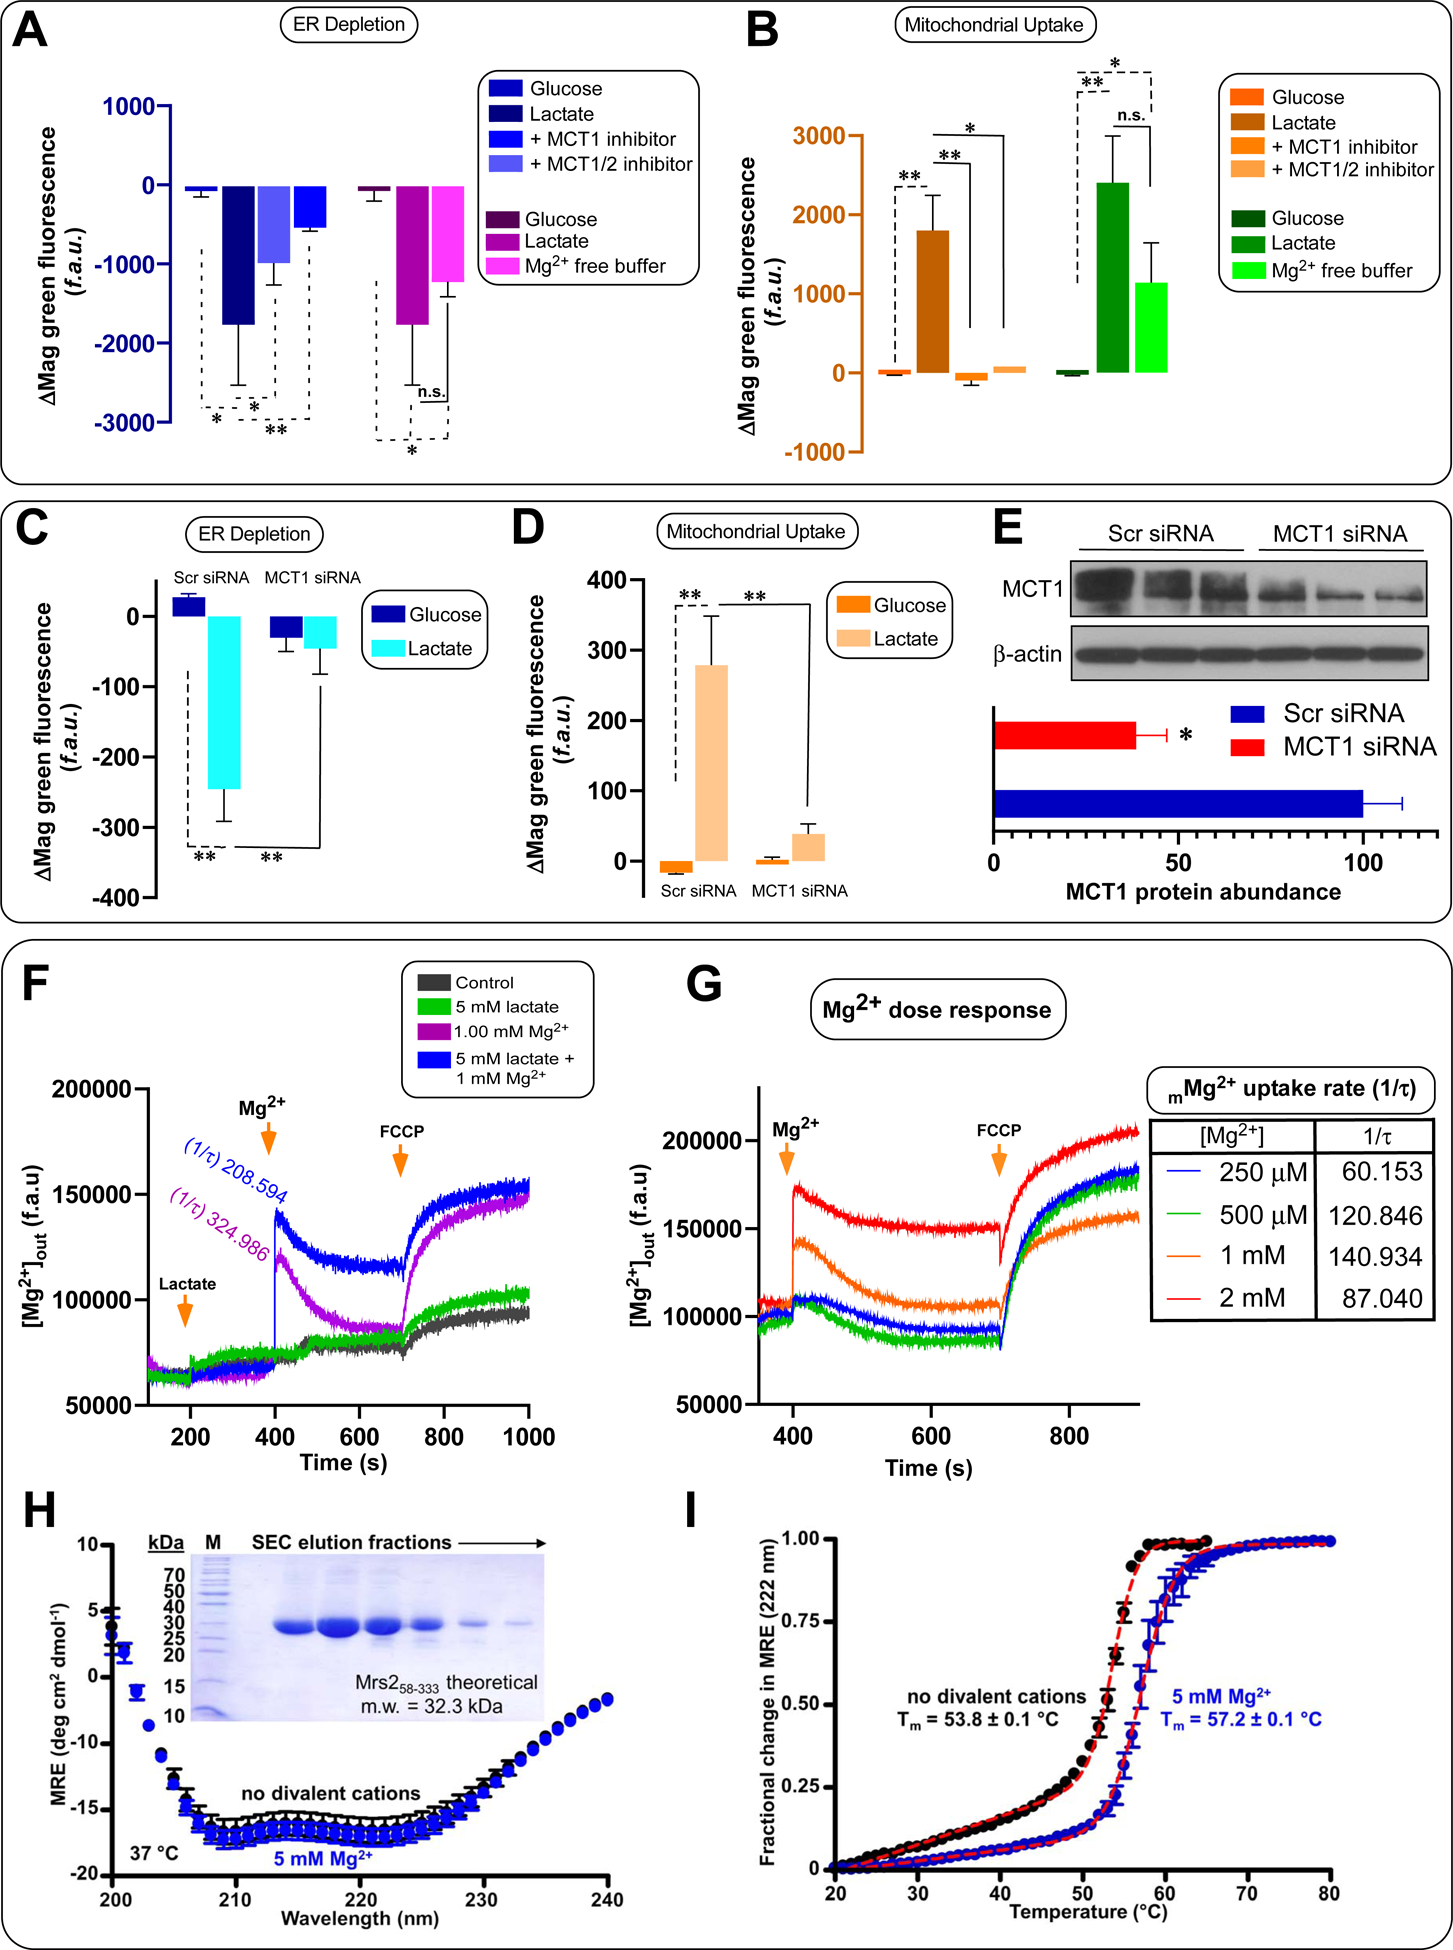
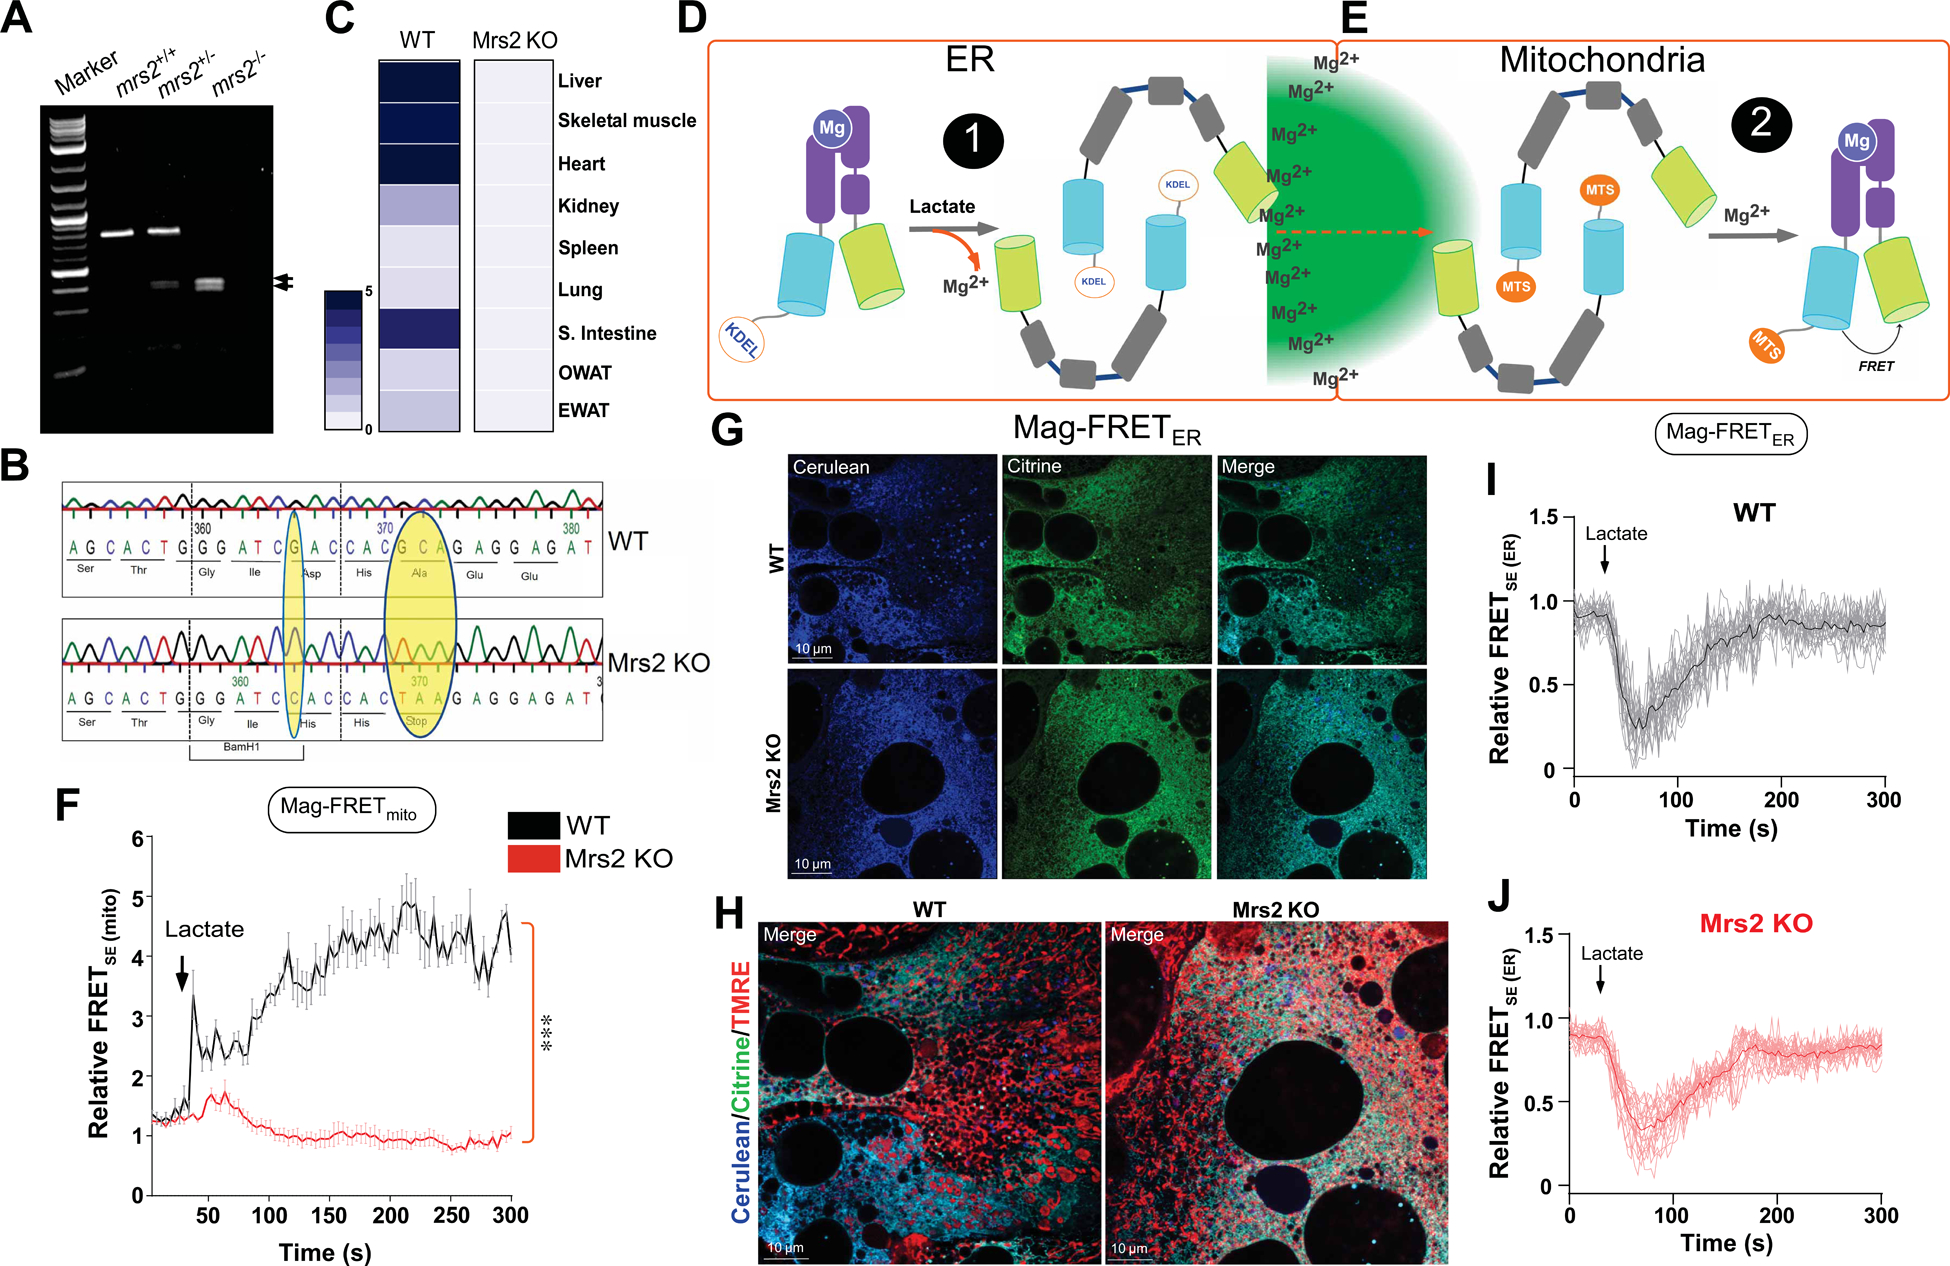
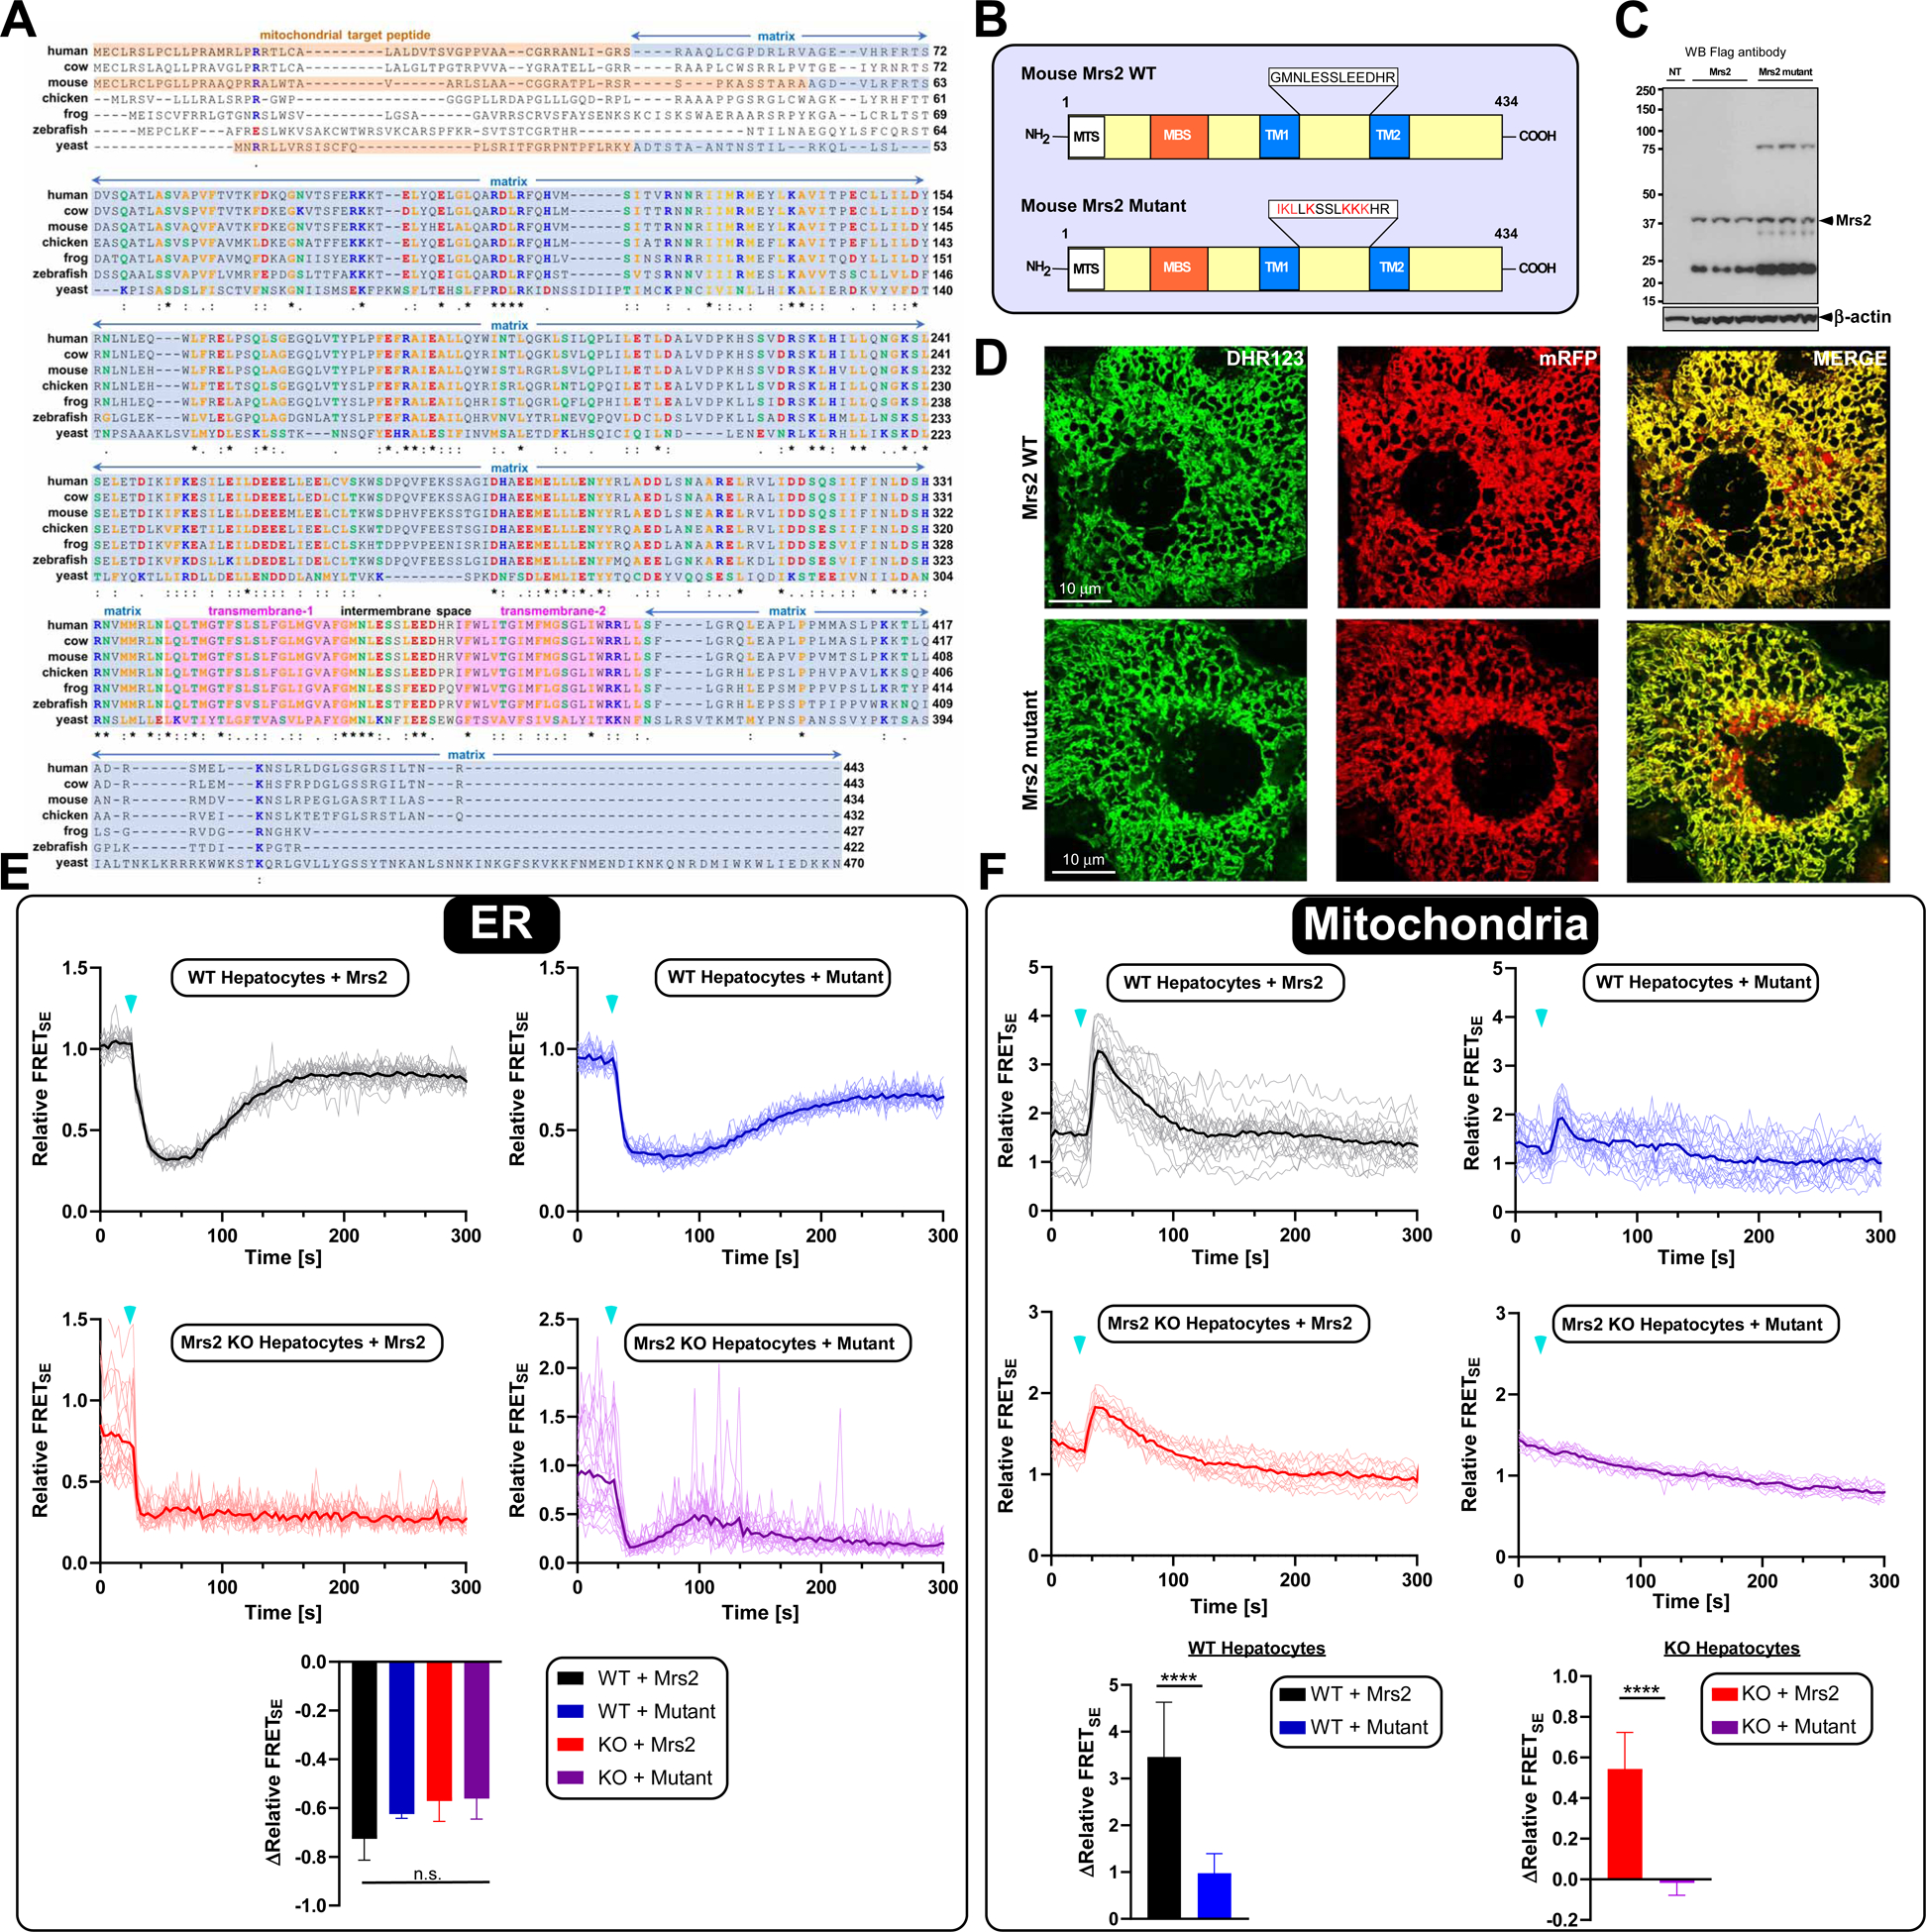
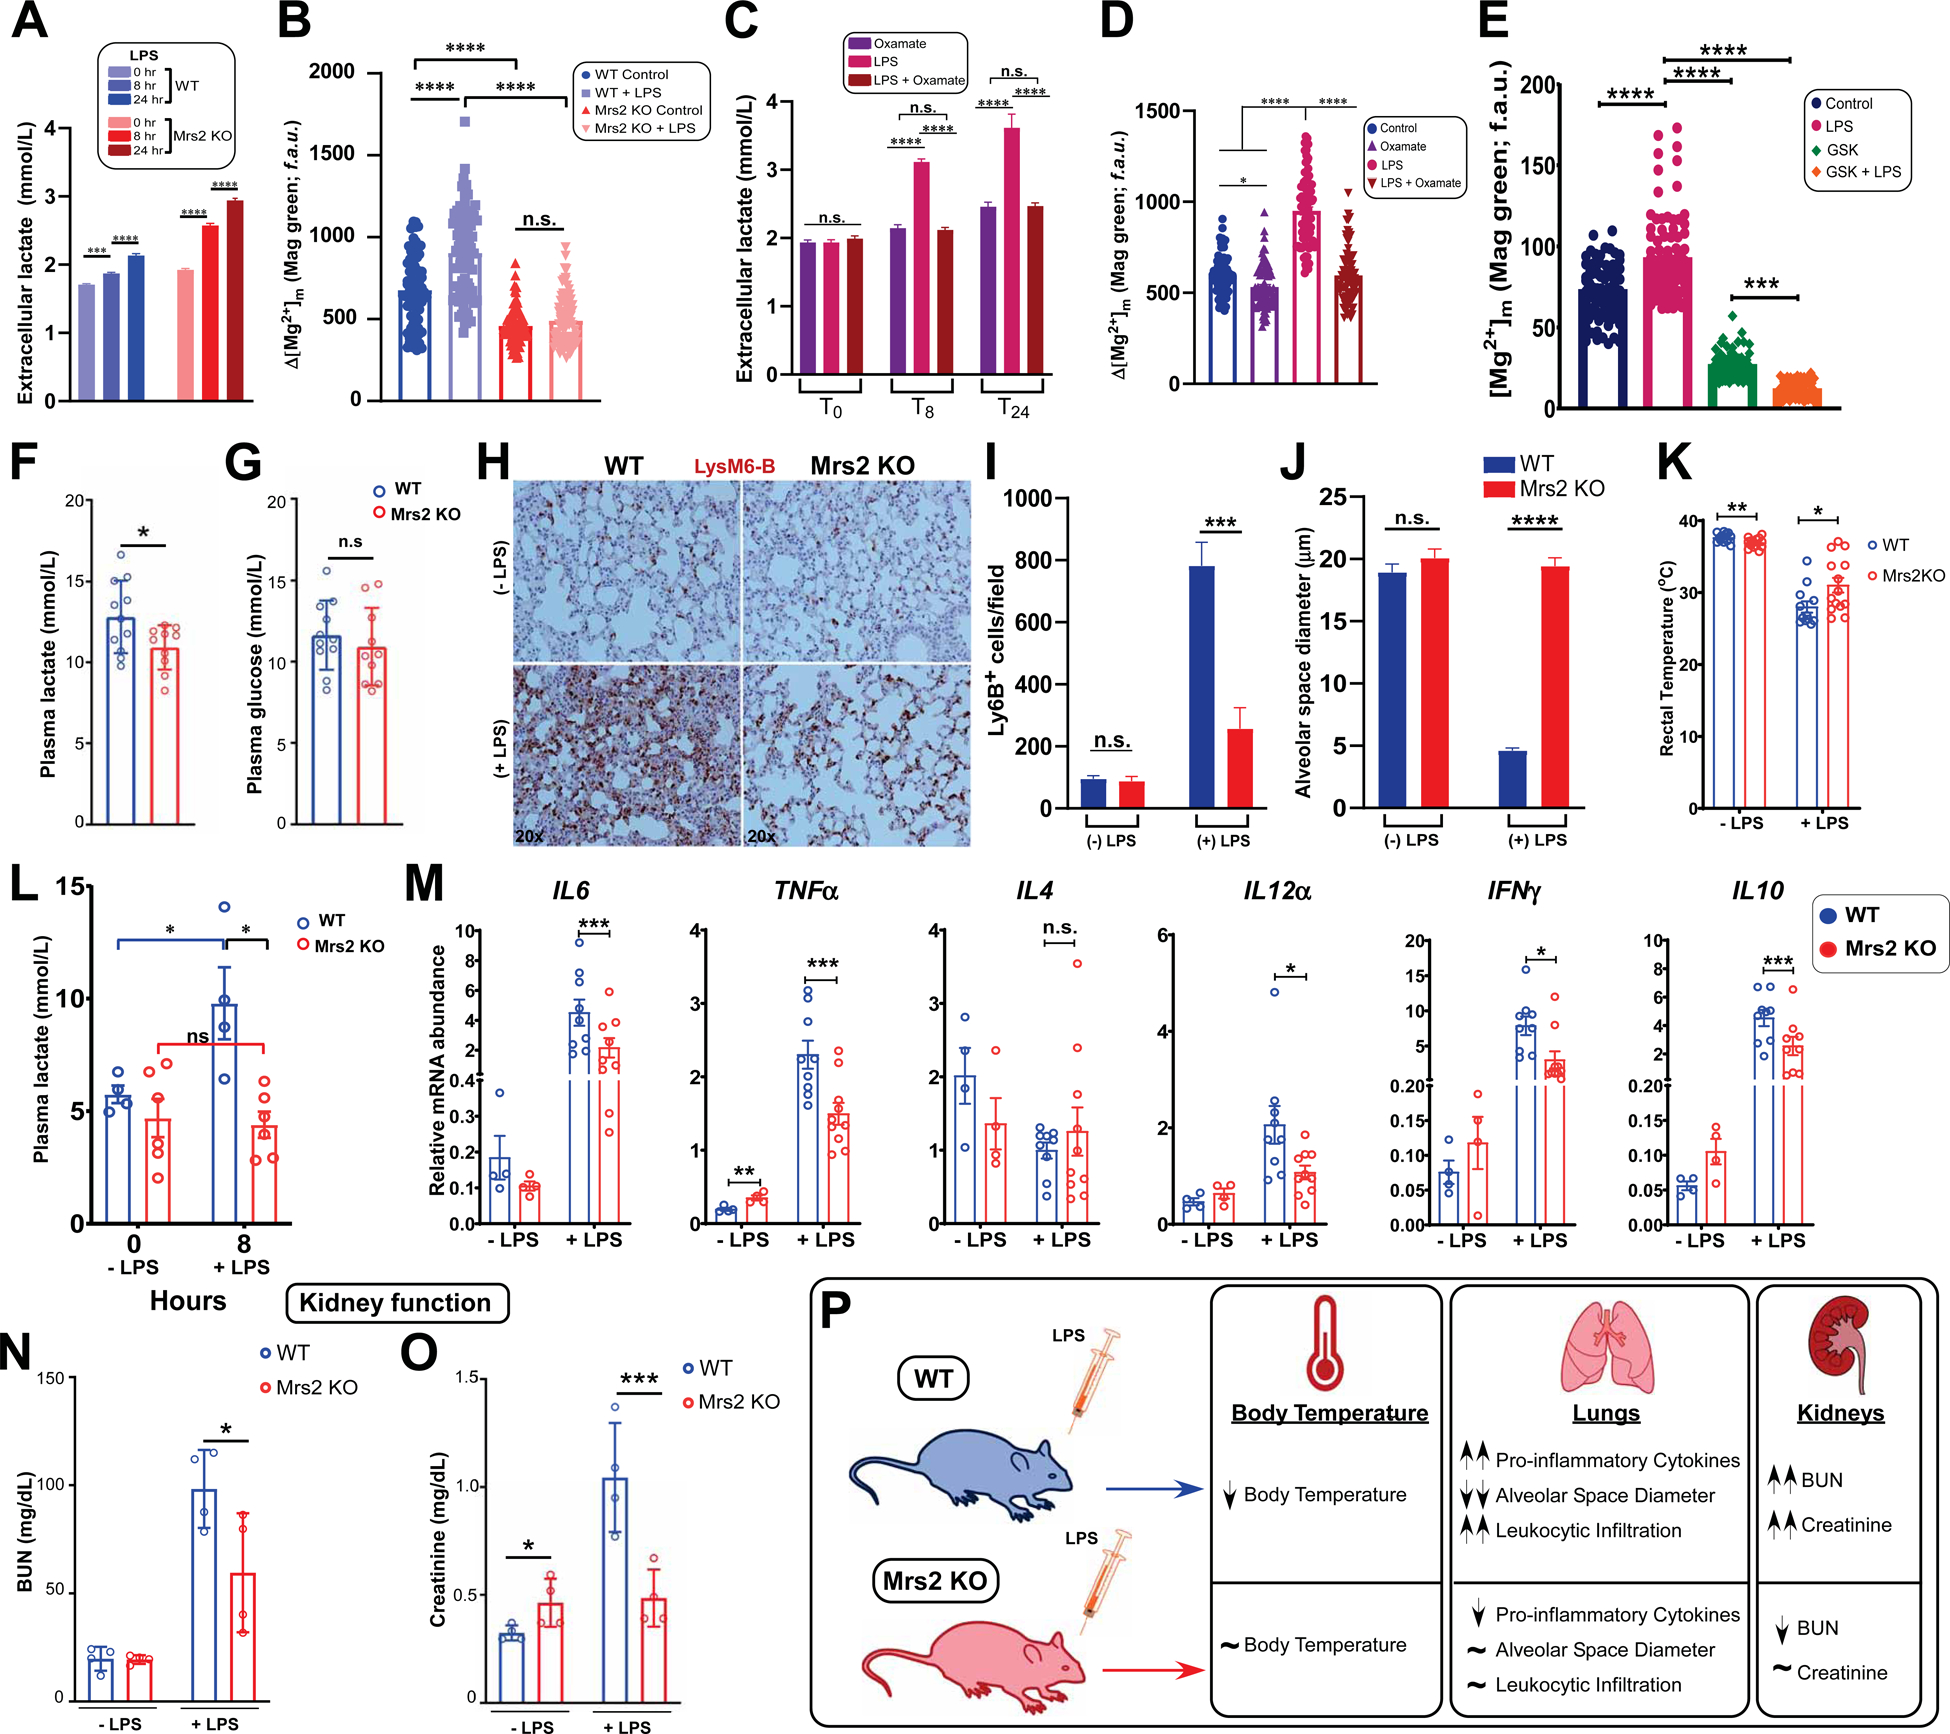
Mg2+ is the most abundant divalent cation in metazoans and an essential cofactor for ATP, nucleic acids, and countless metabolic enzymes. To understand how the spatio-temporal dynamics of intracellular Mg2+ (iMg2+) are integrated into cellular signaling, we implemented a comprehensive screen to discover regulators of iMg2+ dynamics. Lactate emerged as an activator of rapid release of Mg2+ from endoplasmic reticulum (ER) stores, which facilitates mitochondrial Mg2+ (mMg2+) uptake in multiple cell types. We demonstrate that this process is remarkably temperature sensitive and mediated through intracellular but not extracellular signals. The ER-mitochondrial Mg2+ dynamics is selectively stimulated by L-lactate. Further, we show that lactate-mediated mMg2+ entry is facilitated by Mrs2, and point mutations in the intermembrane space loop limits mMg2+ uptake. Intriguingly, suppression of mMg2+ surge alleviates inflammation-induced multi-organ failure. Together, these findings reveal that lactate mobilizes iMg2+ and links the mMg2+ transport machinery with major metabolic feedback circuits and mitochondrial bioenergetics.

Keywords: Mrs2; calcium; cancer; channel; endoplasmic reticulum; inflammation; lactate; magnesium; metabolism; mitochondria.


Conflict of interest statement

Declaration of Interests M.M. is an inventor on a patent provisionally filed by UTHSA on lactate as a ligand for Mg(2+) dynamics in physiology and disease. All other authors have no financial interests to declare.

Figures

Figure 1.
Figure 1.. Lactate stimulates rapid depletion of ER magnesium stores and subsequent uptake by mitochondria.
(A) Primary hepatocytes were loaded with Magnesium Green AM (Mag-Green) and MitoTracker Red (mitochondrial marker) for live confocal imaging. Relative changes in fluorescence intensity of Mag-Green in the ER, nucleus, and mitochondria were analyzed and depicted as a heatmap. n=3–10. (B) Quantitative analysis of relative changes in Mag-Green fluorescence intensity in ER (blue) and mitochondria (orange). n=3–10. Mean ± SEM. ****p < 0.0001. (C-E) Representative images and traces of relative changes in Mag-Green intensity of mitochondrial (orange), ER (blue) and nuclear (red) regions. (C) Glucose (5 mM), (D) sodium L-Lactate (5 mM), or (E) Citrate (5 mM) was added after a 30 second baseline recording followed by a 10 mM Mg2+ bolus at the 125th frame. n=3–6.
Figure 2.
Figure 2.. Mg2+ depletion from ER is L-Lactate specific, dose-dependent, while mMg2+ uptake is both dose- and temperature-dependent.
(A) Natta projections of the naturally occurring enantiomers of lactate as well as synthetic analogues that were tested in this assay. (B) Quantification of relative changes in Mag-Green fluorescence intensity after addition of lactate and synthetic analogues (5 mM). n = 4–6 Mean ± SEM. (C) Permeabilized hepatocytes were pulsed with either L-lactate or D-lactate (5 mM) and ER Mag-green signal was monitored using confocal imaging system. Representative mean traces show a rapid Mg2+ signal dissipation. Mean ± SEM. n=3. (D-E) Relative changes in Mag-Green fluorescence intensity within ER or mitochondria at 37°C. n= 3–6. Mean ± SEM. (F) Relative changes in Mag-Green fluorescence intensity within ER or (G) mitochondria at both 25°C (blue) and 37°C (red) over a range of lactate concentrations. n=3–6. Mean ± SEM. (H-I) Relative changes in Mag-Green fluorescence intensity within ER or mitochondria after stimulation with Lactate over temperature range. n=3–6 cells for each condition. Mean ± SEM. *p < 0.05, **p < 0.01, ***p < 0.001, ****p < 0.0001. n.s. = not significant.
Figure 3.
Figure 3.. Lactate-dependent Mg2+ flux into mitochondria is primarily from intracellular ER stores.
(A-B) Relative changes in Mag-Green signal within ER or (B) mitochondria after stimulation with glucose and lactate, or lactate after pretreatment with MCT1 (ARC13800; 1 μM) and MCT1/2 (AR-C155858; 2 μM) inhibitors. n=3–6. Mean ± SEM. n=3–9 (C-D) Relative changes in Mag-Green signal within ER or (D) mitochondria in MCT-1 knockdown HepG2 cells. n=3–4. Mean ± SEM. (E) Western blot showing changes in HepG2 MCT1 protein expression following RNAi-mediated KD of MCT-1. n = 3. (F) Permeabilized hepatocytes were pulsed with 1 mM MgCl2 or in combination with 5 mM lactate. Representative traces show bath [Mg2+] (f.a.u). Mean ± SEM. n=3. (G) Change in bath [Mg2+] due to mMg2+ uptake in response to various bath [Mg2+] in permeabilized hepatocytes. Inset table depicts mitochondrial uptake rate. Mean ± SEM. n=3. (H) Far-UV CD spectra of the human Mrs2 N-terminal domain (residues 58–333) in the presence (blue) and absence (black) of 5 mM Mg2+. MRE, mean residue ellipticity (×0.001). Inset shows the human Mrs2 N-terminal domain purity. (I) Thermal stability of the human Mrs2 N-terminal domain. Thermal melts are constructed from the change in MRE at 222 nm as function of temperature. Data in panels H and I are Mean ± SEM. n=3. *p < 0.05, **p < 0.01, n.s. = not significant.
Figure 4.
Figure 4.. Lactate-induced ER Mg2+ depletion and that the Mrs2 is responsible for subsequent mMg2+ uptake.
(A) Image depicts confirmation of CRISPR-Cas9-mediated global Mrs2 KO. (B) DNA sequence analysis show the CRISPR/Cas9-mediated insertion of early stop codon that confirms Mrs2 KO. (C) Heatmap depicts the distribution of Mrs2 mRNA in WT and Mrs2 KO tissues. n=3–5 mice per genotype. (D-E) Schematic showing construction and operation of our modified MagFRET constructs to assess the Mg2+ dynamics in the ER and mitochondria during stimulation. (F) Representative traces depicting MagFRET signal changes in the mitochondria of WT (black) and Mrs2 KO (red) hepatocytes after lactate stimulation. Mean ± SEM. n=4–6. ***p < 0.001. (G) WT and Mrs2 KO hepatocytes were transduced with Mag-FRETER adenovirus. Images depict the proper localization of KDEL-tagged Mag-FRETER construct. (H) WT and Mrs2 KO hepatocytes were transduced with Mag-FRETER adenovirus. Images depict Mag-FRETER expression and counter stained with ΔΨm indicator TMRE. (I-J) Representative traces depicting rapid loss of MagFRET signal in the ER after lactate stimulation in both WT (I) and Mrs2 KO (J) hepatocytes. n=4–6.
Figure 5.
Figure 5.. Mutations of the conserved Mrs2 transmembrane loop residues essentially inhibited mMg2+ uptake.
(A) Amino acid sequence alignment of the yeast Mrs2p its only mammalian homologue Mrs2. (B) The schematic depicts the mouse Mrs2 WT (top) and Mrs2 mutant constructs (bottom). (C) Western analysis showing the expression of Flag-tagged WT and mutant Mrs2 Adv5 constructs. (D) Confocal micrographs of primary hepatocytes transduced with WT and mutant Mrs2-tagged with mRFP. (E-F) Representative traces depicting MagFRET signal changes in the ER (Left) and mitochondria (right) after lactate stimulation. Bar charts show the relative FRETSE. n=4–6. Mean ± SEM. ****p < 0.0001. n.s.= not significant.
Figure 6.
Figure 6.. Genetic ablation of Mrs2 exhibits higher mitochondrial PDH activity and oxygen consumption rate.
(A) Permeabilized cells were exposed to FCCP at indicted time point to asses basal mMg2+. (B) Normalized basal mMg2+. Mean ±SEM. (C) Representative transmission electron micrographs (TEM) of WT (left) and Mrs2 KO (right) hepatocytes. (D and E) TEM analysis of mitochondrial length and number in WT and Mrs2 KO hepatocytes. Four images per mice. n=3 mice per group. Mean ±SEM. (F) Western blot depicting the abundance of mitochondrial OXPHOS complex proteins in WT and Mrs2 KO hepatocytes. n = 3 mice per group. (G) Oxygen consumption rate (OCR) of untreated WT and Mrs2 KO hepatocytes. (H) OCR curves of WT and Mrs2 KO hepatocytes treated with 0.5 mM lactate, after basal measurements, at the indicated time point. (Bottom panels) Bar chart depicts basal, maximal, and proton leak. Mean ±SEM; n=3. (I) OCR curves depicting hepatocytes pretreated for 24 hours with either LPS (100 μg/ml) alone or in combination with GSK2837808A (100 nM) or Oxamate (20 mM). Bar charts depict basal and maximal respiration and proton leak from the above traces. Mean ±SEM. n= 6–8. (J) WT and Mrs2 KO hepatocytes were treated with LPS (1, 10 and 100 μg/ml) for 6 hours and immunoblotted for p-PDH E1α (S293), PDH E1α, and β-actin. Densitometric analysis shown below. n=3. Mean ±SEM. *p < 0.05, **p < 0.01, ***p < 0.001, ****p < 0.0001. n.s. = not significant.
Figure 7.
Figure 7.. Mrs2 Genetic Ablation Confers a Protective Effect in an Endotoxin Model of Septic Shock.
(A) Bar chart quantifying extracellular lactate accumulation in WT and Mrs2 KO hepatocytes after LPS challenge (100 μg/mL). n = 3. Mean ±SEM. (B) Quantitative analysis comparing mMg2+ in WT and Mrs2 KO hepatocytes after 24 hours of LPS treatment. n = 3. Mean ± SEM. (C) Extracellular lactate levels in WT hepatocytes at 0, 8, and 24 hours post LPS treatment with or without oxamate (20 mM). n = 3. Mean ±SEM. (D) Quantification of mMg2+ in WT hepatocytes pretreated with oxamate before LPS challenge. n = 3–4. (E) Quantification of mMg2+ in WT hepatocytes pretreated with GSK (100nM) before LPS challenge. n = 3–4. (F-G) Measurement of plasma glucose and lactate in WT and Mrs2 KO mice. Mean ± SEM. n=10–11 mice per group. (H-J) Lys6B immuno-staining of lung tissue from WT and Mrs2 KO mice, with and without 24-hour LPS (5mg/kg) challenge (H). (I) Quantification of Lys6B positive cells. (J) Measurement of alveolar space diameter. n= 3 mice per group. Mean ± SEM. (K) Measurement of body temperature in WT and Mrs2 KO mice with and without 24-hour LPS treatment. n=10–12 per group. Mean ± SEM. (L) Plasma lactate were measured from WT and Mrs2 KO mice. Mean ± SEM. n=4–6 per group. (M) Measurement of cytokine transcripts from WT and Mrs2 KO mice lung tissues 24-hours following LPS treatment. n=4–10 per group. Mean ± SEM. (N-P) Serum creatinine and BUN from WT and Mrs2 KO mice 24-hours following LPS treatment. n=4 per group. Mean ± SEM. *p < 0.05, **p < 0.01, ***p < 0.001, ****p < 0.0001. n.s. = not significant.

Comment in

References

    1. Berridge MJ, Bootman MD, and Roderick HL (2003). Calcium signalling: dynamics, homeostasis and remodelling. Nat Rev Mol Cell Biol 4, 517–529. - PubMed
    1. Brooks GA (2018). The Science and Translation of Lactate Shuttle Theory. Cell Metab 27, 757–785. - PubMed
    1. Bui DM, Gregan J, Jarosch E, Ragnini A, and Schweyen RJ (1999). The bacterial magnesium transporter CorA can functionally substitute for its putative homologue Mrs2p in the yeast inner mitochondrial membrane. J Biol Chem 274, 20438–20443. - PubMed
    1. Cai TQ, Ren N, Jin L, Cheng K, Kash S, Chen R, Wright SD, Taggart AK, and Waters MG (2008). Role of GPR81 in lactate-mediated reduction of adipose lipolysis. Biochem Biophys Res Commun 377, 987–991. - PubMed
    1. Chaigne-Delalande B, Li FY, O’Connor GM, Lukacs MJ, Jiang P, Zheng L, Shatzer A, Biancalana M, Pittaluga S, Matthews HF, et al. (2013). Mg2+ regulates cytotoxic functions of NK and CD8 T cells in chronic EBV infection through NKG2D. Science 341, 186–191. - PMC - PubMed

Publication types

LinkOut - more resources