Validation of non-contrast multiple overlapping thin-slab 4D-flow cardiac magnetic resonance imaging
- PMID: 33035638
- PMCID: PMC7931662
- DOI: 10.1016/j.mri.2020.10.002
Validation of non-contrast multiple overlapping thin-slab 4D-flow cardiac magnetic resonance imaging
Abstract
Background: Cardiac magnetic resonance (CMR) flow quantification is typically performed using 2D phase-contrast (PC) imaging of a plane perpendicular to flow. 3D-PC imaging (4D-flow) allows offline quantification anywhere in a thick slab, but is often limited by suboptimal signal, potentially alleviated by contrast enhancement. We developed a non-contrast 4D-flow sequence, which acquires multiple overlapping thin slabs (MOTS) to minimize signal loss, and hypothesized that it could improve image quality, diagnostic accuracy, and aortic flow measurements compared to non-contrast single-slab approach.
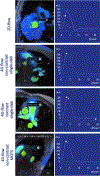
Methods: We prospectively studied 20 patients referred for transesophageal echocardiography (TEE), who underwent CMR (GE, 3 T). 2D-PC images of the aortic valve and three 4D-flow datasets covering the heart were acquired, including single-slab, pre- and post-contrast, and non-contrast MOTS. Each 4D-flow dataset was interpreted blindly for ≥moderate valve disease and compared to TEE. Flow visualization through each valve was scored (0 to 4), and aortic-valve flow measured on each 4D-flow dataset and compared to 2D-PC reference.
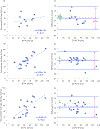
Results: Diagnostic quality visualization was achieved with the pre- and post-contrast 4D-flow acquisitions in 25% and 100% valves, respectively (scores 0.9 ± 1.1 and 3.8 ± 0.5), and in 58% with the non-contrast MOTS (1.6 ± 1.1). Accuracy of detection of valve disease was 75%, 92% and 82%, respectively. Aortic flow measurements were possible in 53%, 95% and in 89% patients, respectively. The correlation between pre-contrast single-slab measurements and 2D-PC reference was weak (r = 0.21), but improved with both contrast enhancement (r = 0.71) and with MOTS (r = 0.67).
Conclusions: Although non-contrast MOTS 4D-flow improves valve function visualization and diagnostic accuracy, a significant proportion of valves cannot be accurately assessed. However, aortic flow measurements using non-contrast MOTS is feasible and reaches similar accuracy to that of contrast-enhanced 4D-flow.
Keywords: Aortic flow; Contrast enhancement; Offline analysis; Phase contrast.
Copyright © 2020 Elsevier Inc. All rights reserved.
Conflict of interest statement
Declaration of Competing Interest
Figures


References
-
- Hofman MB, van Rossum AC, Sprenger M, Westerhof N. Assessment of flow in the right human coronary artery by magnetic resonance phase contrast velocity measurement: effects of cardiac and respiratory motion. Magn Reson Med 1996;35:521–31. - PubMed
-
- Markl M, Fluckiger J, Lee DC, Ng J, Goldberger JJ. Velocity quantification by electrocardiography-gated phase contrast magnetic resonance imaging in patients with cardiac arrhythmia: a simulation study based on real time transesophageal echocardiography data in atrial fibrillation. J Comput Assist Tomogr 2015;39:422–7. - PMC - PubMed
-
- Wong KK, Kelso RM, Worthley SG, Sanders P, Mazumdar J, Abbott D. Cardiac flow analysis applied to phase contrast magnetic resonance imaging of the heart. Ann Biomed Eng 2009;37:1495–515. - PubMed
Publication types
MeSH terms
Grants and funding
LinkOut - more resources
Full Text Sources
Medical

