

Associations of quantitative susceptibility mapping with Alzheimer's disease clinical and imaging markers
- PMID: 33035667
- PMCID: PMC7860631
- DOI: 10.1016/j.neuroimage.2020.117433
Associations of quantitative susceptibility mapping with Alzheimer's disease clinical and imaging markers
Abstract
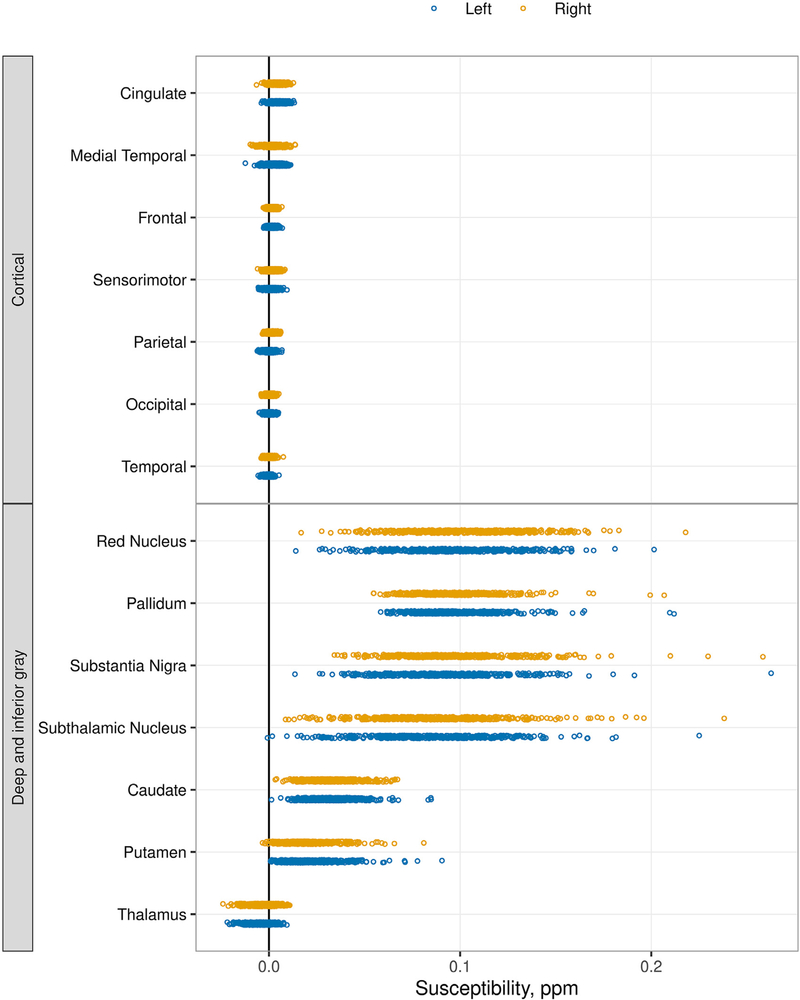
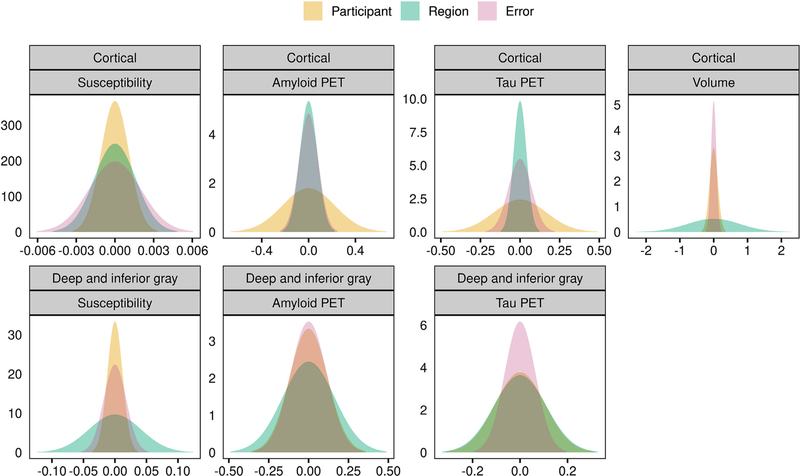
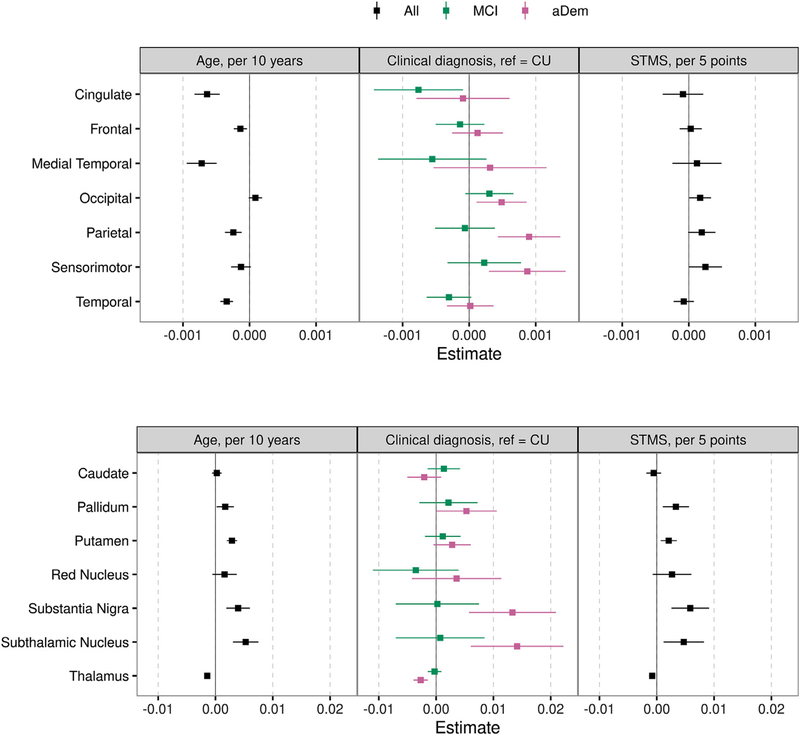
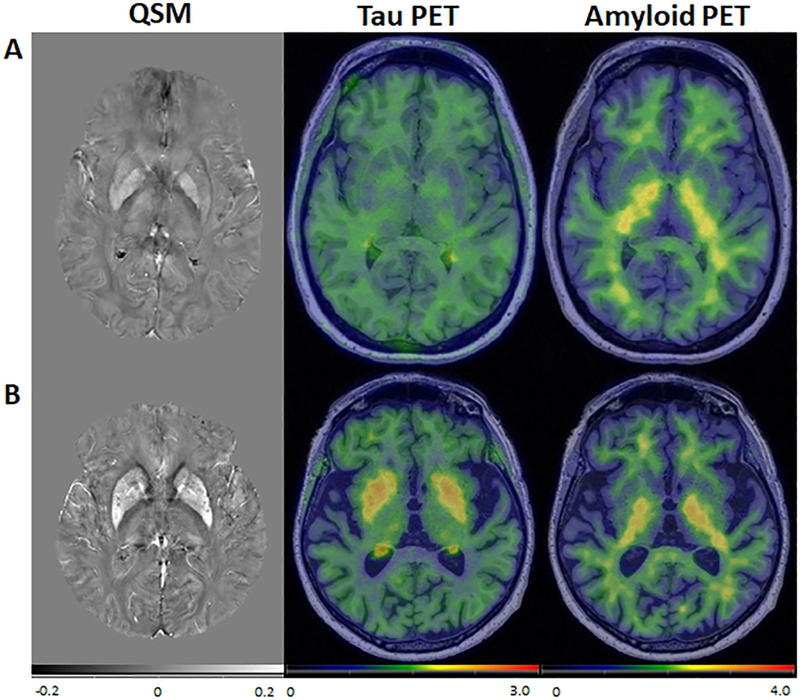
Altered iron metabolism has been hypothesized to be associated with Alzheimer's disease pathology, and prior work has shown associations between iron load and beta amyloid plaques. Quantitative susceptibility mapping (QSM) is a recently popularized MR technique to infer local tissue susceptibility secondary to the presence of iron as well as other minerals. Greater QSM values imply greater iron concentration in tissue. QSM has been used to study relationships between cerebral iron load and established markers of Alzheimer's disease, however relationships remain unclear. In this work we study QSM signal characteristics and associations between susceptibility measured on QSM and established clinical and imaging markers of Alzheimer's disease. The study included 421 participants (234 male, median age 70 years, range 34-97 years) from the Mayo Clinic Study of Aging and Alzheimer's Disease Research Center; 296 (70%) had a diagnosis of cognitively unimpaired, 69 (16%) mild cognitive impairment, and 56 (13%) amnestic dementia. All participants had multi-echo gradient recalled echo imaging, PiB amyloid PET, and Tauvid tau PET. Variance components analysis showed that variation in cortical susceptibility across participants was low. Linear regression models were fit to assess associations with regional susceptibility. Expected increases in susceptibility were found with older age and cognitive impairment in the deep and inferior gray nuclei (pallidum, putamen, substantia nigra, subthalamic nucleus) (betas: 0.0017 to 0.0053 ppm for a 10 year increase in age, p = 0.03 to <0.001; betas: 0.0021 to 0.0058 ppm for a 5 point decrease in Short Test of Mental Status, p = 0.003 to p<0.001). Effect sizes in cortical regions were smaller, and the age associations were generally negative. Higher susceptibility was significantly associated with higher amyloid PET SUVR in the pallidum and putamen (betas: 0.0029 and 0.0012 ppm for a 20% increase in amyloid PET, p = 0.05 and 0.02, respectively), higher tau PET in the basal ganglia with the largest effect size in the pallidum (0.0082 ppm for a 20% increase in tau PET, p<0.001), and with lower cortical gray matter volume in the medial temporal lobe (0.0006 ppm for a 20% decrease in volume, p = 0.03). Overall, these findings suggest that susceptibility in the deep and inferior gray nuclei, particularly the pallidum and putamen, may be a marker of cognitive decline, amyloid deposition, and off-target binding of the tau ligand. Although iron has been demonstrated in amyloid plaques and in association with neurodegeneration, it is of insufficient quantity to be reliably detected in the cortex using this implementation of QSM.
Keywords: Alzheimer's disease; Beta amyloid PET; Quantitative susceptibility mapping; Tau PET.
Copyright © 2020 The Authors. Published by Elsevier Inc. All rights reserved.
Conflict of interest statement
Declaration of Competing Interest B.B.B. has served as an investigator for a clinical trial sponsored for Biogen. He receives royalties from the publication of a book entitled Behavioral Neurology of Dementia (Cambridge Medicine 2009, 2017). He serves on the Scientific Advisory Board of the Tau Consortium. He receives research support from the NIH, the Mayo Clinic Dorothy and Harry T. Mangurian Jr Lewy Body Dementia Program, and the Little Family Foundation, C.R.J. serves on an independent data monitoring board for Roche and has consulted for Eisai, but he receives no personal compensation from any commercial entity. He receives research support from NIH and the Alexander Family Alzheimer's Disease Research Professorship of the Mayo Clinic. D.T.J. receives funding from the NIH and the Minnesota Partnership for Biotechnology and Medical Genomics. K.K. serves on the data safety monitoring board for Takeda Global Research and Development Center, Inc.; receives research support from Avid Radioparmaceuticals and Eli Lilly, and receives funding from NIH and Alzheimer's Drug Discovery Foundation. D.S.K. served on a Data Safety Monitoring Board for the DIAN study. He serves on a Data Safety monitoring Board for a tau therapeutic for Biogen, but receives no personal compensation. He is an investigator in clinical trials sponsored by Biogen, Lilly Pharmaceuticals and the University of Southern California. He serves as a consultant for Samus Therapeutics, Third Rock and Alzeca Biosciences but receives no personal compensation. He receives research support from the NIH. V.J.L. consults for Bayer Schering Pharma, Piramal Life Sciences, and Merck Research, and receives research support from GE Healthcare, Siemens Molecular Imaging, AVID Radiopharmaceuticals, and the NIH (NIA, NCI). M.M.M. receives support from the NIH, unrestricted research grants from Biogen, and consults for Brain Protection Company. R.C.P. has consulted for Roche, Inc.; Merck, Inc.; Biogen, Inc.; Eisai, Inc. and is on a Data and Safety Monitoring Committee for Genentech, Inc. He receives research support from the National Institute on Aging, the GHR Foundation and the Alzheimer's Association. C.G.S. and J.G-R. receive research support from the NIH. M.L.S. has owned shares of the following medical related stocks, unrelated to the current work: Align Technology, Inc., LHC Group, Inc., Mesa Laboratories, Inc., Natus Medical Incorporated, Varex Imaging Corporation, CRISPR Therapeutics, Gilead Sciences, Inc., Globus Medical Inc., Inovio Biomedical Corp., Ionis Pharmaceuticals, Johnson & Johnson, Medtronic, Inc., Parexel International Corporation. P.M.C., H.J.W., S.D.W., H.B., T.M.T., J.L.G., report no competing interests.
Figures

Comment in
-
Response to "On the reproducibility of quantitative susceptibility mapping and its potential as a clinical biomarker: A comment on Cogswell et al. 2021".Neuroimage. 2022 May 1;251:118992. doi: 10.1016/j.neuroimage.2022.118992. Epub 2022 Feb 15. Neuroimage. 2022. PMID: 35181550 No abstract available.
References
Publication types
MeSH terms
Substances
Grants and funding
LinkOut - more resources
Full Text Sources
Other Literature Sources
Medical
