. 2020 Nov-Dec;13(6):1706-1718.
doi: 10.1016/j.brs.2020.09.028. Epub 2020 Oct 6.

Evoked potentials reveal neural circuits engaged by human deep brain stimulation

Affiliations

Evoked potentials reveal neural circuits engaged by human deep brain stimulation

Stephen L Schmidt et al. Brain Stimul. 2020 Nov-Dec.

Abstract

Background: Deep brain stimulation (DBS) is an effective therapy for reducing the motor symptoms of Parkinson's disease, but the mechanisms of action of DBS and neural correlates of symptoms remain unknown.

Objective: To use the neural response to DBS to reveal connectivity of neural circuits and interactions between groups of neurons as potential mechanisms for DBS.

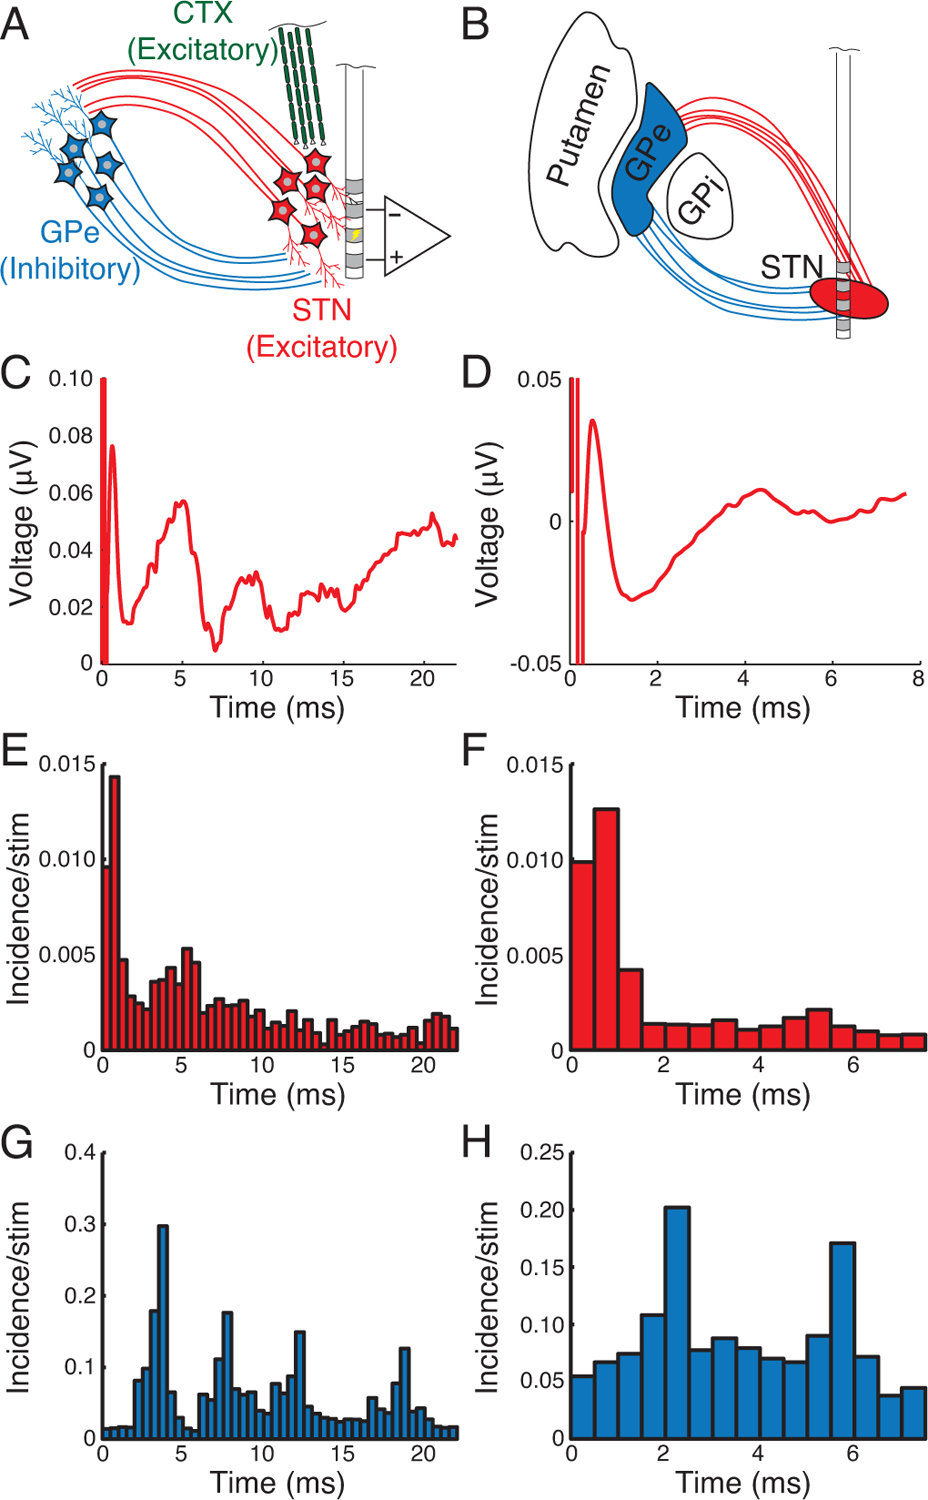
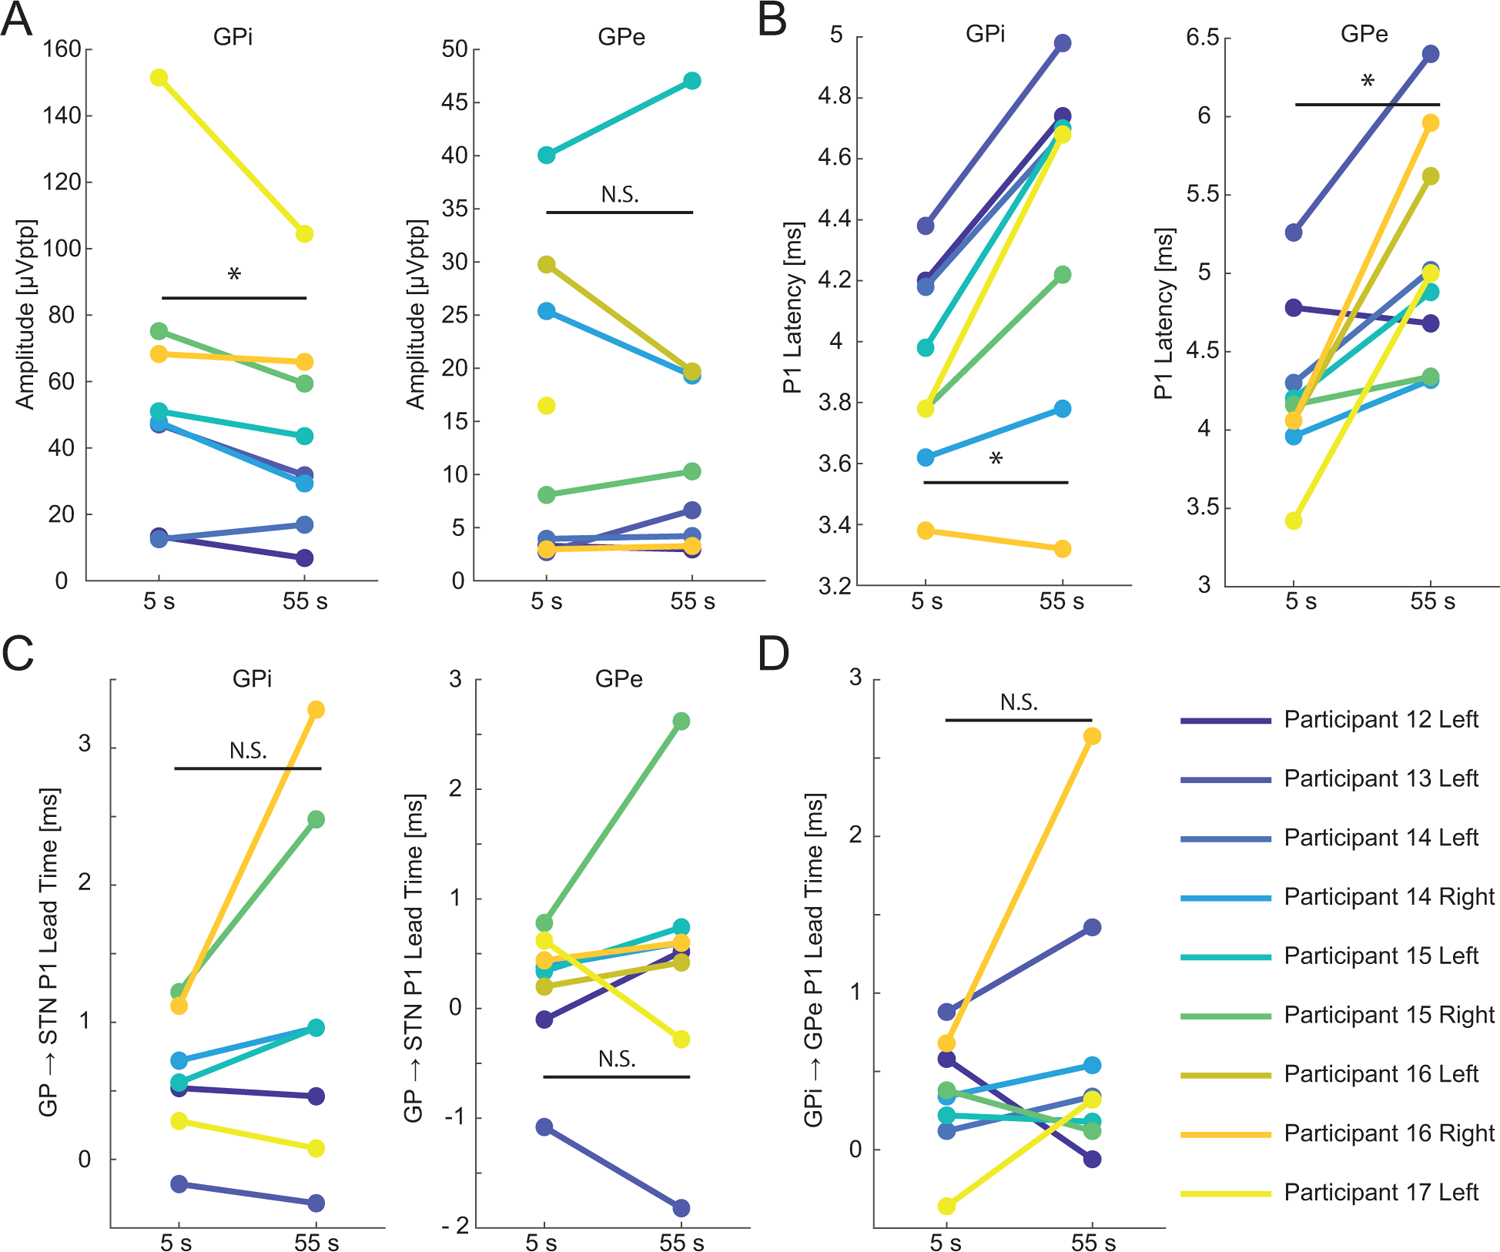
Methods: We recorded activity evoked by DBS of the subthalamic nucleus (STN) in humans with Parkinson's disease. In follow up experiments we also simultaneously recorded activity in the contralateral STN or the ipsilateral globus pallidus from both internal (GPi) and external (GPe) segments.

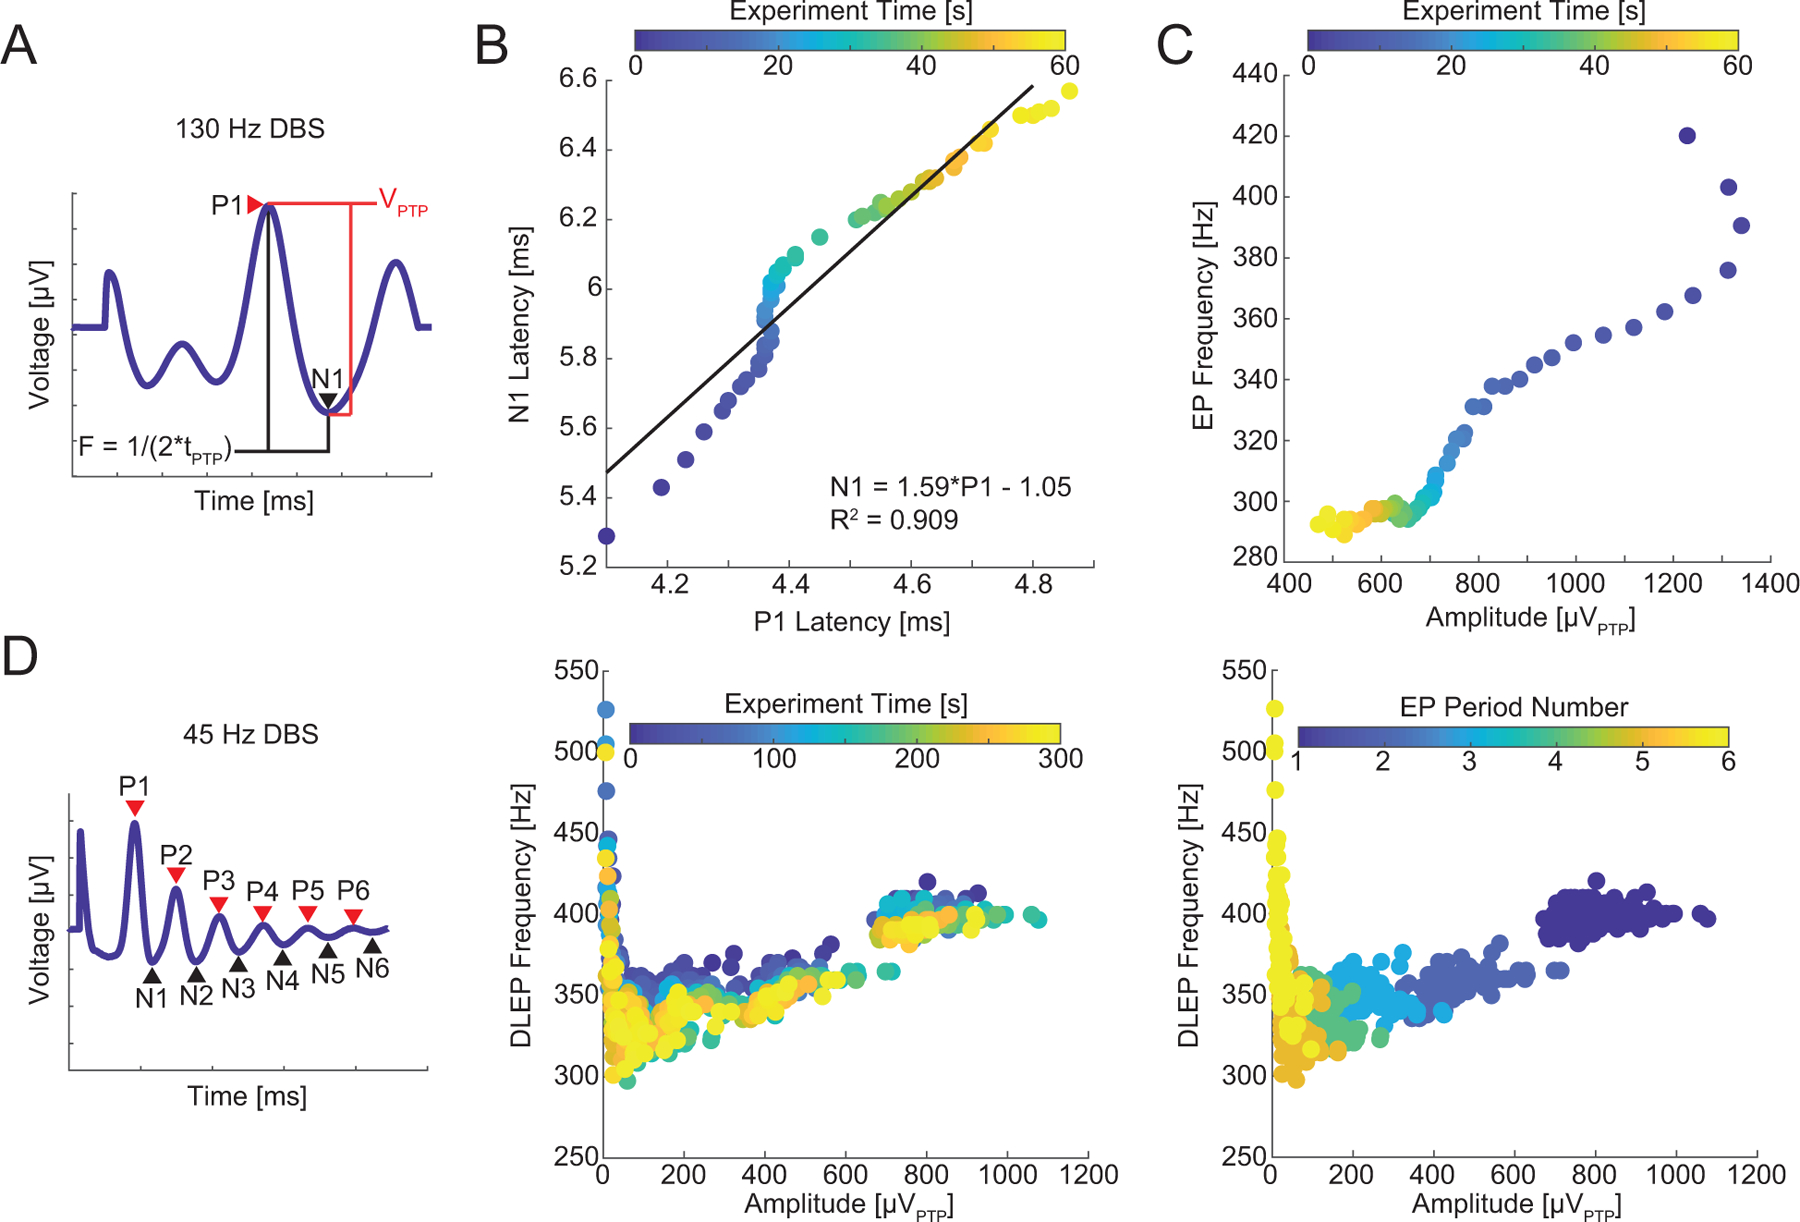
Results: DBS local evoked potentials (DLEPs) were stereotyped across subjects, and a biophysical model of reciprocal connections between the STN and the GPe recreated DLEPs. Simultaneous STN and GP recordings during STN DBS demonstrate that DBS evoked potentials were present throughout the basal ganglia and confirmed that DLEPs arose from the reciprocal connections between the STN and GPe. The shape and amplitude of the DLEPs were dependent on the frequency and duration of DBS and were correlated with resting beta band oscillations. In the frequency domain, DLEPs appeared as a 350 Hz high frequency oscillation (HFO) independent of the frequency of DBS.

Conclusions: DBS evoked potentials suggest that the intrinsic dynamics of the STN and GP are highly interlinked and may provide a promising new biomarker for adaptive DBS.

Keywords: DBS; Globus pallidus; Parkinson’’s disease; Subthalamic nucleus.


Conflict of interest statement

Declaration of competing interest WMG is cofounder, Director and CSO of Deep Brain Innovations LLC. WMG is Director and CSO of NDI Healthcare Fund and receives compensation for these positions. These relationships are reported to the Conflict of Interest Committee at Duke University.

Figures

Figure 1.
Figure 1.
Deep brain stimulation (DBS) local evoked potentials (DLEPs) recorded in STN in response to STN DBS. A) Average short-latency (8 ms) DLEPs during the first 10 s of stimulation of STN DBS at different frequencies. Arrow indicates the short latency positive going phase that was most pronounced with 130 Hz stimulation. B) Average long-latency (25 ms) DLEPs during the first 10 s of STN DBS. The DLEPs often, but not always, contained multiple cycles of high frequency oscillations (see Supplemental Figure 2). C) Evoked potentials in the STN ipsilateral (blue) and contralateral (orange, 10 times gain) to stimulation from Participant 10. There was no response observed in the STN contralateral to stimulation (see Supplemental Figure 3). Data from panels A and B are from Participant 4.
Figure 2.
Figure 2.
Temporal dynamics of the amplitude and latency of DLEPs during continuous DBS. A) The amplitude quickly increased, and the latency decreased during the first 100 ms of stimulation (blue to yellow). B) DLEPs averaged over 10 s intervals during the first 110 s of stimulation. C) Voltages of the P1 and N1 features from DLEPs averaged over 1 s intervals during a single application of 130 Hz DBS. The P1 and N1 amplitudes quickly increased, reaching a peak value 2–3 s after the start of stimulation, and then declined, reaching a minimum value at approximately 2 min into stimulation. D) Peak-to-peak amplitudes for all participants derived from DLEPs averaged over 10 s intervals at 5, 55, and 295 s. DLEP amplitude was reduced after 55 s during 130 Hz DBS (left) but not 45 Hz DBS (right). E) The P1 and N1 latency during a single trial of 130 Hz DBS. F). Latency of P1 for all participants calculated from DLEPs averaged over 10 s intervals. 130 Hz DBS increased P1 latency while 45 Hz DBS did not. * p < 0.05. N.S. Not significant. See Results for medians, confidence intervals and p-values. The data in Panels A, B, C, and E are from Participant 3.
Figure 3.
Figure 3.
Change in DLEP parameters during continuous DBS. A) An example template demonstrating the calculation of peak-to-peak amplitude and instantaneous frequency using the P1 and N1 points. B) The increases in the latency of P1 and N1 during 130 Hz DBS and best fit line. However, there were deviations from linearity, e.g. note how N1 increases from approximately 5.8 to 6.0 ms while P1 remains at roughly 4.35 ms. Several other participants exhibited a higher degree of nonlinearity (Supplemental Figs. 6 & 7). C) The changes in peak-to-peak amplitude and instantaneous frequency of the DLEP during continuous DBS exhibited a nonlinear relationship. D) Left: We calculated the peak-to-peak amplitude and instantaneous frequency for all periods in the long-latency DLEPs averaged over 1 s intervals during 45 Hz DBS. Center: The amplitude and frequency of each cycle of the response. There does not appear to be separation by experiment time. Right: The same data plotted with color encoding of the period of the DLEP (1–6 periods). The first period (the amplitude and frequency calculated from P1 to N1) was clearly separable from subsequent periods. Data from panels B and C are from participant 1. Data from panel D are from Participant 3. R2: goodness of fit calculated by linear least squares corresponding p < 10−3.
Figure 4.
Figure 4.
Computational model predicts that reciprocal connections between STN and GPe produce DLEPs. A) The biophysical model included excitatory subthalamic (red) and inhibitory pallidal neurons (blue) in addition to excitatory cortical axons of the hyperdirect pathway (green). B) We simulated the placement of contacts with monopolar stimulation on contact 1 and differential recording on 0 and 2. C & D) DLEPs calculated from the computational model were similar to those observed clinically for 45 Hz (C) and 130 Hz (D) DBS. Post-stimulus time histograms for STN firing during 45 Hz (E) and 130 Hz (F) DBS revealed modest direct excitation from stimulation and relatively strong inhibition in the interpulse interval with slight increases in firing coincident with the positive phases of the DLEPs. G & H) GPe spiking was periodic following the strong excitation via STN afferents with peaks in the PSTH at 3–4 ms intervals.
Figure 5.
Figure 5.
Simultaneous recordings in the STN and GP during STN DBS. A) DBS electrode and contact locations. B) Evoked potentials in the STN, GPi and GPe normalized by their respective maximum amplitudes for comparison of latencies. C) Left: STN DLEPs. Note the high degree of similarity for repeated trials of STN DBS (blue and red or yellow and green). Right: Evoked responses in GPi or GPe to STN DBS. The EPs were different depending on the recording contacts chosen. For all participants see Supplemental Fig. 9. L/R: Recording and stimulation in the left/right hemisphere. GPi/GPe: Simultaneous recording with GP lead selected to record differentially between contacts 0 and 1 (GPi) or contacts 2 and 3 (GPe). All data depicted are from Participant 15.
Figure 6.
Figure 6.
Changes in evoked potentials recorded in GP during 60 s of STN DBS. A) Peak-to-peak amplitude of the evoked responses in the GP from responses averaged over 10 s intervals. As stimulation continued the amplitude decreased in GPi but did not decrease in GPe. B) P1 latency increased in both GPi and GPe with stimulation time. C) The lead time between the P1 feature in GP referenced and the P1 feature in STN. Both regions of GP responded before STN but lead time did not change significantly with continued stimulation. D) GPi responded before GPe. The lead time did not change with continued stimulation. *: p < 0.05. N.S: not significant. See Results for medians, confidence intervals and p-values.
Figure 7.
Figure 7.
Relationship between STN DLEPs and oscillatory activity in the STN local field potential. A) Power spectral density of the LFP during the first and last μs of a DBS OFF trial. B) The peak-to-peak amplitude of the average DLEP during the first 10 seconds of stimulation was rank-correlated with beta power while stimulation was off. C) High frequency power spectral densities immediately after the onset of 130 Hz DBS (blue), one minute after onset of 130 Hz DBS (orange), and after 1 minute with DBS off (gray). A prominent 350 Hz oscillation was evoked by DBS which decreased in power and frequency. D) Comparison of power in the 200 – 400 Hz band. Continued 130 Hz DBS reduced power in this band compared to the power at the onset of DBS while 45 Hz DBS did not. Data in panels A & C are from Participant 4. PSD: power spectral density. *: p < 0.05. N.S.: not significant. See Results for medians, confidence intervals and p-values.

References

    1. Sutton S, Braren M, Zubin J, John E. Evoked-potential correlates of stimulus uncertainty. Science 1965;150(3700):1187–8. - PubMed
    1. Thorpe S, Fize D, Marlot C. Speed of processing in the human visual system. Nature 1996;381(6582):520–2. - PubMed
    1. Buchsbaum MS, Davis GC, Bunney WE. Naloxone alters pain perception and somatosensory evoked potentials in normal subjects. Nature 1977;270(5638):620–2. - PubMed
    1. Miller CA, Brown CJ, Abbas PJ, Chi S-L. The clinical application of potentials evoked from the peripheral auditory system. Hearing research 2008;242(1):184–97. - PubMed
    1. Parker JL, Karantonis DM, Single PS, Obradovic M, Laird J, Gorman RB, et al. Electrically evoked compound action potentials recorded from the sheep spinal cord. Neuromodulation: Technology at the Neural Interface 2013;16(4):295–303. - PubMed

Publication types