. 2020 Oct:37:101737.
doi: 10.1016/j.redox.2020.101737. Epub 2020 Sep 29.

Knockout of PRDX6 induces mitochondrial dysfunction and cell cycle arrest at G2/M in HepG2 hepatocarcinoma cells

Affiliations

Knockout of PRDX6 induces mitochondrial dysfunction and cell cycle arrest at G2/M in HepG2 hepatocarcinoma cells

María José López-Grueso et al. Redox Biol. 2020 Oct.

Abstract

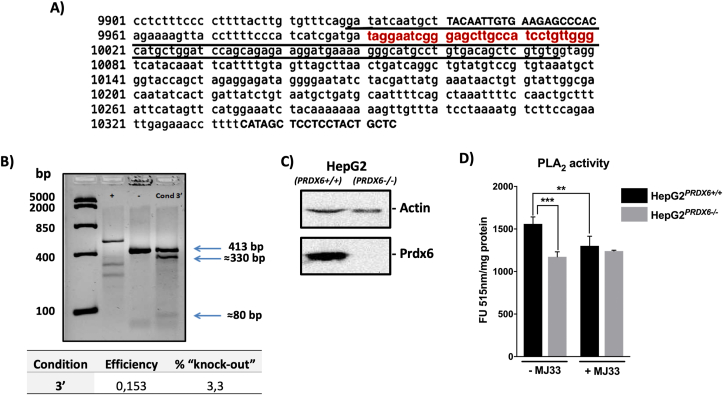
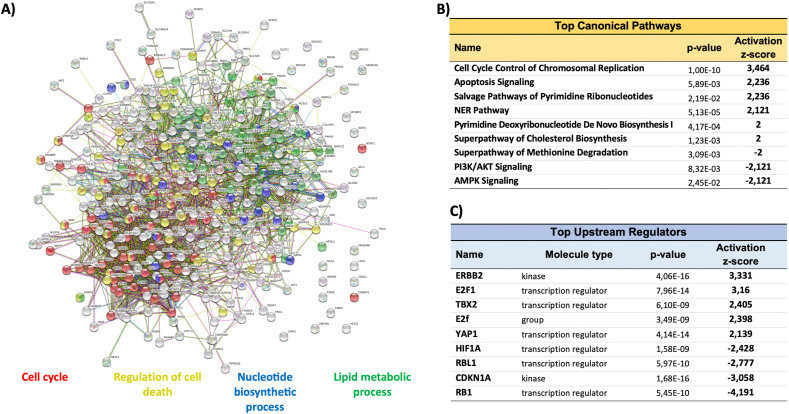
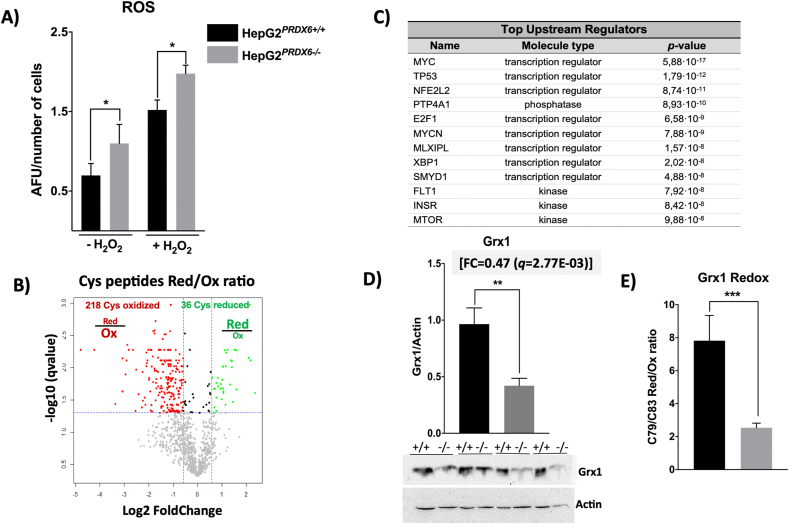
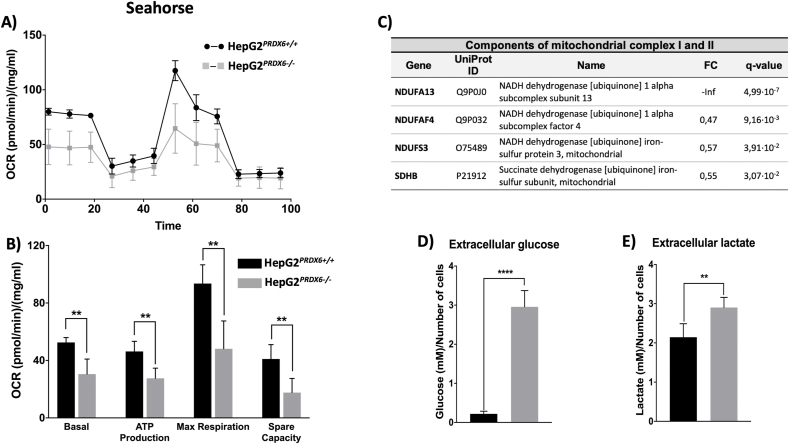
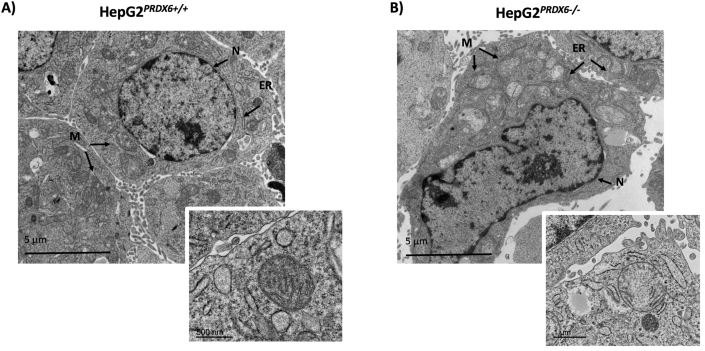
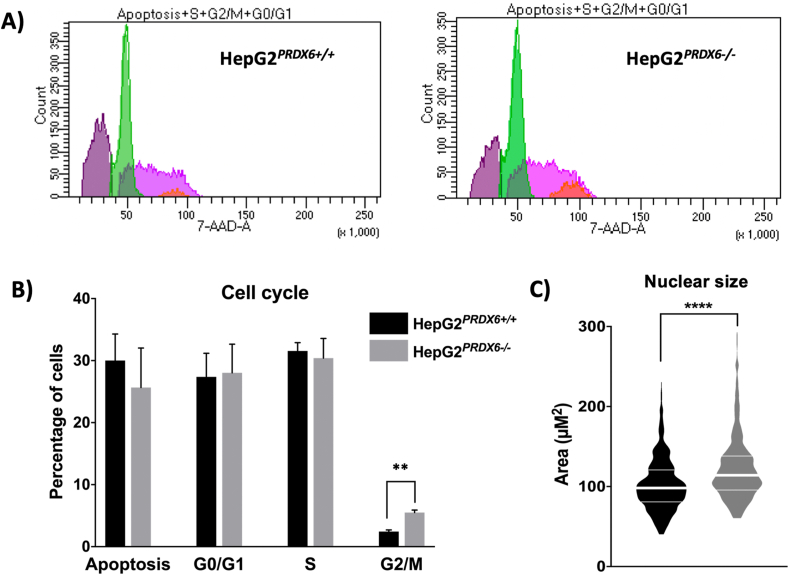
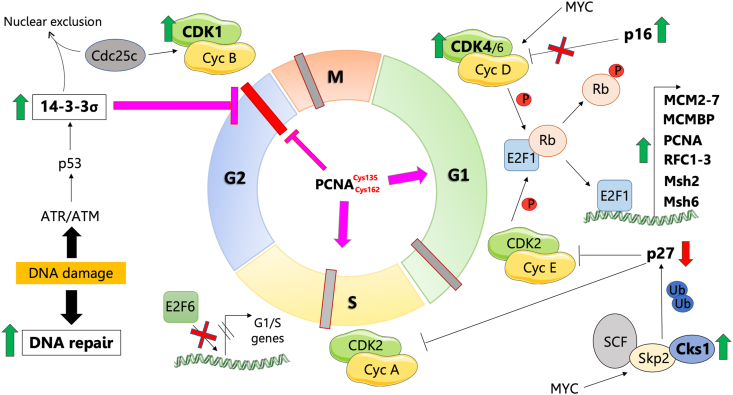
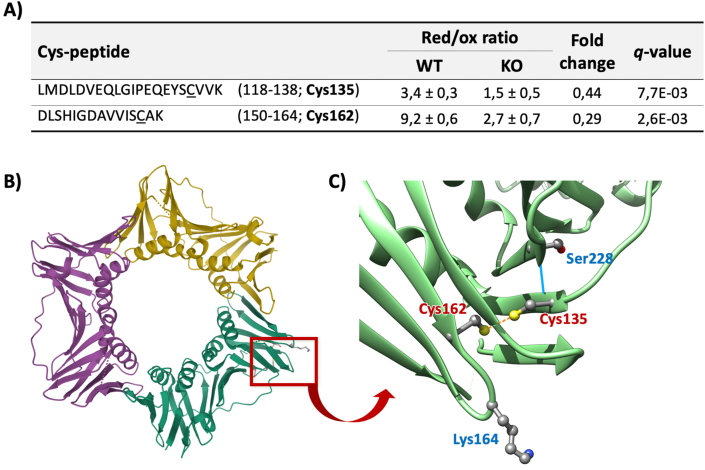
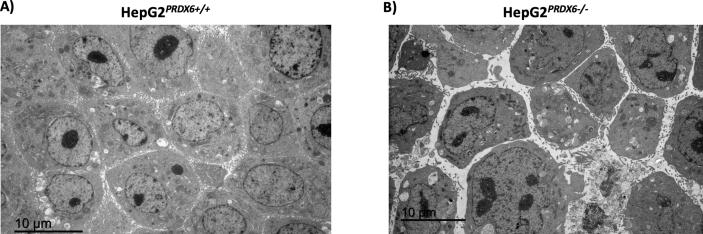
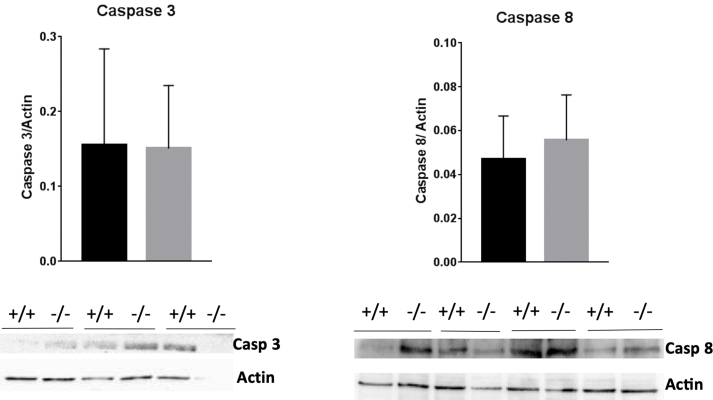
Peroxiredoxin 6 (PRDX6) has been associated with tumor progression and cancer metastasis. Its acting on phospholipid hydroperoxides and its phospholipase-A2 activity are unique among the peroxiredoxin family and add complexity to its action mechanisms. As a first step towards the study of PRDX6 involvement in cancer, we have constructed a human hepatocarcinoma HepG2PRDX6-/- cell line using the CRISPR/Cas9 technique and have characterized the cellular response to lack of PRDX6. Applying quantitative global and redox proteomics, flow cytometry, in vivo extracellular flow analysis, Western blot and electron microscopy, we have detected diminished respiratory capacity, downregulation of mitochondrial proteins and altered mitochondrial morphology. Autophagic vesicles were abundant while the unfolded protein response (UPR), HIF1A and NRF2 transcription factors were not activated, despite increased levels of p62/SQSTM1 and reactive oxygen species (ROS). Insulin receptor (INSR), 3-phosphoinositide-dependent protein kinase 1 (PDPK1), uptake of glucose and hexokinase-2 (HK2) decreased markedly while nucleotide biosynthesis, lipogenesis and synthesis of long chain polyunsaturated fatty acids (LC-PUFA) increased. 254 Cys-peptides belonging to 202 proteins underwent significant redox changes. PRDX6 knockout had an antiproliferative effect due to cell cycle arrest at G2/M transition, without signs of apoptosis. Loss of PLA2 may affect the levels of specific lipids altering lipid signaling pathways, while loss of peroxidase activity could induce redox changes at critical sensitive cysteine residues in key proteins. Oxidation of specific cysteines in Proliferating Cell Nuclear Antigen (PCNA) could interfere with entry into mitosis. The GSH/Glutaredoxin system was downregulated likely contributing to these redox changes. Altogether the data demonstrate that loss of PRDX6 slows down cell division and alters metabolism and mitochondrial function, so that cell survival depends on glycolysis to lactate for ATP production and on AMPK-independent autophagy to obtain building blocks for biosynthesis. PRDX6 is an important link in the chain of elements connecting redox homeostasis and proliferation.

Keywords: CRISPR-Cas9; Carbohydrate metabolism; Cell cycle; Glucose metabolism; Lipokines; Mitochondria; NRF2; PCNA; Peroxiredoxin 6; Proteomics; Redox proteome.


Conflict of interest statement

The authors declare no conflict of interest.

Figures

Fig. 1
Fig. 1
Construction and characterization of a stable HepG2PRDX6-/-cell line. A) Sequence of prdx6 gene with the exon coding region underlined, the gRNA region complementary to the prdx6 gene in red color and the sequence of the commercial primers in capital letters. B) Three bands are detected in the fourth lane, corresponding to the original amplified region with these primers (413 bp) and two bands resulting from the cut by Cas9 nuclease (330 and 80 bp). Efficiency and probability of obtaining a knockout was calculated. C) Analysis of knockout clone for PRDX6 protein by Western blot. D) The PLA2 activity of the constructed HepG2PRDX6-/- cell line compared to the standard HepG2 cell line; specific activity in arbitrary fluorescence units per mg protein in the standard assay ± the PRDX6 specific inhibitor MJ33, was determined. (For interpretation of the references to color in this figure legend, the reader is referred to the Web version of this article.)
Fig. 2
Fig. 2
Systems analysis of the differential proteomics analysis. The set of statistically significant differentially expressed proteins with Fold Change ≥1.5 or ≤0.67 (q ≤ 0.05) in HepG2PRDX6-/- compared to HepG2PRDX6+/+ was analyzed, A) with the STRING algorithm for clustering in terms of “GO Biological Process” and network plotted with the four main processes colored red, blue, green and yellow and other processes presented in grey color, and B) with IPA for canonical pathways enrichment. Only those pathways above the significance activation threshold z-score ≥2 and ≤-2, are shown. C) Predicted top upstream regulators involved; filter set for complex, group, kinase, phosphatase, transcription regulator and chemical-endogenous mammals; significance above activation threshold, z-score ≥2 and ≤-2. Statistical significance is indicated by the p-value. Only top upstream regulators with p-values <1.0E-08 are included in this list. (For interpretation of the references to color in this figure legend, the reader is referred to the Web version of this article.)
Fig. 3
Fig. 3
ROS and Grx1 levels and systems analysis of the differential redox proteome of HepG2PRDX6-/-cell line. A) ROS levels in basal and 100 μM H2O2 treated cells expressed as arbitrary fluorescence units in the DCFDA assay normalized for number of cells (n = 4). B) Volcano plot of the change the in reduced/oxidized ratio of quantified Cys-peptides in PRDX6-knockout HepG2 cells; dotted lines indicate the significance thresholds, q-value<0.05 and fold change ≥1.5 or ≤0.67. C) IPA systems analysis of the redox proteome showing the upstream regulators (filter set as in Fig. 2) predicted to be affected by redox changes in their target proteins, ordered by increasing p-value. D) Grx1 levels determined by Western blot (n = 4). The fold change (FC) determined by the quantitative proteomic analysis (n = 4) is shown on top of the graph; membrane images in which WT (+/+) and KO (−/−) paired samples from different experiments (n = 4) were run in the same gel; membranes were cut at appropriate height according to expected migration of Grx1 (≈12 kDa) to reveal with specific antibody. Loading in each lane was normalized to actin. E) Redox change in Cys79/Cys83 of Grx1 in PRDX6 knockout cells; the reduced/oxidized ratio in shown. Statistical significance was assessed by Student's t-test and is shown with a number of asterisks inversely proportional to the p-value (*** ≤0.001, **≤0.005, *≤0.05).
Fig. 4
Fig. 4
Mitochondrial functionality of HepG2PRDX6-/-cell line. A) Representative recording of oxygen consumption rate (OCR) during the extracellular flow analysis (“Seahorse”) following the protocol for “Mitochondrial Function”; differences between WT and Prdx6 KO cells are highly significant despite a drop of OCR after addition of FCCP. B) Histogram plots of the calculated basal and maximum respiratory rate, ATP production rate and respiratory capacity reserve, normalized for protein content (n = 4). C) Table with mitochondrial protein components of Complexes I and II that were down-regulated in HepG2PRDX6−/- according to the quantitative proteomic analysis. UniProt ID, Protein name, fold change and statistical score are shown; “-inf” indicates that the protein was detected in normal HepG2 cells but not in PRDX6 knockout cells. D) Extracellular glucose and E) lactate concentrations determined by standard methods normalized for number of cells (n = 4). (**** p-value ≤ 0.0001; ** p-value ≤ 0.005).
Fig. 5
Fig. 5
Electron micrographs of HepG2PRDX6+/+and HepG2PRDX6-/-cells. A) Transmission electron microscopy (TEM) image of HepG2 showing normal hepatocytic organelles; nucleus (N), abundant mitochondria with cristae (M), rough and smooth endoplasmic reticulum (ER) are highlighted. B)Idem for HepG2 lacking PRDX6 showing alterations in cellular and nuclear morphology as well as in hepatocytic organelles; mitochondria with less cristae and dilated endoplasmic reticulum cisternae are indicated. Insets showing an amplified selection from each type of cell have been included to show the different appearance of mitochondria; scale bars are indicated.
Fig. 6
Fig. 6
Growth characteristics of HepG2PRDX6−/-cell line. A) Cell count. B) Proliferation rate. Determinations were done after 24 h of cell culture in 4 different experiments (n = 4). C) CD95 levels in control and knockout cells determined by Western blot; membrane images in which WT (+/+) and KO (−/−) paired samples from different experiments (n = 4) were run in the same gel; membranes were cut at appropriate height according to expected migration of CD95 (≈38 kDa) to reveal with specific antibody. Loading in each lane was normalized to actin. Statistical significance was assessed by unpaired Student's t-test. Number of asterisks inversely proportional to the p-value (**< 0.005, * < 0.05).
Fig. 7
Fig. 7
Cell cycle parameters of HepG2(PRDX6−/-)cell line. Flow cytometry analysis showing the distribution of cells along the different cell cycle phases and those undergoing apoptosis in normal and PRDX6 knockout HepG2 cells. A) Recordings of cytometer fluorescence event counts of one representative experiment (purple, apoptotic cells; green, G0/G1 phases; pink, S phase; orange, G2/M phases). B) Cell cycle phase distribution of the cells (n = 4; multiple t-test, ** p-value ≤ 0.005). C) Size of the nuclei determined as described in Materials and Methods section 2.4 (n > 500; unpaired, non-parametric Mann-Whitney test; Median and quartiles are shown, **** p-value ≤ 0.0001). (For interpretation of the references to color in this figure legend, the reader is referred to the Web version of this article.)
Scheme 1
Scheme 1
Cell cycle state in PRDX6 knockout HepG2 cells. The cell cycle is shown in the middle with a different color for each phase and the phase transitions and checkpoints indicated by intersecting thick short lines; proteins differentially expressed in HepG2PRDX6−/- cells as determined by quantitative proteomics are represented; processes and regulators predicted to be activated or inhibited by systems analysis have also been included; green and red vertical arrows indicate up- and down-regulated proteins, respectively; red crosses indicate inhibition; purple arrows and blunt lines indicate positive or negative action, respectively. Read subsection 3.7. in the main text for a full explanation.
Fig. 8
Fig. 8
Redox changes of PCNA Cys135-Cys162 in HepG2PRDX6−/-cell line. A) Cys-peptides of PCNA undergoing significant changes in their reduced/oxidized ratios in PRDX6 knockout HepG2 cells. The sequence of the peptides, the values and the fold change (FC) of their red/ox ratios and the statistical scores are shown. B) Structure of the protein highlighting its ring-shape (PDB 3VKX (Punchihewa et al., 2012)); the red square highlights a region of the protein involved in interaction with its partner regulatory proteins. C) inset: detail of the residues clustered around in the red square, twisted 180°, showing Cys135 and Cys162 close enough (3.06 Å) to form a disulfide bond (orange dotted line); Ser228, essential for interactions with regulatory proteins (Baple et al., 2014), is connected to Cys135 by a hydrogen bond (blue line); and Lys164, site for ubiquitination and sumoylation; Image made using UCSFChimera (Pettersen et al., 2004). Baple et al., 2014. J. Clin. Invest. 124:3137–3146. https://doi.org/10.1172/JCI74593. Pettersen et al., 2004. J. Comput. Chem. 25:1605–1612. https://doi.org/10.1002/jcc.20084. Punchihewa et al., 2012. J. Biol. Chem. 287:14289–14300. https://doi.org/10.1074/jbc.M112.353201. . (For interpretation of the references to color in this figure legend, the reader is referred to the Web version of this article.)
figs1
figs1
figs2
figs2
figs3
figs3

Similar articles

Cited by

References

    1. Chen J.W., Dodia C., Feinstein S.I., Jain M.K., Fisher A.B. 1-Cys peroxiredoxin, a bifunctional enzyme with glutathione peroxidase and phospholipase A2 activities. J. Biol. Chem. 2000;275:28421–28427. doi: 10.1074/jbc.M005073200. - DOI - PubMed
    1. Pedrajas J.R., McDonagh B., Hernandez-Torres F., Miranda-Vizuete A., Gonzalez-Ojeda R., Martinez-Galisteo E., Padilla C.A., Barcena J.A. Glutathione is the resolving thiol for thioredoxin peroxidase activity of 1-cys peroxiredoxin without being consumed during the catalytic cycle. Antioxidants Redox Signal. 2016;24:115–128. doi: 10.1089/ars.2015.6366. - DOI - PubMed
    1. Rhee S.G. Overview on peroxiredoxin. Mol. Cell. 2016;39 doi: 10.14348/molcells.2016.2368. 1–5. - DOI - PMC - PubMed
    1. Fisher A.B. Peroxiredoxin 6: a bifunctional enzyme with glutathione peroxidase and phospholipase A activities. Antioxidants Redox Signal. 2011;15:831–844. doi: 10.1089/ars.2010.3412. - DOI - PMC - PubMed
    1. Fisher A.B., Dodia C., Sorokina E.M., Li H., Zhou S., Raabe T., Feinstein S.I. A novel lysophosphatidylcholine acyl transferase activity is expressed by peroxiredoxin 6. J. Lipid Res. 2016;57:587–596. doi: 10.1194/jlr.M064758. - DOI - PMC - PubMed

Publication types

MeSH terms

Substances